Bollinger Bands Strategy with Intraday Intensity IndexFor Educational Purposes. Results can differ on different markets and can fail at any time. Profit is not guaranteed.
This only works in a few markets and in certain situations. Changing the settings can give better or worse results for other markets.
This is a mean reversion strategy based on Bollinger Bands and the Intraday Intensity Index (a volume indicator). John Bollinger mentions that the Intraday Intensity Index can be used with Bollinger Bands and is one of the top indicators he recommends in his book. It seems he prefers it over the other volume indicators that he compares to for some reason. III looks a lot like Chaikin Money Flow but without the denominator in that calculation. On the default settings of the BBs, the III helps give off better entry signals. John Bollinger however is vague on how to use the BBs and it's hard to say if one should enter when it is below/above the bands or when the price crosses them. I find that with many indicators and strategies it's best to wait for a confirmation of some sort, in this case by waiting for some crossover of a band. Like most mean reversion strategies, the exit is very loose if using BBs alone. Usually the plan to exit is when the price finally reverts back to the mean or in this case the middle band. This can potentially lead to huge drawdowns and/or losses. Mean reversion strategies can have high win/loss ratios but can still end up unprofitable because of the huge losses that can occur. These drawdowns/losses that mean reversion strategies suffer from can potentially eat away at a large chunk of all that was previously made or perhaps up to all of it in the worst cases, can occur weeks or perhaps up to months after being profitable trading such a strategy, and will take a while and several trades to make it all back or keep a profitable track record. It is important to have a stop loss, trailing stop, or some sort of stop plan with these types of strategies. For this one, in addition to exiting the trade when price reverts to the middle band, I included a time-based stop plan that exits with a gain or with a loss to avoid potentially large losses, and to exit after only a few periods after taking the trade if in profit instead of waiting for the price to revert back to the mean.
Bollingerbandstrategy

Bollinger Bands Breakout StrategyBollinger Bands Breakout Strategy is the strategy version of Bollinger Bands Filter study version, which can be found under my scripts page. The strategy goes long when price closes above the upper band and goes short signal when price closes below the lower band.
Bollinger Bands is a classic indicator that uses a simple moving average of 20 periods, along with plots of upper and lower bands that are 2 standard deviations away from the basis line. These bands help visualize price volatility and trend based on where the price is, in relation to the bands.
The strategy doesn't take into account any other parameters such as Volume / RSI / Fundamentals etc, so user must use discretion based on confirmations from another indicator or based on fundamentals. The strategy results are based on purely long and short trades and doesn't take into account any user defined targets or stop losses.
The strategy works great when the price closes above/below upper/lower bands with continuation on next bar. It is definitely useful to have this strategy or the Bollinger Bands filter along with other indicators to get early glimpse of breach/fail of bands on candle close during BB squeeze or based on volatility .
This can be used on Heikin Ashi candles for spotting trends, but HA candles are not recommended for trade entries as they don't reflect true price of the asset.
The strategy settings default is 55 SMA and 1 standard deviation for Bollinger Bands filter, but these can be changed from settings.
It is definitely worth reading the 22 rules of Bollinger Bands written by John Bollinger if interested in trading Bollinger Bands successfully.

Bollinger Bands Technic + AlertReferred to the book "Bollinger on Bollinger Bands"
The best use of BB is to wait for squezze and breakout to capture the start of the trend.
Here the signal and target profit.
1. Long Signal when the close crosses above the upper BB and the Bandwidth of current bar exceeds 1.25 times of the previous bar (Volatility expands). : Green Triangle Up
2. Short Signal when the close crosses down the lower BB and the the Bandwidth of current bar exceeds 1.25 times of the previous bar (Volatility expands). : Red Triangle Down
3, Long TP when the upper BB turns down. : X cross Red
4. Short TP when the lower BB turns up. : X cross Purple
You can adjust any input of BB as well as how many times bandwidth changes from previous period.
I filter out the to high to buy signal by using ADX, if ADX over 50, the buy signal will be omitted.
As well as the TP signal , If the ADX is to low <35 , meaning it's has more room to go. the TP signal to be omitted.
Anyway , user can adjust all of this sensitivity.
As this is the trend following indicator, you will experience the bad signal during the sideways. That's life.
This is the semi discretionary system. You can use as a guideline along side with your other methods and money management.
Thank you!
Tanakorn Koomrampai CMT, CFTe
Fibonacci Bollinger Bands Alerts [QuantNomad]These are alerts for my Fibonacci Bollinger Bands Strategy. You can find more details and strategy description in it:
It's a pro indicator, you can have access to it for a small fee. Link to my PRO indicators you can find in my signature.
Disclaimer
Please remember that past performance may not be indicative of future results.
Due to various factors, including changing market conditions, the strategy may no longer perform as good as in historical backtesting.
This post and the script don’t provide any financial advice.
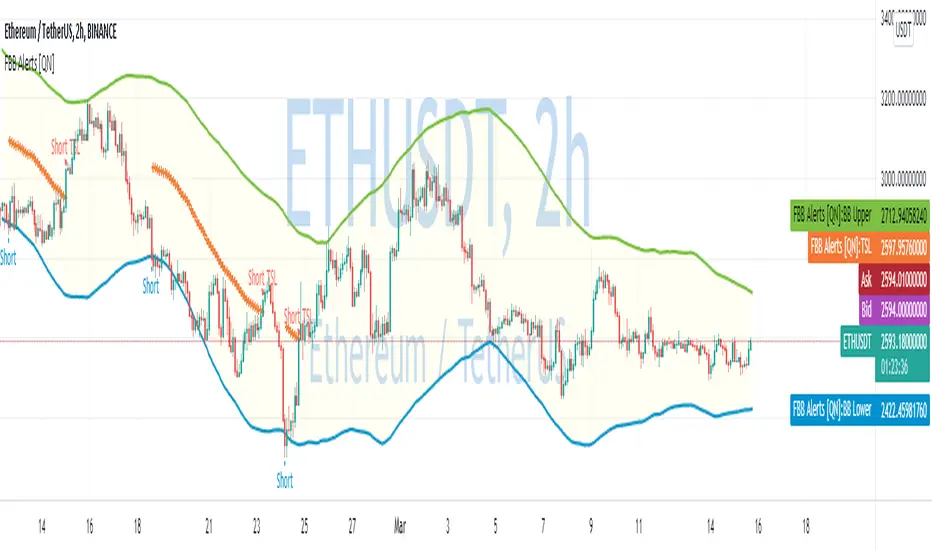
Fibonacci Bollinger Bands Strategy [QuantNomad]This strategy is modified Stanard Bollinger Bands Strategy. Instead of using standard deviation, I use a metric of how big is the range for the last X bars. Also, I’m using Fibonacci levels as multipliers for BB.
In this strategy you have a choice of 3 different Trailing Stop Loss types:
Standard % – standard percent based TSL
Fibonacci Level – close your position on another Fibonacci level or basis line of BB.
Parabolic SAR – Parabolic SAR adapted as trailing stop loss.
For Standard % and Parabolic SAR, you can use the “TSL Offset” parameter to set an initial offset for trailing stop loss.
Parameters
BB Length – Bolinger Bands Length
Fib Entry Level – Entry BB Multiplier level. Can be one of Fibonacci levels: 0.236, 0.382, 0.5, 0.618, 0.786, 1.000
Trailing SL Type – Type of Trailing Stop Loss used to close positions. Can be one of 3 types: “Standard %”, “Fibonacci Level”, “Parabolic SAR”
TSL Offset (%) – Initial offset for TSL. Applicable to “Standard %” and “Parabolic SAR”
TSL Fib Level – Fibonacci level used for “Fibonacci level” type of TSL
TSL PSAR Start / Increment / Maximum – parameters for PSAR type of TSL.
Strategy side – you can choose the side of the strategy. You can require strategy to go only Long, Short to Both sides.
From/To Day/Month/Year – you can use these parameters to set backtesting range to check the performance of your strategy on a specific range
It's a pro indicator, you can have access to it for a small fee. Link to my PRO indicators you can find in my signature.
Disclaimer
Please remember that past performance may not be indicative of future results.
Due to various factors, including changing market conditions, the strategy may no longer perform as good as in historical backtesting.
This post and the script don’t provide any financial advice.

Short in Bollinger Band Down trend (Weekly and Daily) // © PlanTradePlanMM
// 6/14/2020
// ---------------------------------------------------
// Name: Short in Bollinger Band Down trend (Weekly and Daily)
// ---------------------------------------------------
// Key Points in this study:
// 1. Short in BB Lower band, probability of price going down is more than 50%
// 2. Short at the top 1/4 of Lower band (EMA - Lower line), Stop is EMA, tartget is Lower line; it matches risk:/reward=1:3 naturally
//
// Draw Lines:
// BB Lower : is the Target (Black line)
// BB EMA : is the initial Stop (Black line)
// ShortLine : EMA - 1/4 of (Stop-target), which matches risk:/reward=1:3
// Prepare Zone : between EMA and ShortLine
// shortPrice : Blue dot line only showing when has Short position, Which shows entry price.
// StopPrice : Black dot line only showing when has Short position, Which shows updated stop price.
//
// Add SMA50 to filter the trend. Price <= SMA, allow to short
//
// What (Condition): in BB down trend band
// When (Price action): Price cross below ShortLine;
// How (Trading Plan): Short at ShortLine;
// Initial Stop is EMA;
// Initial Target is BB Lower Line;
// FollowUp: if price moves down first, and EMA is below Short Price. Move stop to EMA, At least "make even" in this trade;
// if Price touched Short Line again and goes down, new EMA will be the updated stop
//
// Exit: 1. Initial stop -- "Stop" when down first, Close above stop
// 2. Target reached -- "TR" when down quickly, Target reached
// 3. make even -- "ME" when small down and up, Exit at Entry Price
// 4. Small Winner -- "SM" when EMA below Entry price, Exit when Close above EMA
//
// --------------
// Because there are too many flags in up trend study already, I created this down trend script separately.
// Uptrend study is good for SPY, QQQ, and strong stocks.
// Downtrend Study is good for weak ETF, stock, and (-2x, -3x) ETFs, such as FAZ, UVXY, USO, XOP, AAL, CCL
// -----------------------------------------------------------------------------------------------------------------
// Back test Weekly and daily chart for SPY, QQQ, XOP, AAL, BA, MMM, FAZ, UVXY
// The best sample is FAZ Weekly chart.
// When SPY and QQQ are good in long term up trend, these (-2x, -3x) ETFs are always going down in long term.
// Some of them are not allowed to short. I used option Put/Put spread for the short entry.
//

Buy in Bollinger Band uptrend (Weekly and Daily) // © PlanTradePlanMM 6/14/2020
// ---------------------------------------------------
// Name: Buy in Bollinger Band uptrend (Weekly and Daily)
// ---------------------------------------------------
// Key Points in this study:
// 1. Long in BB Upper band, probability of price going up is more than 50%
// 2. Buy at the bottom 1/4 of upper band (Upper line - EMA), Stop is EMA, tartget is Upper line; it matches risk:reward=1:3;
//
// Draw Lines:
// BB Upper : is the Target (Black line)
// BB EMA : is the initial Stop (Black line)
// BuyLine : EMA20 + 1/4 of (Target-Stop), which matches risk:/reward=1:3 naturally
// Prepare Zone : between EMA and BuyLine
// buyPrice : Blue dot line only showing when has long position, Which shows entry price.
// StopPrice : Black dot line only showing when has long position, Which shows updated stop price.
//
// Add SMA(50) to filter the trend. Price >= SMA, allow to long
//
// What (Condition): in BB uptrend band
// When (Price action): Price cross over BuyLine;
// How (Trading Plan): Buy at BuyLine;
// Initial Stop is EMA;
// Initial Target is BB Upper Line;
//
// FollowUp: if price moves up first, and the EMA is higher than Entry point, Use EMA as new stop. At least "make even" in this trade;
//
// Exit: 1. Initial stop -- "Stop" when down first, close below stop price.
// 2. Target reached -- "TR" when up quickly, Target reached
// 3. make even -- "ME" when small up and down, Exit at entry Price
// 4. Small Winner -- "SM" when EMA above Entry price, Exit when close below EMA, and higher than entry Price
//
// --------------
// Because there are too many flags in up trend study already, I will create a down trend script separately.
// Uptrend study is good for SPY, QQQ, and strong stocks.
// Downtrend Study is good for weak ETF, stock, and (-2x, -3x) ETFs, such as FAZ, UVXY, USO, XOP, AAL, CCL
// -----------------------------------------------------------------------------------------------------------------
// Back test Weekly and daily chart for SPY, QQQ
// If it will be a big Gap down or a big down move, stop at close price could be a big loss; But this way could avoid may noise, to stay in a trending position longer.
// When buy in trending move, the position could be hold for a big range.
// The best samples are SPY and QQQ daily chart.
//
// Better to use another way to verify the long term up trend first.
// For single stock, it is better shows more relative strength than SPY.

Bollinger Bands Strategy - CohenIndicator based on the “Prince of NY” strategy developed by Rodrigo Cohen .
It consists in the use of Bollinger Bands, combined with a coloring rule to indicate places of purchase and sale.
An entry signal is given when a candle close outside the band, where, if the next one closes inside, there is the entrance, looking for the MA or the other band.
Red candle - indicates a sell signal.
Green candle - indicates a buy signal.

Double Bollinger Bands StrategyThe Strategy involves two Bollinger Bands (BB) at a go.
One with Divergence of 1 and another 2.
Strategy:
When the price rides above the inner BB, buy, check if it rides above the second BB. Exit when price falls inside the Outer BB and enters the Inner BB.
When the price rides below the inner BB, buy, check if it rides below the second BB. Exit when price rises inside the Outer BB and enters the Inner BB.
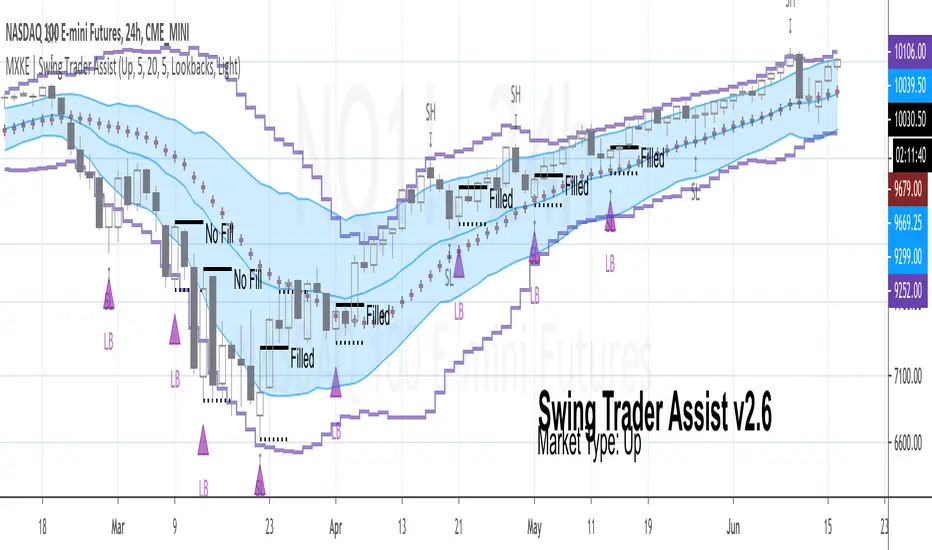
MXKE | Swing Trader AssistIntroduction
Swing Trader Assist indicator is designed to assist in the systematic identification of Hammers & Lookback signals within Uptrending markets, Stars & Lookback signals within Downtrending markets, and Mean Reversion signals within Sideways markets. The trader must first identify a strong market trend, then apply the indicator. Application of the indicator to weak trends will render equally weak signals. Application of the indicator to strong trends will render equally strong signals. Identification of strong trends is the responsibility of the individual trader and is instrumental to the successful deployment of this indicator and accompanying trading plan.
*Please comment below to request access*
*Please share with me on Twitter your usage and/or ideas for improvement so that I may improve this indicator in the future*
Market Types
Uptrend: Higher highs + Higher lows
Downtrend: Lower highs + Lower lows
Sideways: Higher highs + Lower lows (Expanding Range) or Lower highs + Higher lows (Narrowing Range)
Position Sizing
1R = .25%-2% of total nominal capital dependent upon timeframe and risk appetite
Order Types
Entry: Buy Stop 1 tick above High of “Up” Signal Bars; Sell Stop 1 tick below Low of “Down” Signal Bars
Stop: Bar Close <= 1 tick below Low of “Up” Signal Bar; Bar Close >= 1 tick above High of “Down” Signal Bar
Profit Target: 1.5R distance from “Up” or “Down” fill level with the option to trail stop on each new swing high/low; Bollinger Band Midline minimum 1.5R distance from “Sideways” fill level with option to trail stop on continuation to the opposite end of the range (opposite Bollinger Band)
Trading Plan
❑ Market Type is clearly identifiable as Up, Down or Sideways
❑ Swing Trader Assist indicator is set to the corresponding Market Type: Up, Down or Sideways
❑ Position size is no more than .25%-2% of total nominal capital (based on distance from Signal Bar fill level to Signal Bar stop level as 1R)
❑ Distance from Signal Bar fill level to potential Profit Target is minimum 1.5R
❑ On Hammer or Star fill: close position into trend extension at 1.5R+ or adjust trailing stop on each new swing high/low
❑ On Mean Reversion fill: close position at midline or adjust trailing stop on each continuation to opposite end of range
Usage Notes
The indicator will display developing signals intrabar and it is therefore suggested to wait until bar close to act on any signals. “Autodetect” setting under “Market Type” is currently in beta mode. While it is designed to reveal only relevant signals within strong trends based on a series of EMAs, this setting has not been extensively tested. Use with caution.
The indicator is not meant to be a mechanical trading system. It is designed to assist the trader in objectively and systematically identifying signal bars during the execution of the below swing trading plan. It is up to the trader to determine if overall price action warrants acting upon the signal bars or not.
Case Studies
Luckscout's Double Bollinger Bands StrategyLong Trade Setups:
To go long (to buy), you have to wait for one of the candlesticks to close above the BB upper band. (background color is green)
Short Trade Setups:
To go short (to sell), you have to wait for one of the candlesticks to close below the BB lower band. (background color is red)
How To Maximize Your Profit?
As I explained above, this trading system is good in catching the trends. Therefore, you’d better to take the advantage of the strong movements and maximize your profit.
When there is a strong trade setup, you can also take two positions with the same stop loss, when there is a trade setup based on the Double Bollinger Bands trading system. Set a 2 x SL target for the first position, and no target for the second one. If the first position hits the target, move the second’s position stop loss to breakeven and hold it (TLDR : Hold a sell as long as background is red)
In case of a long position, hold the second position as long as the candlesticks form between the BB1 and BB2 upper bands, or above the Bollinger Middle Band. Close the second position when candlesticks start crossing the BB1 upper bands, or when one of the candlesticks breaks below the Bollinger Middle Band . (TLDR : Holda buy as long as background is green)
ORTI Bollinger Bands V3 (Static Timeframe Multi-Period)The "ORTI Bollinger Bands V3 (Static Timeframe Multi-Period MA)" is public scrypt, based in a previous study, but with some better functions (“ORTI Bollinger Bands V2 (Static Timeframe Multi-Period MA”).
This is a redesigned and recalculated set of the common plotted lines with the typical two "Standard Deviations" (positively and negatively) away from the original calculation of a "Simple Moving Average" of the security's price.
But now, with the option to convert the "Simple Moving Average" to adapt into 9 different kinds of "Moving Averages", to have a much more robust indicator which in turn would serve both as "Bollinger Bands" and by any of the most used "Moving Averages", a hybrid basically.
The following options to convert the "Simple Moving Average" ( SMA ) to:
• Exponential Moving Average ( EMA )
• Weighted Moving Average ( WMA )
• Arnaud Legoux Moving Average ( ALMA )
• Hull Moving Average ( HMA )
• Volume-weighted Moving Average ( VWMA )
• Least Square Moving Average ( LSMA )
• Smoothed Moving Average ( SMMA )
• Double Exponential Moving Average ( DEMA )
The cherry on the top , for this private version: is when you want to get a predetermined count in "natural temporalities" as minutes, hours or days, in any graph you could get a static average, and this count will be automatically respected. For example, a "Moving Average" could be configurated to know a trend per day, week or month... or whatever comes to mind, and at every single chart that you move through (5m, 15m, 1h, 4h, etc), you will see the same average to make your own "trend analysis" into a micro/macro market view.
As in traditional "Bollinger Bands", the "Standard Deviations" are still a measure of volatility , when markets become more volatile, bands widen, during the less volatile periods, the bands contract.
A common fact in trading is that, prices vary most of the time and there is a lot of truth in this assertion, since the markets consolidate mainly as bullish andbearish . Market trends are sometimes very rare, so trading them may not be as easy as you might think. If we look at prices in this way, we can define the trend as a deviation from the norm (rank).
Usually, most Traders use “Moving Averages” to identify commercial areas and analyze markets. A “Moving Average” helps the Trader isolate the trend a lot and can also indicate when a trend may be receding.
The importance of using any of the “Moving Averages” in the “Bollinger Bands”, becomes a reality and reveals the average price of a marketable instrument in a given period of time. However, there are different ways to calculate the averages, and that is why there are different types of “Moving Averages”. They are called "in motion" because, as the price moves, new data is added to the calculation, thus changing the average.
The base of the “Bollinger Bands” measures and represents the deviation or volatility of the price and this is the reason why they can be very useful to identify a trend. Even the use of two sets of “Bollinger Bands”, one generated with the parameter "one Standard Deviation" and the other with the typical configuration of "two Standard Deviations", can help us to see the price in a different way.
Another great advantage of “Bollinger Bands” is that, they adjust dynamically as volatility increases and decreases. As a result, the “Bollinger Bands” automatically expand and contract in synchronization with the price action, creating an envelope of precise trends.
Note: The previous calculation example is not the default, the parameters can be adjusted according to the criteria of the merchant.
As everyone knows, and as you can find on the internet, the "Moving Averages" are one of the most commonly used technical indicators in Stock, Futures , Forex and Crypto trading. Market analysts and traders, use "Moving Averages" to help identify trends in price fluctuations, smoothing out the noise and short-lived spikes (from news and earnings announcements, for example) for individual securities or indexes.
They are calculated by adding recent closing prices and then dividing that by the number of time periods in the calculation average. A simple, or arithmetic, a "Moving Average" that is calculated by adding the closing price of the security for several time periods and then dividing this total by that same number of periods. Short-term averages respond quickly to changes in the price of the underlying, while long-term averages are slow to react.
There are different types of "Moving Averages", calculated in different ways and over different time periods, which reveal different information for traders. The type of "Moving Average" and measurement period used determine the strategies a trader implements. So, many traders watch for short-term averages to cross above longer-term averages to signal the beginning of an uptrend. Short-term averages can act as levels of support when the price experiences a pullback.
As is usual, traders and market analysts commonly use several periods in creating "Moving Averages" to plot on their charts. For identifying significant, long-term support and resistance levels and overall trends, but they only consider the 50-day, 100-day and 200-day moving averages as the most common. Based on historical statistics, these longer-term moving averages are considered more reliable trend indicators and less susceptible to temporary fluctuations in price.
There is such popular trading patterns that use "Simple Moving Averages" include the “death cross” and a “golden cross”. A “death cross” occurs when the short period "Moving Average" crosses below the long period "Moving Average" and this is considered abearish signal that further losses are in store; the “golden cross” occurs when a short-term "Moving Average" breaks above a long-term moving average, this can signal further gains are in store, that is interpreted as bearish .
The 5-, 10-, 20-, and 50-day moving averages are often used to spot near-term trend changes. Changes in direction by any of these shorter-term "Moving Averages" are watched as possible early clues to longer-term trend changes. Crossovers of the 50-day moving average by either the 10-day or 20-day "Moving Averages" are regarded as significant. The 10-day "Moving Average", plotted on an hourly chart, is frequently used to guide traders in intraday trading.
For more technical information: Investopedia
But why we have to use in our TECHNICAL ANALYSISthe same Moving Averages (10, 20, 30, 50, 100 and 200) for all time frame OHLC charts (1m, 5m, 15m, 1h, 4h, 1d, 1w and 1m)? That does not make any sense.
This is when you must go back to (statistic) basics: reliability and validity are a very important aspects of selecting a survey instrument. Reliability refers to the extent that the instrument yields the same results over multiple trials. Validity refers to the extent that the instrument measures what it was designed to measure.
Content validity measures the extent to which the items that comprise the scale accurately represent or measure the information that is being assessed. Are the real traders answering this question, that are asked representative of the possible data that they are trying to read? Well, I think maybe not.
Such as correlations, to verify the relevance of the “timeframe” questions, we could start at… Operation hours, the first data that has you should find may be is correlated with questions from: Does your trend indicator has a straight relationship of time under your time-analisys examination to determine if validity is present? If the scores are highly correlated, it is called convergent validity, then if convergent validity exists and validity is supported.
Criterion-related validity has to do with how well works the counting from the instrument, as a known outcome they are expected in a real, natural and measurable lapse time. Such as correlations are used to determine if criterion-related validity your counting data, would must be at: minutes, days, weeks, months, etc.
That is when we start with the rhythm, as in music. If your trading day in operation at Forex is made up of 24-hours, during 5-days of the week, there you have your first clue. Now, what did you want and have to measure? Well, first of all you need a daily, weekly and monthly count to begin with all your indicators.
For some reason, there are a lot of questions about time and calendars which all are answered by reference to astrology, because the original purpose of astrology was to create a reliable method of measuring the passage of time, the clock by which we live our lives: 12 Hours. It is very interesting!
Even though there are really 24 hours in a day, but therefore you would think we should have 12-time units in our day, not 24, each of which is twice as long as our current hour. But the only reason we would think like this is because we have forgotten about the way ancient astrology divides the time lapses into smaller units.
And now, the next step is when you should refresh your elementary school classes, those mathematics that I'm pretty sure you so hated: relation of prime numbers, compound numbers, divisible numbers and multiples.
You may think about the relationship that exists between the time period and the operative session, as well as the chart that you are consulting; so then, you must find the ideal configuration of those numbers that are only divisible between themselves and 1, or the numbers that besides being divisible by themselves and the unit and are also divisible by other numbers.
For example: for an hourly chart, if a day is divided into 24-hours in base of the number 12, is because it has a larger number of integer factors: 12/6=2, 12/4=3, 12/3=4, 12/2=6. Son then, all of your other indicators should find this relation.
This is when you must start questioning yourself, if you are really working with an adequate configuration of Moving Averages and Oscillators?
Another example:
• Relative Strength Index (14)
• Stochastic %K (14, 3, 3)
• Commodity Channel Index (20)
• Average Directional Index (14)
• Momentum (10)
• MACD Level (12, 26, 9)
• Stochastic RSI Fast (3, 3, 14, 14)
• Williams Percent Range (14)
• Ultimate Oscillator (7, 14, 28)

Bollinger Band BreakoutIt is a long only strategy.
1. Buy when price breaks out of the upper band.
2. Exit has two options. Option 1 allows you to exit using lower band. Option 2 allows you to exit using moving average.
3. Option 1 preferred over option 2 if the instrument is highly volatile.
4. Slippage and commissions are not considered in the return calculation.

(Poshtrader) Bollinger Band SqueezeThe Bollinger Band Squeeze is a trading strategy designed to find consolidations with decreasing volatility. In its simplest form, this strategy is neutral and the ensuing break can be up or down. Traders, therefore, must employ other aspects of technical analysis to formulate a trading bias to act before the break or confirm the break. Acting before the break will improve the risk-reward ratio.

BBPivotIt can helps you to see BB pivots . It's based on bollinger bands .
Best Settings: (20,3) - (50,2)
Cheers :)

MTF Bollinger Bands - ModifiedModified version of tansancrypto's MTF Bollinger to Pinescript 4 and removed limiters on BB1/BB2 max Sigma values.
Original Script:

Bollinger bands/Lagging span crossHello my dear ambitious traders
I'm working hard this week to publish some great indicators this week and open sourced. Hope you'll enjoy, learn and use them.
This will be my greatest reward but comments showing appreciation are also very welcomed (actually likes too) :)
For today, I'll share a simple indicator but it's coming along with some insightful knowledge ^^
Anyway, I'm not here to ask you to this but to share a very cool indicator I made a few months ago and wanted to share for FREE with the community today
The indicator is related to this educational post : What-a-Bollinger-Bands-Lagging-span-cross-can-tell-us/
This trading technique was invented by Robbytrade, a famous french trader twitter.com
I wanted to have those visual signals on the chart so I coded it.
The advantage of being a developer is that you can litteraly code what you miss and get your life better in the process. The one that will find a way to code a new form of money will be rich... wait.... that guy is called Satoshi Nakamoto...
That's all for me today my friends
PS
Trying to update the Trade Manager shared yesterday with some cool features. More to come in the upcoming days
Enjoy
Dave

BB - Study - CryptoFoudid.comHi everyone,
A new script transformed on a study from QuantNomad.
Based on the Bollinger Bands to catch the range market.
I filtered the consecutive signals to avoid a "funding" issue.
You can configure it as you want based on inputs.
The best way for crypto is to have about 45 to 55 length and 2 to 3.5 in multiplier but it's your choice :)
ENJOY !

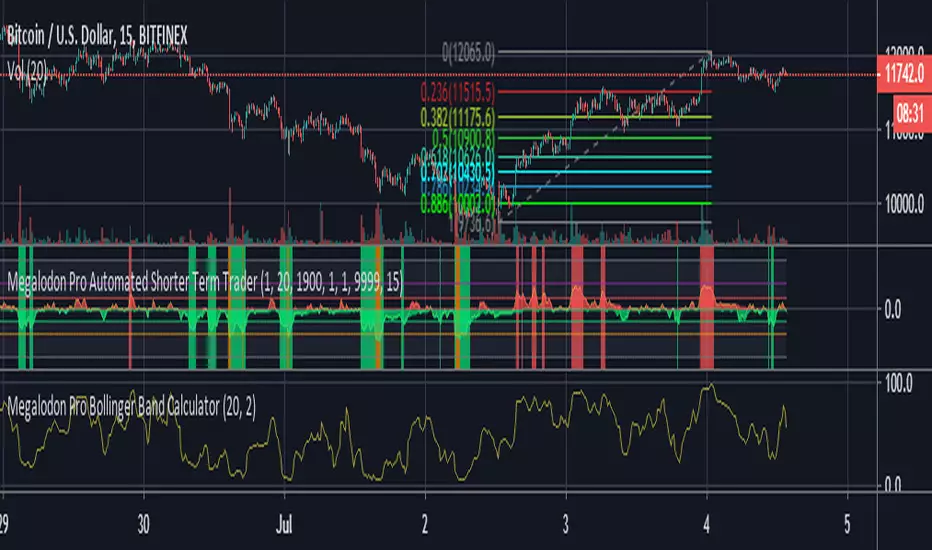
Megalodon Pro Bollinger Band CalculatorHow to use?
It ranges between 0-100. 0 is oversold, 100 is overbought.
It could be a really beneficial tool for timing your day trades in lower time frames.
It is designed for 1 minutes - 15 minutes - 30 minutes - 60 minutes - 240 minutes - 1 Day time frames.
(JS) Bollinger Band Momentum Average Trailing StopsA tool I made to use alongside the Bollinger Band Momentum Average - fairly simple to use. It has the same settings as the BBMA so you can match them together.
If you prefer a wider stop than a close on the opposing side of the BBMA, this is for you.
The "stop" is triggered by a close on the other side of the stop line line turns red whenever the stop is triggered.
The calculation is simple:
The stop on the short side it is High - BBMA over the length of time you select to use (20 is default).
On the long side, it is BBMA - Low also over the preferred length of time you select to use.
Note: Just shorten the length to make a tighter stop.


Bollinger Bands Trading SignalsFeatures:
Trading signals based on Bollinger Bands trading strategy.
Powerful filter algorithm helps you avoid counter trade in trending market.
Getting Started:
Replace your Bollinger Bands indicator with this one.
You can see the trading signals and bands at the same time.
Contributing:
You can report bugs or issues under this page.
Any advice would be helpful for improving this indicator's accuracy.
Application:
This is an invite-only indicator.