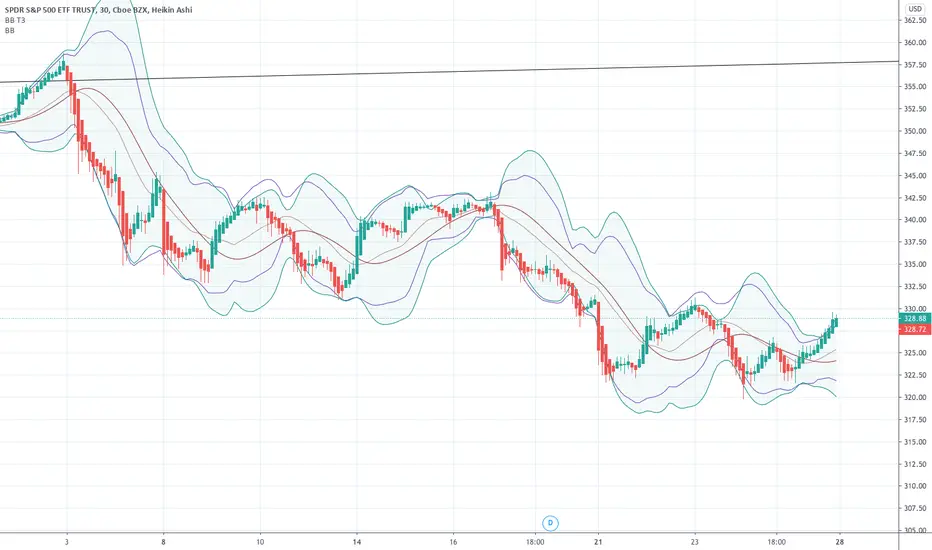
A smoother Bollinger BandThe Bollinger Band is a popular indicator due to it's ability to accurately predict future ranges based on prior volatility. However the bands can fluctuate wildly as a result of acute changes to the price. This results in a channel that is sensitive though replete with sharp angles. Replacing the simple moving average basis line with a Tillson T3 moving average results in a smoother albeit slower basis line. Deriving the bands from partially smoothed data results in more continuous bands than those of the original equation.
Bollinger Bands (BB)
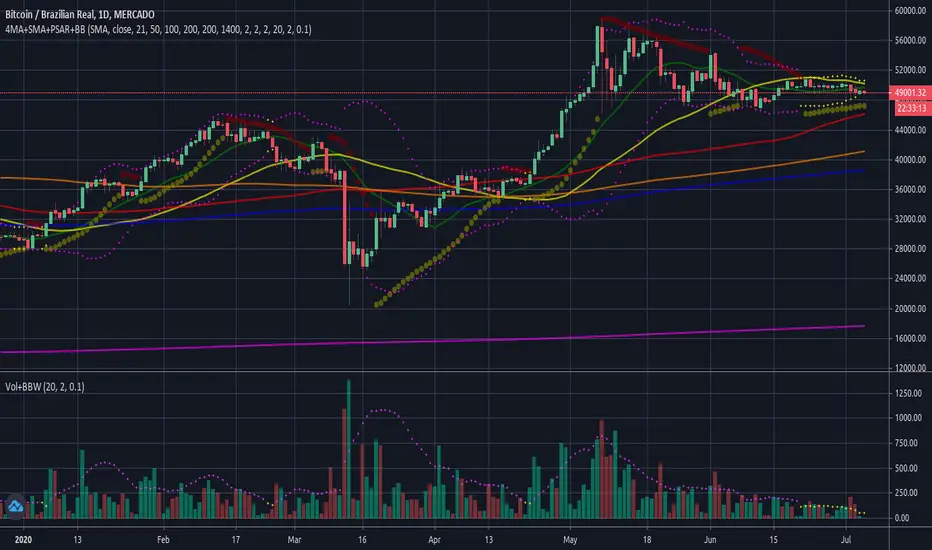
GLANTALL AT A DEEP GLANCE
Monitor the whole market at a glance
Give your analysis double-dimensional depth
With the help of this assistant , you can quickly aware about the various dimensions of the market and improve the quality of your trading experience.
Everything is clear in the picture so I will avoid further explanation.
All functions are controllable and highly customizable
Get instantly and accurate report of
Volume
Volume changes
Volume is higher or lower than average
Volume significant increase
2 oscillators of your choice, each one at 4 time frame of your choice, at the same time (Stoch, RSI, StochRSI, MFI, StochMFI)
Selected oscillators changes and direction
Selected oscillators divergences with full coordinate
Bollinger bands
Bollinger bands middle line changes
Bollinger bands width changes and direction
Amount of volatility
4 moving averages as type as your choice at a same time (SMA, EMA, WMA, HMA)
Mark up the moving averages as dynamic support or resistance
Crosses of the 4 averages as type as your choice at a same time (SMA, EMA, WMA, HMA) (completely separately than above mentined MAs) with full coordinate
More than 500 line code.. but Clean and Clear !
Gifts to all of you dear ones.

EMA ICHI BB [Rogulabo]3 indicators in 1.
Included Indicators are:
- EMA 8,13,21,55,100,200,450
- Ichimoku
- Bollinger Band
These can be used to determine changes in trends when:
- EMA's collide, trajectories shift, or certain levels are reached.
- Ichimoku cloud is above or below the candles.
- Bollinger Band's width changes, or range is broken.
Reasons for 3 in 1 assembly:
This indicator is intended to be used by students, and followers of Dan Takahashi
(a prominent educator of investing in Japan who is also a user of TradingView) .
Those who wants to use and learn with the same setup as Dan, would greatly benefit from this since,
the complex setting up process which can be a pain for beginners can be skipped with a simple click.
Every stylistic choice of color and placement were made to make it similar to the chart used by Dan.
Simple customizations are available such as:
- Changing color
- Changing the values
- Hide/show controls
Notes:
This is intended to be used alongside “STOCH RSI ” for the complete the setup.
Any questions, please refer to:
@rogulabo
==
高橋ダンさんが使用されてるチャートと同様のセットアップの為にご活用ください。
複数のインジケータをグループにしておりますので、無料版を使われてる方は効率よく使っていただけると思います。
また、“STOCH RSI ”どいうタイトルのインジケータも同時に公開しておりますので、セットアップを完成させたい方はこちらもご活用ください。
以下のインジケータを含みます。
・EMA線
・一目均等表
・ボリンジャーバンド
カスタマイズされたい方はご自由に値を変更ください。
ご質問は @rogulabo までよろしくお願いいたします。

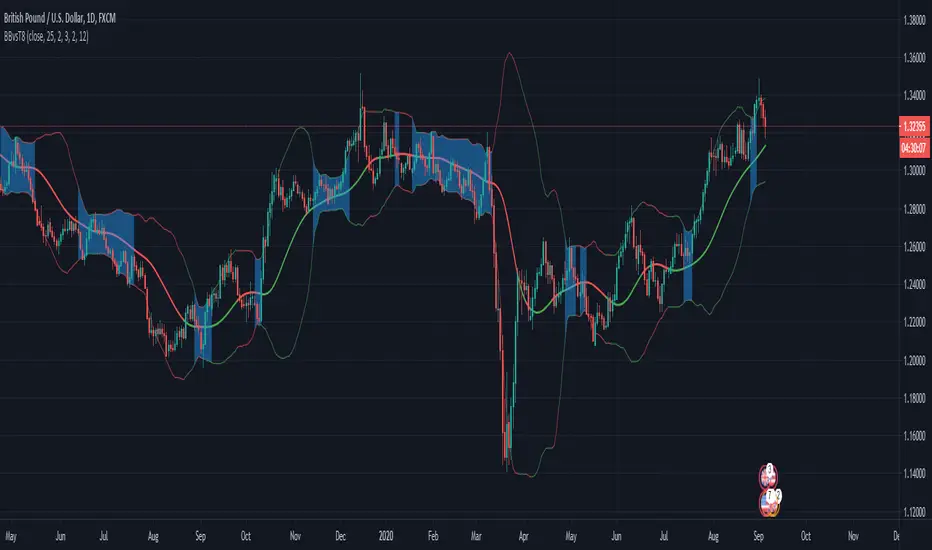
Bollinger Bands combined with Telson T8Indicator idea based on classic Bollinger bands and Telson T8 moving average.
The indicator detects Bollinger bands narrowing which should predict a move to a direction.
NOTE: You need to define in the indicator settings (Narrow percentage) the percentage between the upper and lower bands that would be highlighted.
For example: if you set 5%, the indicator will highlight the parts that the upper and lower bands are less than 5% compare the current price (usually close price, but you can define otherwise)
Use the Telson T8 to determinate the trend/direction of the move.
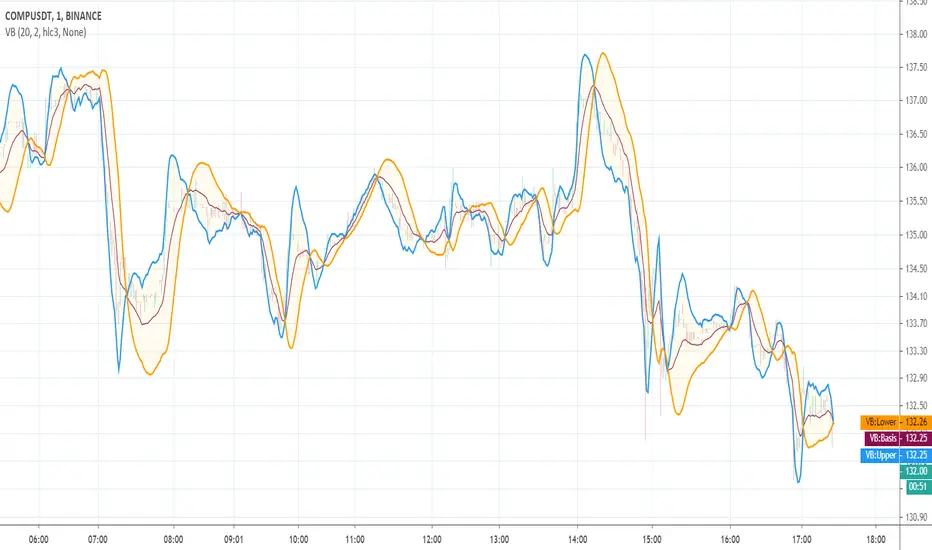
Price Volume Strength ComparatorBollinger bands says whether price or any source is relatively high or low at any particular point of time. We can apply Bollinger bands on RSI and volume indicator Price Volume Trend to identify if RSI movement or PVT movement is relatively high or low.
By calculating Bollinger %B, we can define the variation in a range between 0 to 1. By applying Bollinger %B on price, volume and strength, we are trying to compare how much they differ relative to each other.
For example, if Bollinger %B of volume is higher than Bollinger %B of price, which may mean, we can still expect continuation of upward movement. If volume %B is lesser, we can interpret this as price has moved more than the volume and may retrace back.
Note: I tried adding multiple volume/strength indicators as input choice. But, if condition did not work with simple string. Have no idea why. I will try adding that later if more people show interest.

GM All-purposeThis script plots multiple EMA's also it shows you when a particular EMA crosses up or below another EMA. You can customize the EMA's based on your setups or preferences.
This script basically will help you easily identify when a particular EMA has crossed over or crossed under another EMA at one glance.
Particularly useful when there is a lot of entanglement of the EMA's
There is also dual Bollinger Bands & Donchian Channels that are available to check the volatility of that particular scrip, which will help you stay in the trade or exit based on your criteria.

BBVV Low IndicatorThis is an indicator that flags the lowest Bollinger Bands Width value for a set number of bars back.
This is based on my BBVV script seen here
Each dot on the BBVV indicator marks the rolling "X"-period low in BBVV value. You can set "X" as any number of bars back in the settings of this indicator.
This can be used to accurately predict when periods of high-volatility could come into play due to continually contracting Bollinger Bands on a time-frame that you can set manually.
Created from a request from a user.

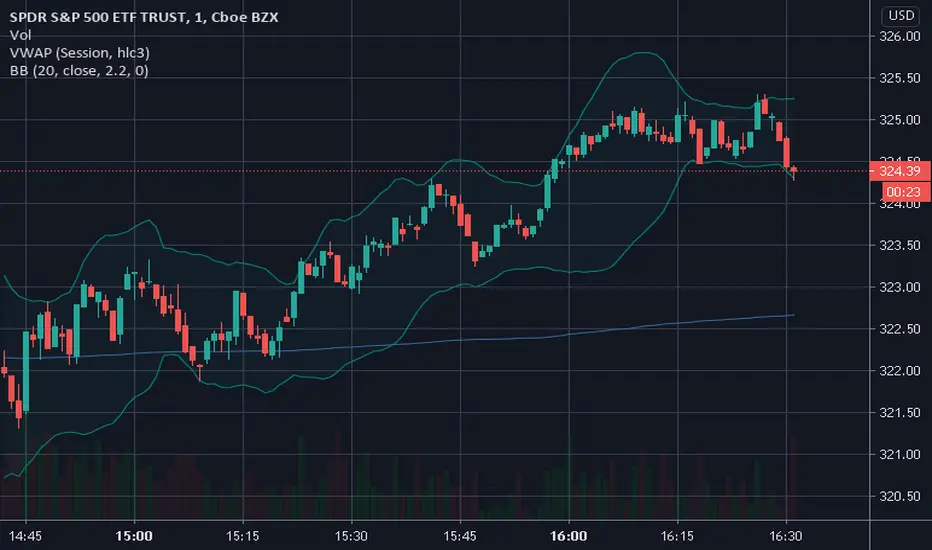
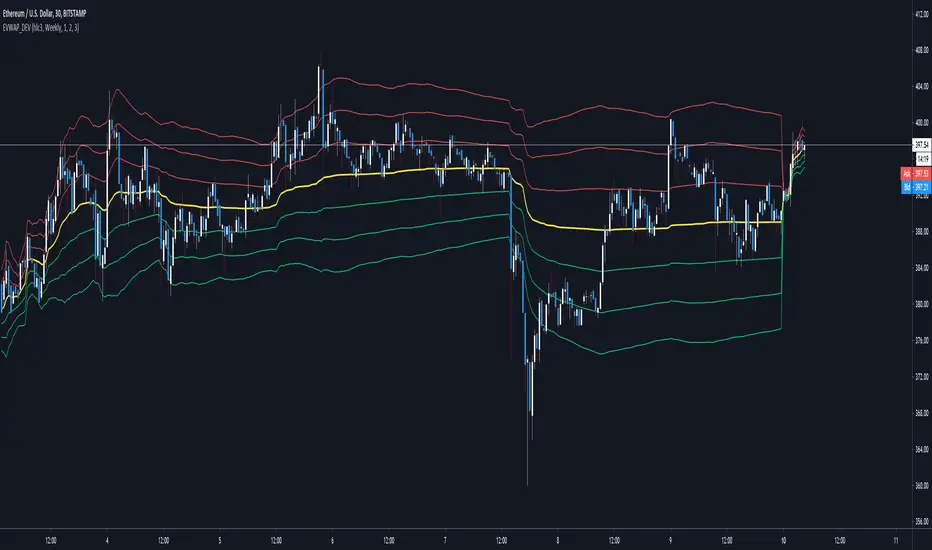
Exponential VWAP & DeviationsExponential Volume Weighted Average Price and Deviations.
Selectable intervals (daily/weekly/monthly/yearly vwap). Options to change deviation multipliers and display interval closing values for the previous interval.
Uses volume weighted EMA for the interval as the basis/vwap & exponential deviations calculated using the exponential vwap as the mean.
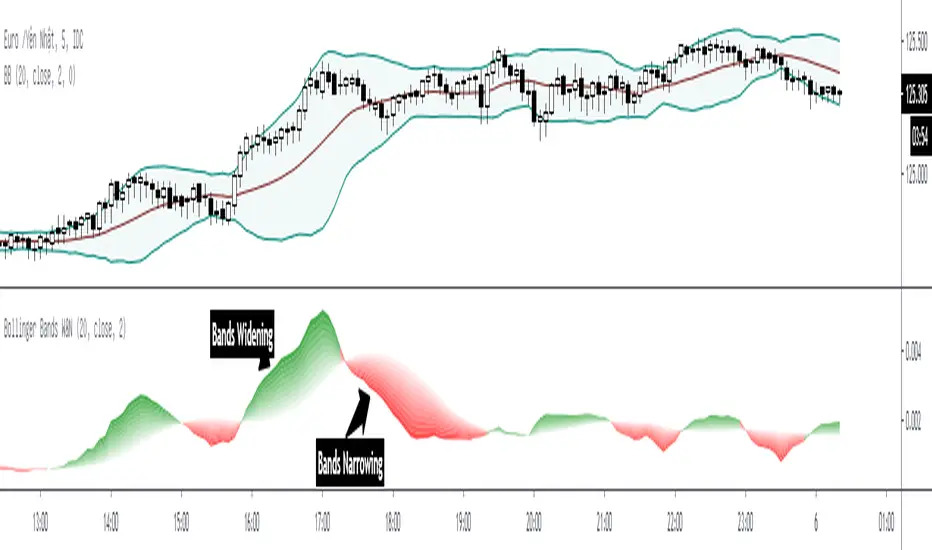
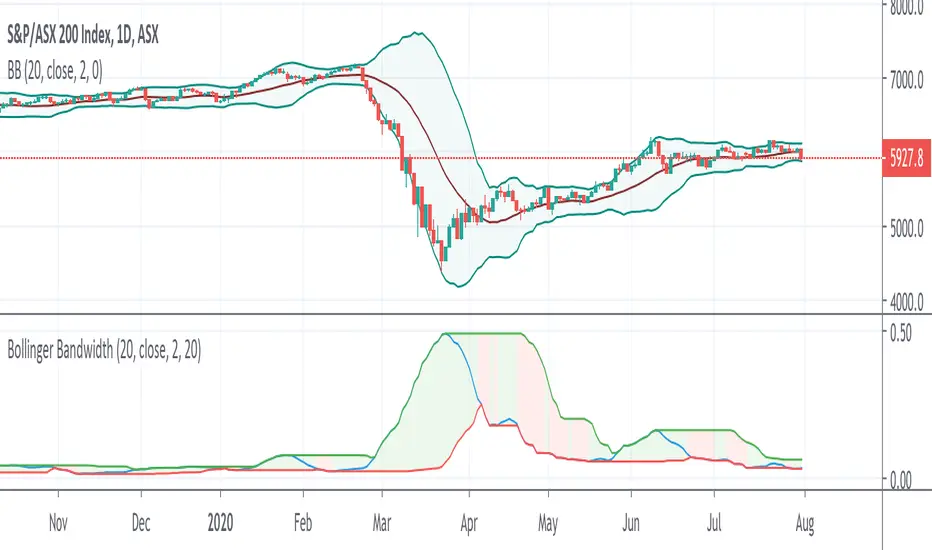
Bollinger Bands Wide & Narrow* Bollinger Bands Wide & Narrow apply a Simple Moving Average (SMA) on Bollinger Bands Width with same period of middle bands to regconize the bands are widening or narrowing.
* "Bands Widening" is marked by green shade.
* "Bands Narrowing" is marked by red shade.
Bollinger Bandwidth - Bulge and squeezeThis is Bollinger bandwidth indicator:
Bandwidth = high-low/main
I have added lowest and highest of N periods to programmatically identify bulge and squeeze. When bandwidth at N periods low, it is in squeeze. If bandwidth at N periods high, it is in bulge.
CDub's BolBands SetupUses a set of Bollinger Bands (user defined deviation, user defined deviation * 2) to determine possible entry set ups.
Signals are triggered when price crosses the first band (closest to the baseline MA) in the desired direction.
baseline can be your take profit 1 target
The inside band determines entry and can be used as a take profit 2 target (Opposite side of baseline)
The outside band is a suggested stop loss target (Same side of baseline) and can be used as a take profit 3 target (Opposite side of baseline)
Suggestions are welcome!
-CDub

Vortex BandsA slighty modified version of Better Bollinger Bands. The idea of the experiment was to do a thing like the well-known Vortex Indicator, but an overlay:
Obvious trading rules are:
go Long when the blue line is above other two
go Short when the orange line is above other two
stop when price crosses the basis line
The tool is EXPERIMENTAL . Good luck!
Bollinger band 1+2Bollinger band with 1 and 2 standard deviation
Default with 21 SMA
Also count number of candlesticks of previous trend when crossing 1 standard deviation

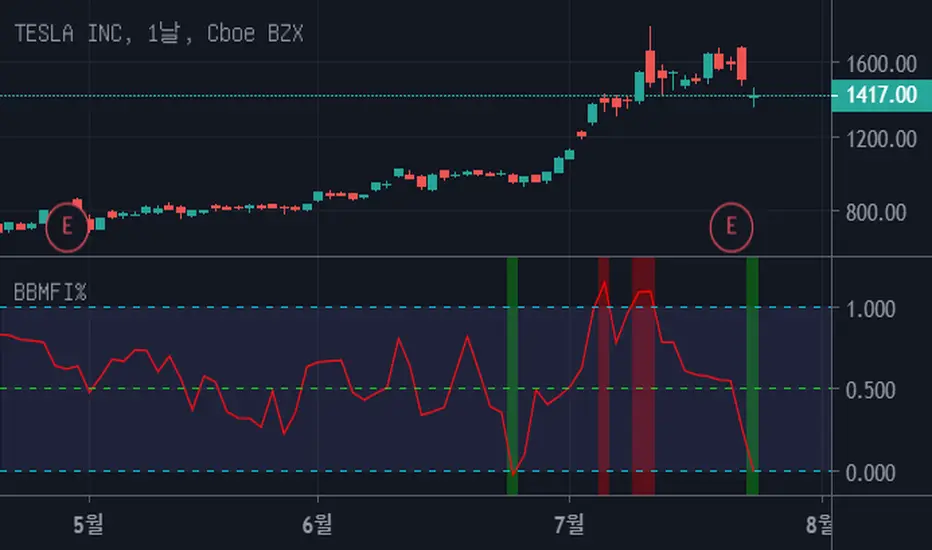
Bollinger Bands Money Flow Index %This script is similar to the previous one "Bollinger Bands Money Flow Index" but it's a little easier to interpret.
Fix the top line of the "BBMFI" to 1, and the bottom line to 0.
Indicates where "Money Flow Index" is located between the top and bottom lines.
If it's bigger than 1, it's overbuying. If it's less than 0, it's overselling.
Consider a trade if you are out of range from 0 to 1.
It's also a good trade timing to out of range and come back in.
Bollinger Bands Money Flow IndexThis script embodies the application of the Bollinger Band and Money Flow Index in John A. Bollinger's book "Bollinger on Bollinger Bands."
"Bollinger on Bollinger Bands" suggests a relatively method of analysis by applying the Bollinger Band to an indicator.
Here's one of the indicators, Money Flow Index.
Money Flow Index is an indicator of overbuying and overselling by reflecting the volume of transactions.
"Bollinger on Bollinger Bands" suggests using the Bollinger Band to create relative top and bottom lines for various indicators, such as Money Flow Index.
Original Money Flow Index is considered to be over-purchased if it is more than 80% and over-selling if it is less than 20%.
But if you put a bolinger band on it, you can set the standard for higher or lower over-selling and over-selling in a sustained bullish, bearish market.
This script uses the following values as the default values as recommended by "Bollinger on Bollinger Bands".
Money Flow Index for 10 days.
a bollinger band of forty days
standard deviation of 2
The above values are suitable for most stocks and markets, but sometimes there is too much or too little data inside the Bollinger Band.
It is recommended to modify each value little by little to adjust 85% to 90% of the total data to fit inside the Bollinger Band.
If the value is higher than the top line, it is considered over-purchased, and a red background color appears.
If the bottom line is crossed down, it is considered over-sold and the green background color appears.

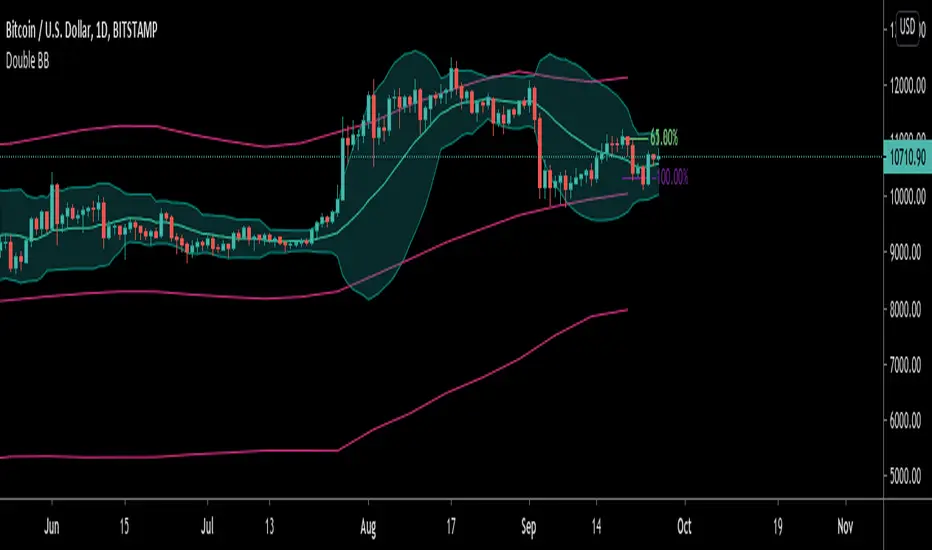
Double Bollinger BandThe double bollinger band indicator uses a normal bollinger band with a multitude of 2 and on outer band with a multitude of 3. The indicator shows momentum by the price being stuck between the higher or lower bands. If price is in the middle then it is a neutral zone. The band's moving average is a default of 20 sma but included there are two extra simple moving averages just as extra indicators. This is my first published code and the code is messy; however, it gets the job done nice and simple. (:
Enjoy!

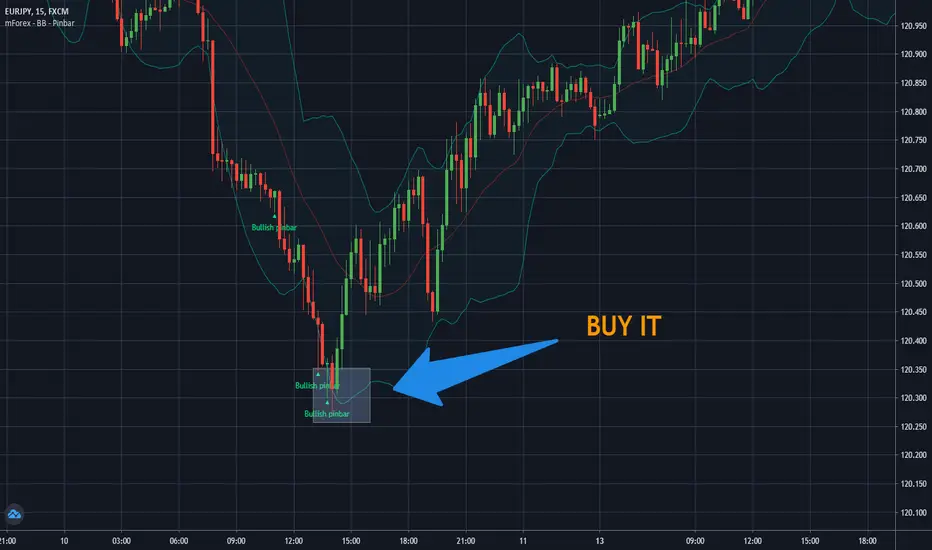
mForex - Bollinger Bands - Pinbar scalping systemTransaction setup parameters
Time frame: M5, M15
Currency pair: Any except XAU/USD
Trading strategies
=== BUY ===
Price break out of the lower Bollinger Bands
The Pinbar reversal candlestick appears and closes the candle on the lower Bollinger Bands
Stop loss: Nearest bottom + 3-5 pips
Profit target: 10-20 pips
=== SELL ===
Price break out of the upper Bollinger Bands
The Pinbar reversal candle appeared and closed below the upper
Stop loss: Nearest peak + 3-5 pips
Profit target: 10-20 pips
* If you have any questions or suggestions for this strategy, feel free to ask us.
Bollinger Band Reversal StudyThis strategy was inspired by ParallaxFX.
This strategy attempts to predict when a price reversal will happen. It uses bollinger bands, stochastics and candle formations.
The idea is that when an indecision candle, such as a doji, crosses outside the bollinger bands, then is followed by another candle that pushed sharply back inside the bands, you have a setup.
These setups are marked with green arrows to go long and red arrows to go short. Wait until the next candle begins before acting. The arrow may come and go as the price fluctuates, so wait until the candle closes.
Another play is when the same setup occurs, but on the middle bollinger band instead of the outer band.
These setups are marked with blue arrows to go long and yellow arrows to go short. Wait until the next candle begins before acting. The arrow may come and go as the price fluctuates, so wait until the candle closes.
Closing can happen a number of ways. You can use a predetermined risk-reward or look to sell when the price reaches another band.
In summary.
Go long when a green or blue arrow appears.
Go Short when a red or yellow arrow appears.
Green arrows show signs of reversal from lower BB.
Blue arrows show signs of reversal from middle BB.
Red arrows show signs of reversal from upper BB.
Yellow arrows show signs of reversal from middle BB.
Wait for candle with arrow to close before taking trade.

Median Absolute Deviation Filtered SMA & BBMedian Absolute Deviation (MAD) is a robust measurement of variability and more resilient against outliers and small samples.
This experiment uses MAD as a means of filtering outliers from an SMA calculation. First we construct the equivalent of a Bollinger Band, but based on the median as the basis and a multiple( k ) of MAD as the outlier cutoff.
k can be set a number of ways. As a simple multiple (3 - very conservative / 2.5 - moderately conservative / 2 - poorly conservative). Alternatively MAD can be used as an estimator of standard deviation by using a multiple of 1.4826 (SD1 - 1.4826 / SD2 - 2.9652 / SD3 - 4.4478).
Once we have a cutoff range an SMA is calculated with the outliers filtered out. Additionally a Bollinger band can be output using the filtered SMA as the basis and a multiple of the MAD instead of SD for the bands.

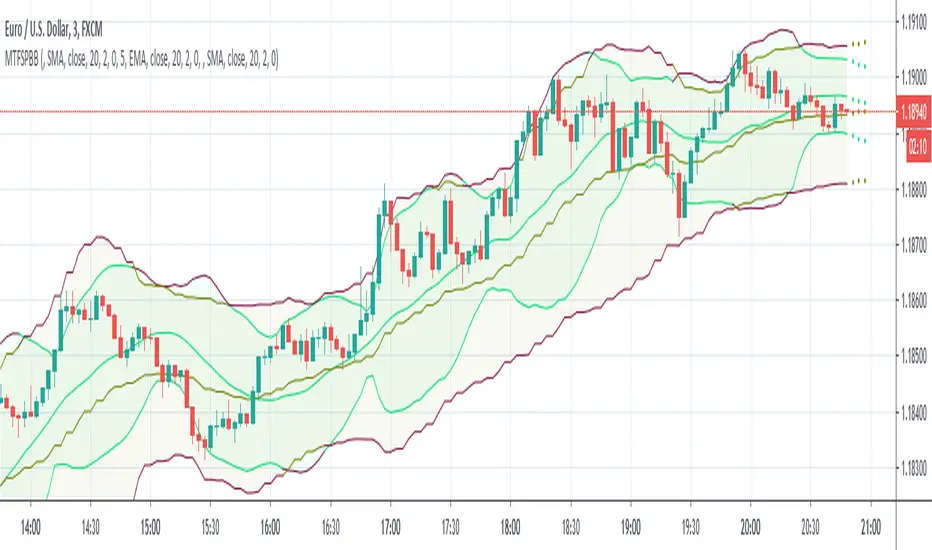
MultiTimeFrame Shifting Predictive Bollinger BandsThis is the optimized version of my MTFSBB indicator with capability of possible bands prediction in case of negative shifting (to the left).
Make me happy by using it and sending me your ideas about the prediction.