Bitmex

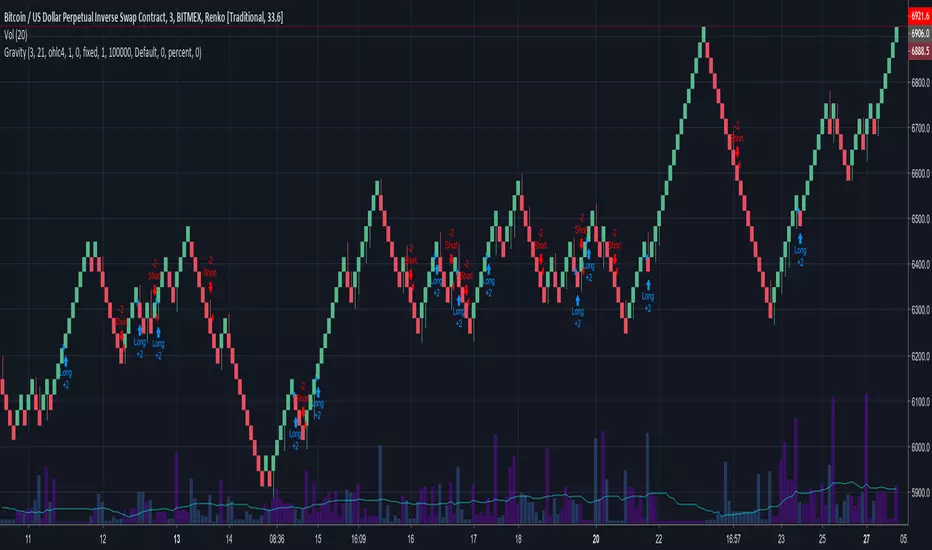
GravityBuys and sells make relative ripples in the market that can be leaned into for the trader's advantage. In order to get the most out of these ripples we need to consider space (price) as much as time. Renko charts with traditional box sizes (representing about a 0.4% move) can help us to achieve this.
This strategy is a drop in the cosmic bucket compared to what's out there, but it can help anyone who's lost money between January and now.
For traders who are looking for more of an edge, visit here:
Enjoy!
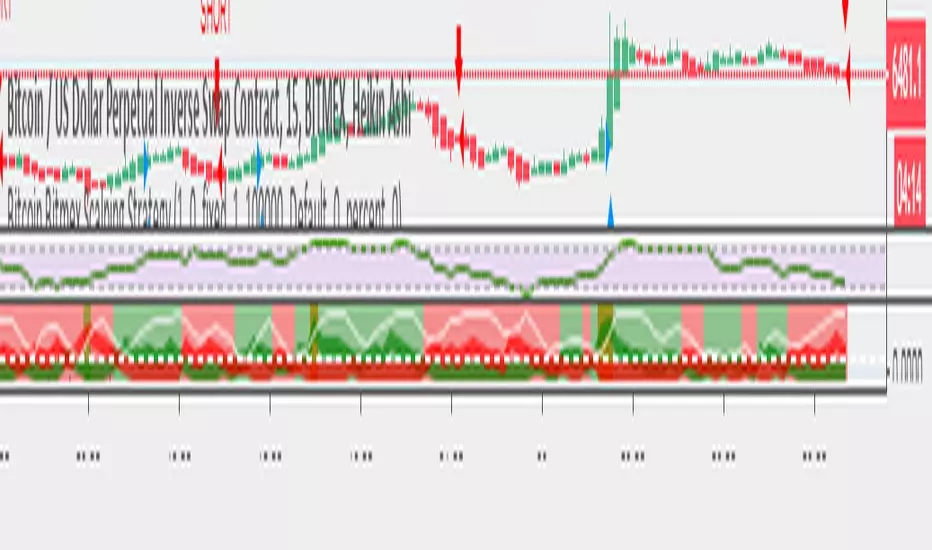
Heikin Ashi Margin Scalping script for BitmexA script made for a lot of trades (scalping) and good solid profits on the Tested and it generates very attractive profits. Test it for yourself.
- Made for BITCOIN / US DOLLAR PERPETUAL INVERSE SWAP CONTRACT XBTUSD on Bitmex.
- Only 40% of these trades are profitable, but within this 40 percent, it catches all the spikes and lows. And therefore a lot more profit then loss. The most loss is generated at the moment BTC is falling still and there is not a lot of volatility.
- I use it to create alerts and sent these to my bot, so i don't have to do manual trading.
You can ask for access and try this strategy for yourself for 5 days. When you are convinced and want to have the script with alerts to be shared with you, I ask for a small donation of 0.02 BTC. This allows me to create other scripts and to improve this script.
I only sell this script to 50 people, so that it remains exclusive.

Amlame Amlame is a EMA based indicator for BUY/SELL 1D signals.
Features
Designed for BTC/XBT signals
Optimized for 1D timeframe
Backtested (>90% profitable)
No adjustments required
Trial
Please contact me for 5 days trial period.
Access
0.01 Ƀ for lifetime access and updates.
Happy Trading.
This is not financial advice.

Bitcoin Bitmex Scalping StrategyIf you are not greedy and just want 20-30 points gain then this strategy can give more then 90% accurate calls. Once you enter the trade place your sell order 20-30 points above/below your order or use trailing stop loss.
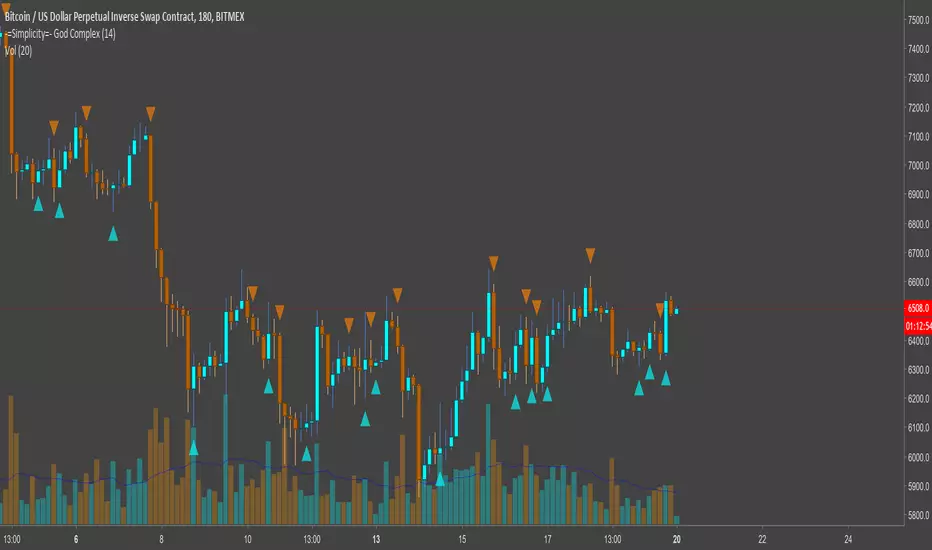
-=Simplicity=- God ComplexMaking money is simple when you wield untold power
-=Simplicity=- God Complex is a non-repaint, set-and-forget indicator for identifying optimum times to enter and exit the market, with both longs and shorts.
Applicable to any asset-type, market, candle type and timeframe, God Complex is a quintessential tool for both new and veteran traders.
With only one variable to change it will take a minimal amount of time to find a value that suits you. As a rule of thumb, the higher the value the less it will fire signals, but the safer those signals will be.
You can also opt to only enable 'Long' or 'Short' signals on the chart. This is meaningful when trading leverage or margin along trend that you are able to identify.
This can be used as a guide for manual trading, but is best utilized as a tool for automating trades so that you don't miss out on any market activity.
This is a link to a document elucidating a little more on the script: docs.google.com
---------------------
Here are a few charts showing how the script performs against them. Enjoy.
Below is a chart depicting XBTUSD (BitMEX) on a 30M timeframe. Both longs and shorts are enabled and the variable is set to a value of 144.
Below here we have a chart for BNBBTC (Binance) on a 1HR timeframe with variable set to a value of 14 on Heikin Ashi candles. Large orange arrows are shorts and smaller blue arrows are closing shorts. There's a clear downtrend, hence we're only shorting.
This is EOSBTC (Bitfinex) on a 2HR timeframe with a variable set to 7 on Renko charts. Small orange arrows are exiting a long position and large blue arrows are entering a long position. The uptrend is obvious to see, so that's why we're mainly displaying longs here.
Not that I reccommend anyone to trade such a small timeframe, but this is for all you scalpers out there. XBTUSD (BitMEX) on a 1M timeframe with a variable value of 233. Both longs and shorts are enabled for this chart. Normal bar candles apply.
Finally, this is ARKBTC (BitTrex) on a 2HR timeframe against a 500R chart with a variable of 377. Only shorts are enabled, as we're in a downtrend.
---------------------
Please contact @overttherainbow on Telegram if you'd like to discuss anything, alternatively reach out to me here (although Telegram is better for a quick response; I'll be around 9AM-11PM GMT)
LazyTrader 1DDon't want to trade every day? This one is for you!
Trade the big swings on the BTCUSD market with ease.


BTC Avarage Volume Indicator 2This indicator shows that volume and candle color of "BTC" pairs on one of the top 4 "BTC" exchanges.
You can easily see the volumes and candle color for "BTC" trading.
* Currently, this indicator can be used by selected people in order to complete private beta test.
* Once testing is completed, this indicator can be purchased.
* If you'd like to use this, please "DM" me and I will provide PayPal information.
About Inputs
* Default Ticker IDs are set as "BITMEX:XBT", "BITFINEX:BTCUSD", "BITFLYER:BTCJPY" and "BINANCE:BTCUSDT".
* Ticker ID can be changed.
* Ticker Label Color can be changed.
* Scale Value Of Sum Of Other Volume can be changed. See the following Important Notice.
* Ticker Label Color can be changed depending on theme color.
* Show/Hide warning(Show=0, Hide=100) can be changed. See the following Important Notice.
* Interval (Timeframe) can be changed depending on timeframe of current chart.
Specification
* barmerge is set as barmerge.gaps_off and barmerge.lookahead_off for every calculation.
Important Notice
* Volume of some exchange is over 100x times compared to other volumes. In this case, value of column chars is manipulated since other column chars come to be invisible and warning will be displayed on the right side of last chart.
* Manipulated column charts is calculated as sum of other volumes by scale which can be changed from "Scale Value Of Sum Of Other Volume" on Inputs

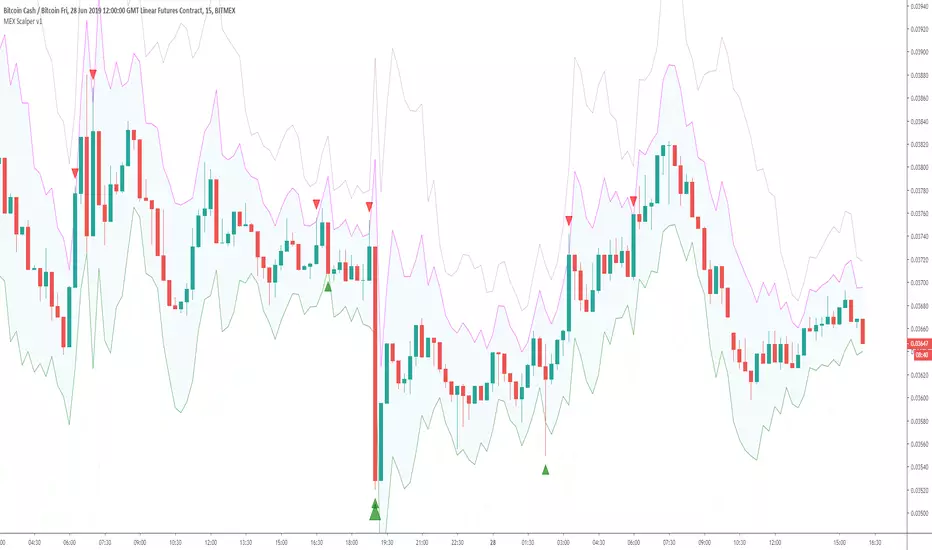
BitMEX Profit Scalper v1I keep getting asked to create a script for Scalping on BitMEX so here is the initial version!
Default settings created for XBTUSD 15m and designed for getting decent profits when using around a 10x margin.
Settings can be tweaked so you can alter this for any time frame
ACCESS For CryptoProTools.com members only!! (Visit our website if you wish to sign up)
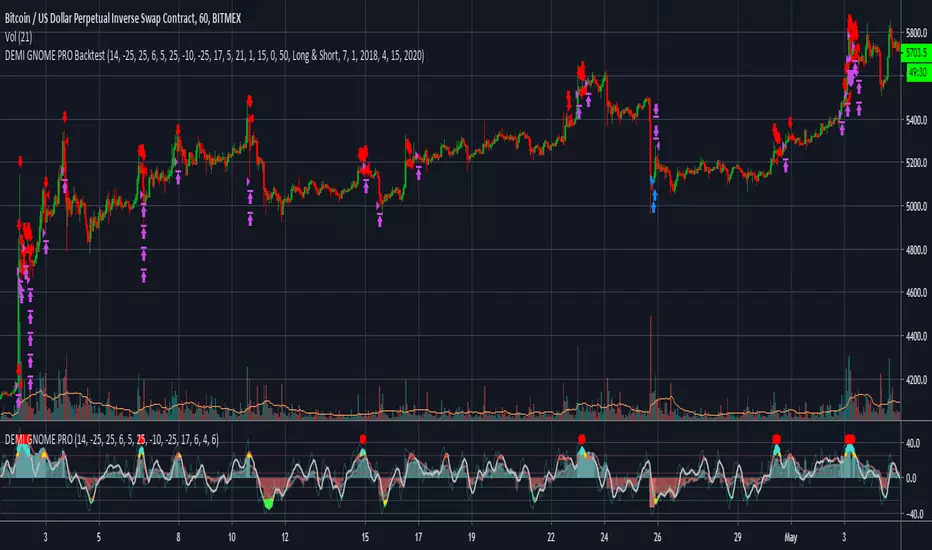
DEMI GNOME PRO BacktestHello Fellow Traders!
-------------------------------------------
This is the newest addition to Gnome Alerts PRO
This is one of the newer scripts that we are using for scalping on the lower time frames on Bitmex & Binance.
This is a transformed version of GODMODE that adapts to market swings.
INCLUDES:
------------------------
*Autoview Ready*
BUY ALERTS
- multiple long positions
SELL ALERTS
- sell with oversold alerts
- sell based of %gain
Short Alerts For Bitmex
Backtesting is also available!
More info on how gain access in my profile!

DEMI GNOME PROHello Fellow Traders!
-------------------------------------------
This is the newest addition to Gnome Alerts PRO
This is one of the newer scripts that we are using for scalping on the lower time frames on Bitmex & Binance.
This is a transformed version of GODMODE that adapts to market swings.
INCLUDES:
------------------------
*Autoview Ready*
BUY ALERTS
- multiple long positions
SELL ALERTS
- sell with oversold alerts
- sell based of %gain
Short Alerts For Bitmex
Backtesting is also available!
More info on how gain access in my profile!
Market Sniper Signal MTF [ALERTS]Script with alert condition to use with Market Sniper Strategy.
Can be used to trade manually or automatically using API/AutoView Extension.
Market Sniper is a multi-timeframe strategy based on trend analysis created to operate on leverage market.
Code is still in beta-testing, please leave a comment if you want a free trial when final release will be available.


Miscbot 5.0 - StrategyA general strategy for BitMEX that uses a combination of indicators and filters to determine long and short zones.
Tested and coded for 20m. Use at your own risk. I take no responsibility for lost currency.
BitMex referral - 10% off fees: : www.bitmex.com
I have also converted the strategy to a bot that can be used with autoview to make the trades for you.
-Pinescript v3
-Heikin Ashi candles
-20m
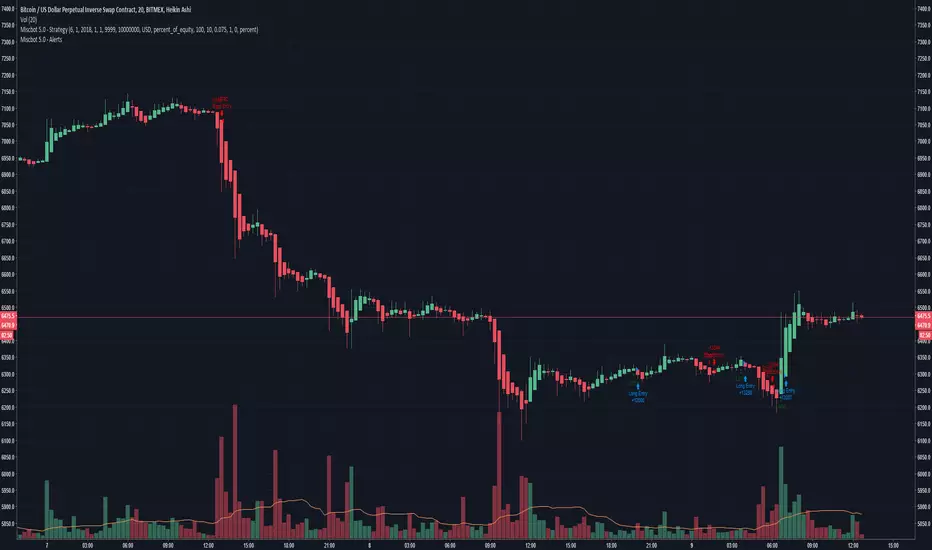
Miscbot 5.0 - AlertsAn automated strategy utilizing Autoview and Bitmex on the 20m.
Use at your own risk. I take no responsibility lost currency using this.
-Pinescript v3.0
-Heikin Ashi candles
-20m
Bitmex referral - 10% off fees: www.bitmex.com

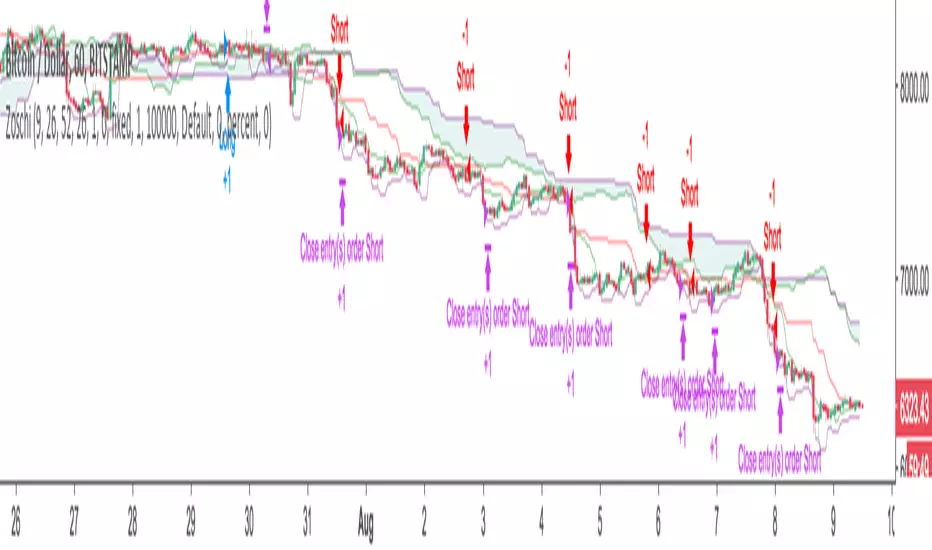
Zos Ichimoku Trading SystemFully automated Ichimoku Cloud based trading system. Automated entry and exits.
Message me on Telegram for access. @zacharyo
(c) Bronte Capital
BitMEX ETHUSD Perpetual Quanto Swap Predictive FundingThis script shows actual and predicted funding levels for the BitMEX ETHUSD perpetual swap.
It gives exact results when using 1 minute candles, or after leaving any timescale chart open for several hours to collect the new data points. In all other situations it lacks fine precision.

BitMEX Volatility AlertsAlert conditions and bar colors for each of the three volatility indices from BitMEX.
Price: 0.002 BTC / 35 Ripples / 1 NEO

Bitmex margin PRO [PlungerMen]Hello!
this is Update of Bitmex Scalping PRO , mix 2 indicaror in it for exactly Signal
Bitmex margin PRO can use for every coin
Bitmex margin PRO is available for all frames
This Script is perfectly functional and works well by me and the best way to use this script is to use it with “Bitmex Long Short" script, both compliment for each other. the "Bitmex Long Short" script is Free, you can find it by searching “Bimex”
If you want to be more accurate and more efficient, more comfortable when you do not want to see too many other indicators, you can register for our Professional edition.
- The Professional Edition supports Level 1 and Level 2 commands ( display at chart : LONG+, long-, SHORT,+,short- ), which are very effective in allocating funds and optimizing your profits
Besides that,You will be supported by personal preferences, profit maximization
- Register for a Professional version will be used 2 Script, Bitcoin -1.30% -3.21% -3.33% -3.27% Scalping Pro and Bitmex Long Short Pro
- We will invite you to the signal channel Telgram with the announcement of the bottom and the peak of the BTC -1.30% -3.21% -3.33% -3.27% 0.60% -0.13% ,the big variable variable has exists
**We hope you enjoy this script. Your support will help us develop more good quality scripts in the future to serve the community **
**Remember, Like this script and posivite feedback if you are satisfied**
if you have any questions, post a comment ... below here
*********** Guide:
+ option for all frames : Click setting and input high and low for time inteval
+ hide wave trend : Click setting -> click Style --> Up trend Fill or Down trend fill
******
New features: this time we add two lines that can help traders trader safer. When the red line cross above the green line means we are in the downtrend and when the green line cross above the red line, which means we are in a uptrend. This new features will help traders do a safer trade at small time frame.
We have the Script free for the user pass, search keyword " Bitmex Scalping PlungerMen"
-->> 0.2 eth/1 month will be used Script: Bitmex margin PRO an Super Bot alert telegram <--

Neo BitMEX Futures Hedge Grid Alerts Premium v1.0This indicator was made to streamline finding the optimal entry to cash and carry/hedge on a futures contract when margin trading.
Explanation of the indicator:
This indicator has built-in alert conditions that you can use to give you email alerts, in-browser sound alerts, or SMS alerts. These alerts are based upon futures prices being in contango or backwardation.
From top to bottom, the grid shows XBTU18, XBTZ18, OkEx's Quarterlies (OKCOIN:BTCUSD3M), and CME's futures.
Red: Futures are trading above your defined range (default 1%) of spot
Maroon: Futures are trading above twice your defined range of spot
Lime: Futures are trading below your defined range (default 1%) of spot
Green: Futures are trading below twice your defined range of spot
What's configurable:
% to trigger
Grid size
Bar color toggle
Label toggle
Spot/index source (Bitfinex's BTCUSD, BitMEX's XBTUSD, and BitMEX's XBT Index are available)
Pricing:
Currently this standalone indicator is 0.007 BTC for lifetime use.
Example of use:
On 4 May 2018, BitMEX's XBTU18 was trading >2% above perpetual swap. The grid alerts signaled that and if one were long on bitcoin spot on any exchange, then it would have been a good idea to hedge a short on XBTU18. Eventually from there the premium gap was closed while bitcoin fell.
Here is the indicator shown with bar coloring and labels.

Crypto Spiper Killer Pro [PlungerMen]Hello!
Crypto Spiper Killer Pro is a upgrade version of a Crypto Spiper Killer
Crypto Spiper Killer Pro can use for every coin
Crypto Spiper Killer Pro is available for all frames
This Script is perfectly functional and works well by me and the best way to use this script is to use it with “Bitmex Long Short" script, both compliment for each other. the "Bitmex Long Short" script is Free, you can find it by searching “Bimex”
If you want to be more accurate and more efficient, more comfortable when you do not want to see too many other indicators, you can register for our Professional edition.
- The Professional Edition supports Level 1 and Level 2 commands ( display at chart : LONG+, long-, SHORT,+,short- ), which are very effective in allocating funds and optimizing your profits
Besides that,You will be supported by personal preferences, profit maximization
- Register for a Professional version will be used 2 Script, Bitcoin -0.95% -3.33% -3.27% Scalping Pro and Bitmex Long Short Pro
- We will invite you to the signal channel Telgram with the announcement of the bottom and the peak of the BTC -0.95% -3.33% -3.27% 0.60% -0.13% ,the big variable variable has exists
**We hope you enjoy this script. Your support will help us develop more good quality scripts in the future to serve the community **
**Remember, Like this script and posivite feedback if you are satisfied**
if you have any questions, post a comment ... below here
*********** Guide:
+ option for all frames : Click setting and input high and low for time inteval
+ hide wave trend : Click setting -> click Style --> Up trend Fill or Down trend fill
******
New features: this time we add two lines that can help traders trader safer. When the red line cross above the green line means we are in the downtrend and when the green line cross above the red line, which means we are in a uptrend. This new features will help traders do a safer trade at small time frame.
We have the Script free for the user pass, search keyword " Crypto Spiper Killer Pro "
-->> 0.2 eth/1 month will be used 2 Script: Crypto Spiper Killer Pro and Bitmex Long Short Pro - and Super Bot telegram
