Williy CRIThis idea I got from rationalinvestor.com . SELL when you see overbought with MACD confirming bearish divergences and buywhen you see oversold with MACD confirming bullish divergences.
Bill Williams-Indikatoren

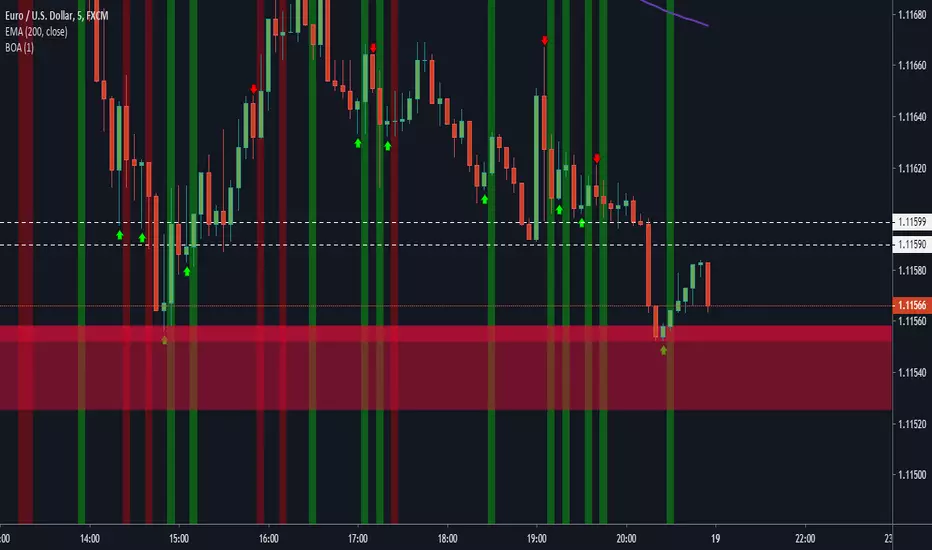
Sinyal GhoibLeading Signal!!!
Long entry while long signal appears.
Short entry while short signal appears.
This signal only effective on BitMex | 5m | XBTUSD.
Take profit: 0,6% from entry price
Stop loss: 0,6% from entry price
Leverage: 10x - 50x
For donation
BTC: 3E7rUPX7upS8iTj42JdLt7keJVbJLfvMoH
ETH: 0x094ed88e4c5a9b225e936586cbc2d61f4a027f68
BitMex Referral: P81ZCO
Thank you & happy trading!

MOMEMTUM READER ULTIMATEMomemtum Reader is the complement of Market Reader it will help you to find market Top and Bottom.
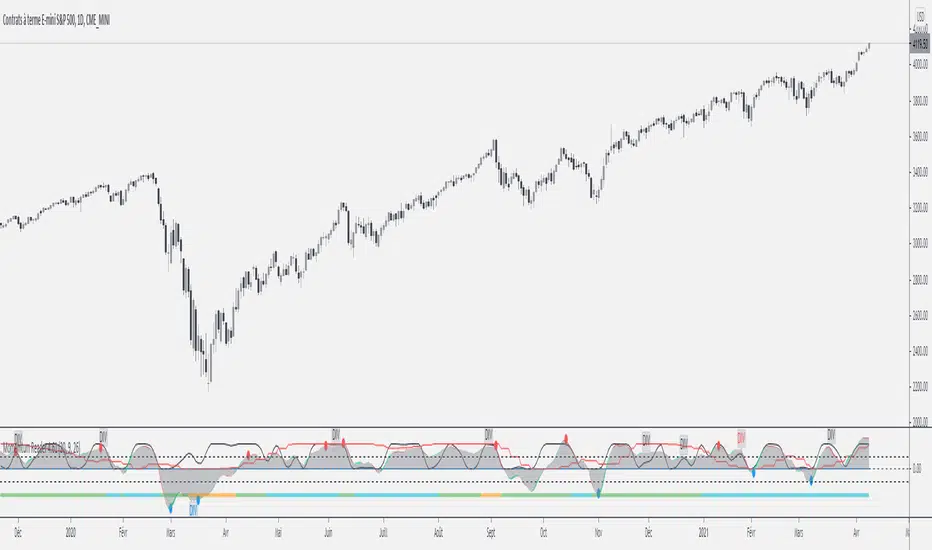


Assassin Zenzen about top fractal and bottom fractal
show top fractal and bottom fractal
---
TODO
Contain Kline , Tradingview pine not support yet.


Advanced Awesome OscillatorAwesome oscilator with more options.
You can choose the source, moving averages' period lengths.
MACD histogram style with color change:
Dark green when value goes up above zero.
Light green when value goes down above zero.
Red when value goes down below zero.
Orange when value goes up below zero.


FK-MagicFK-Magic Indicator for Short term trades and best for scalping
if you need nay help about it just DM me....

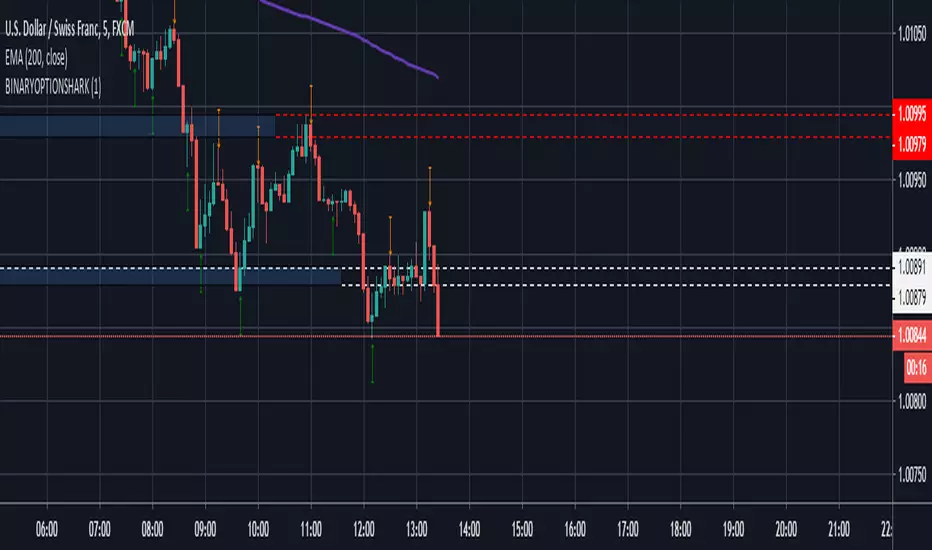
Support/Resistance x3Support and Resistance Levels for 3 time frames, based on volume at fractal levels
Original script is thanks to synapticex I have just migrated to version 3 and heavily modified it


CrayonsCrayons Grayons
Derived from -
Its messy and experimental until stable version is released , now for testing purposes only
[AU] Fibonacci Fractal Regression ChannelFibonacci Fractal Regression Channel v01
Based upon:
Fractal Regression Channel V0 () by @RicardoSantos
Note: For use on 4H charts and lower intervals/timeframes
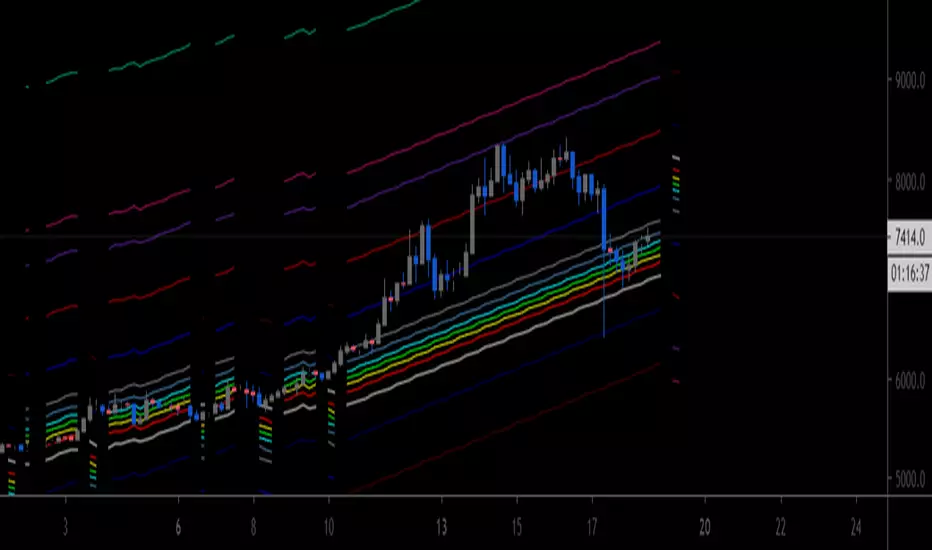
Fractal Regression Channel V0.1Port of @RicardoSantos' Fractal Regression Channel V0 from pinescript 2 to pinescript 3.
// Source:
// Original Author: @RicardoSantos
