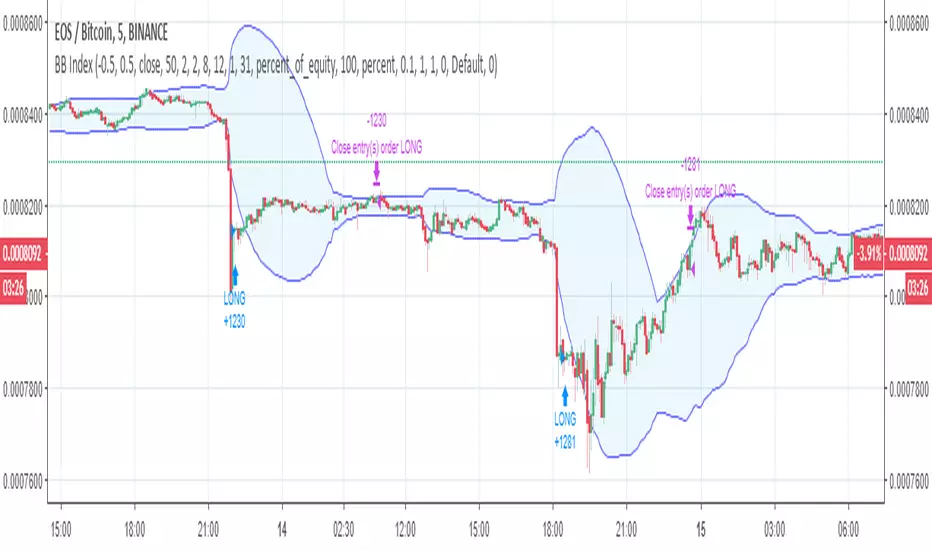
Band Index StrategyI like using BB , but generally it generate more signals than I need. I restricted its signals with my trend index indicator and Stoch RSI
You can look at my other scripts.
www.tradingview.com
If you want to ask something, you can message me.
BB
4EMA (8,13,21,55) + DC (100,200) + BB + S&R by @PIXELSNAPSHOTIn this indicator you find Total 6 EMA , 4 slow and same as fibonashi & another 2 is long term + you get death cross + you get Bollenger band + you get support & resistance indicator

LeoA451: BBW Double Confirmation v.03 (Signal BBW=black(5/5))This script displays BBW from two periods: a signal period (for which I like to use 5 minutes) and the current period of selected time frame.
- Black BBW - BBW for signal period (5 min/ 5 length/ std_dev 2)
- Blue BBW - for current period (current/ 20 length/ std_dev 2)
You can customise periods and length in the settings option.
Enjoy!
Leave any comments and/or press like button (if you do).

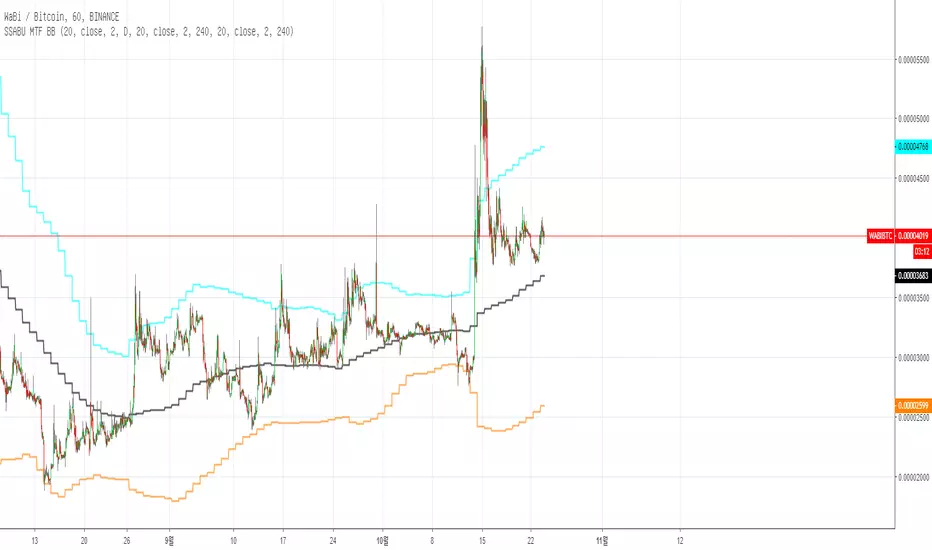
SSABU MTF BB
✅ MTF BB (Multi-Time Frame Bollinger Band) Indicator.
This indicator is a supplementary indicator for viewing the BB value of the high frame splitting in the low frame splitting.
If you set the indicator instead of entering the time directly, you can set 1/3/5/13/30/45 minutes 1/2/3 / hour for 1 week from BB1 MTF Set (Minute).
The default setting is 4H and the number of BB is 3.
The above screenshot shows a BB with a one-hour stick in the chart of 1 hour's bar.
✅ MTF BB (멀티 타임 프레임 볼린저 밴드) 지표입니다.
본 지표는 낮은 프레임의 분봉에서 높은 프레임의 분봉의 BB수치를 볼 수 있는 보조지표 입니다.
직접 시간을 입력 하는 건 아니고 지표를 설치하시면 BB1 MTF Set(Minute)에서 1/3/5/13/30/45분 1/2/3/시간 1일 1주로 설정이 가능합니다.
기본설정은 4H으로 되어있고 BB갯수는 3개로 구성되어 있습니다.
위의 스크린샷은 1시간봉의 차트에서 일봉의 BB를 적용한 모습입니다.
✅ Other indicators to help you trade
✅ 매매에 도움되는 다른 보조지표
Basel major swing ver 2.2
Librehash MV BandThis indicator does not need much of a description, although its utility is very obvious from first glance.
What this indicator is, is essentially a recreation of the Bollinger Bands (w a diff standard deviation calculation for the band formation) that also comes integrated with its own buy and sell signal as well.
This is one of the more valuable indicators out there for any and all traders that are looking to perform a Bollinger's like analysis in a more helpful, compact, and informative manner.
If you are looking to access this indicator, please shoot me a private message on here. This is an invite-only script, so there is a cost associated with the use of this indicator. Price and payment information will be relayed through our chat conversation.
Again, please reach out to me directly through a private message (not via comment to this post) if you have any questions about accessing this indicator.
Thank you.
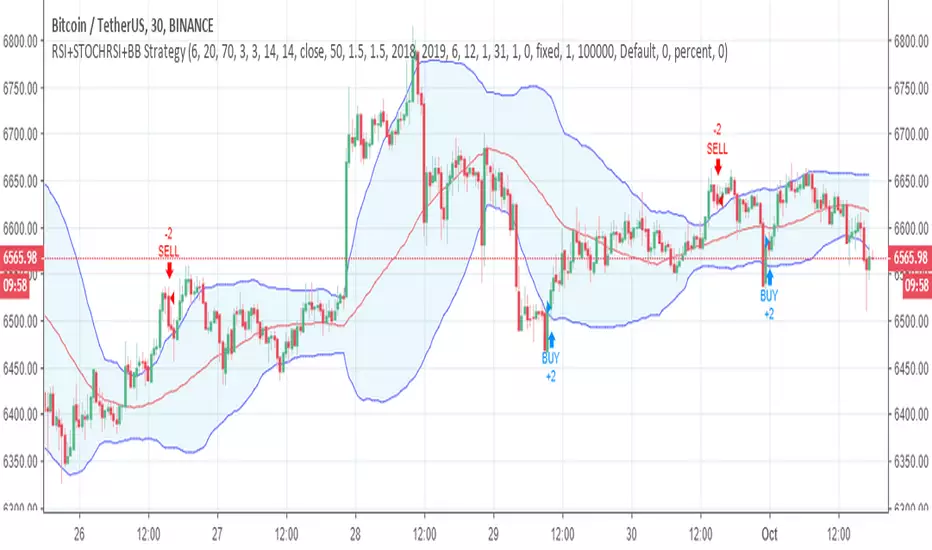
BB+STOCH RSI v2Developed for one of my followers.
The basic idea is that the buy signal is generated by stoch and bb.
However, If price hits the upper line or trend return crossing under midline, the strategy closes the position.

DPD+RSI+BB Combination of DPD ,STOCHRSI and RSI indicators. Be careful for percantage selection to fit your candle size.

Silk Indicator (H4 & D1) : VWMA Flow vs EMA // BB vs Dev. St.RSIPictured as a Momentum Indicator, it shines best on the H4 and the D1.
A combination of VWMA, EMA's, BB, Stochastic RSI, the Kijun (Doubled Ichimoku Cloud), William's Fractals ('.') and too many Standard Deviations.
Simple Strategy:
Center Blue: Long
Center Red: Short
The center of the BB can help understand the market's momentum and its strength.
Please be advised, this indicator will only be free for a limited time.

Gunbot Deluxe Tuners BE [Alerts]Revision 18
Gunbot Deluxe Tuners BE Alerts is part of the official Gunthy version of Gunbot Deluxe Tuners.
It is the companion Alerts script for the Gunbot Deluxe Tuners BE (Black Edition) backtesting and optimizing script.
This Alerts script allows user to automatically send alerts directly to Gunbot through the Gunbot TradingView addon.
Available only to verified Gunbot owners. No exceptions. Anyone interested in obtaining this script must contact either their official Gunbot reseller or me privately.
No public requests or donations for access to this script will be granted. No exceptions.
NOTICE: By requesting access to this script you acknowledge that you have read and understood that this is for research purposes only and neither I or Gunthy are responsible for any financial losses you may incur by using this script!

Gunbot Deluxe Tuners BERevision 18
Gunbot Deluxe Tuners BE (Black Edition) is the official Gunthy version of Gunbot Deluxe Tuners.
It is an all in one script simulation of Gunbot with the ability to optimize Gunbot settings through backtesting any combination of the script's included buy / sell strategies along with extra conditions and trailing options.
The companion script allows user to automatically send alerts directly to Gunbot through the Gunbot TradingView add-on.
Available only to verified Gunbot owners. No exceptions. Anyone interested in obtaining this script must contact either their official Gunbot reseller or me privately.
No public requests or donations for access to this script will be granted. No exceptions.
NOTICE: By requesting access to this script you acknowledge that you have read and understood that this is for research purposes only and neither I or Gunthy are responsible for any financial losses you may incur by using this script!
Multi SMA EMA WMA HMA BB (4x3 MAs Bollinger Bands) Pro MTF - RRBMulti SMA EMA WMA HMA 4x3 Moving Averages with Bollinger Bands Pro MTF by RagingRocketBull 2018
Version 1.0
This indicator shows multiple MAs of any type SMA EMA WMA HMA etc with BB and MTF support, can show MAs as dynamically moving levels.
There are 4 MA groups + 1 BB group. You can assign any type/timeframe combo to a group, for example:
- EMAs 50,100,200 x H1, H4, D1, W1 (4 TFs x 3 MAs x 1 type)
- EMAs 8,13,21,55,100,200 x M15, H1 (2 TFs x 6 MAs x 1 type)
- D1 EMAs and SMAs 12,26,50,100,200,400 (1 TF x 6 MAs x 2 types)
- H1 WMAs 7,77,231; H4 HMAs 50,100,200; D1 EMAs 144,169,233; W1 SMAs 50,100,200 (4 TFs x 3 MAs x 4 types)
- +1 extra MA type/timeframe for BB
compile time: 25-30 sec
full redraw time after parameter change in UI: 3 sec
There are several versions: Simple, MTF, Pro MTF, Advanced MTF and Ultimate MTF. This is the Pro MTF version. The Differences are listed below. All versions have BB
- Simple: you have 2 groups of MAs that can be assigned any type (5+5)
- MTF: +2 custom Timeframes for each group (2x5 MTF)
- Pro MTF: +4 custom Timeframes for each group (4x3 MTF), MA levels and show max bars back options
- Advanced MTF: +2 extra MAs/group (4x5 MTF), custom Ticker/Symbol, backreferences for type, TF and MA lengths in UI
- Ultimate MTF: +individual settings for each MA, custom Ticker/Symbols
Features:
- 4x3 = 12 MAs of any type including Hull Moving Average (HMA)
- 4x MTF groups with step line smoothing
- BB +1 extra TF/type for BB MAs
- 12 MA levels with adjustable group offsets, indents and shift
- show max bars back
- you can show/hide both groups of MAs/levels and individual MAs
Notes:
1. based on 3EmaBB, uses plot*, barssince and security functions
2. you can't set certain constants from input due to Pinescript limitations - change the code as needed, recompile and use as a private version
3. Levels = trackprice implementation
4. Show Max Bars Back = show_last implementation
5. uses timeframe textbox instead of input resolution to allow for 120 240 and other custom TFs. Also supports TFs in hours: 2H or H2
6. swma has a fixed length = 4, alma and linreg have additional offset and smoothing params
7. Smoothing is applied by default for visual aesthetics on MTF. To use exact ma mtf values (lines with stair stepping) - disable it
MTF Notes:
- uses simple timeframe textbox instead of input resolution dropdown to allow for 120, 240 and other custom TFs, also supports timeframes in H: 2H, H2
- Groups that are not assigned a Custom TF will use Current Timeframe (0).
- MTF will work for any MA type assigned to the group
- MTF works both ways: you can display a higher TF MA/BB on a lower TF or a lower TF MA/BB on a higher TF.
- MTF MA values are normally aligned at the boundary of their native timeframe. This produces stair stepping when a higher TF MA is viewed on a lower TF.
Therefore X Y Point Density/Smoothing is applied by default on MA MTF for visual aesthetics. Set both to 0 to disable and see exact ma mtf values (lines with stair stepping and original mtf alignment).
- Smoothing is disabled for BB MTF bands because fill doesn't work with smoothed MAs after duplicate values are replaced with na.
- MTF MA Value fluctuation is possible on the current bar due to default security lookahead
Smoothing:
- X,Y == 0 - X,Y smoothing disabled (stair stepping on high TFs)
- X == 0, Y > 0 - X,Y smoothing applied to all TFs
- Y == 0, X > 0 - X smoothing applied to all TFs < deltaX_max_tf, Y smoothing disabled
- X > 0, Y > 0 - Y smoothing applied to all TFs, then X smoothing applied to all TFs < deltaX_max_tf
X Smoothing with Y == 0 - shows only every deltaX-th point starting from the first bar.
X Smoothing with Y > 0 - shows only every deltaX-th point starting from the last shown Y point, essentially filling huge gaps remaining after Y Smoothing with points and preserving the curve's general shape
X Smoothing on high TFs with already scarce points produces weird curve shapes, it works best only on high density lower TFs
Y Smoothing reduces points on all TFs, removes adjacent points with prices within deltaY, while preserving the smaller curve details.
A combination of X,Y produces the most accurate smoothing. Higher delta value - larger range, more points removed.
Show Max Bars Back:
- can't set plot show_last from input -> implemented using a timenow based range check
- you can't delete/modify history once plotted, so essentially it just sets a start point for plotting (from num_bars bars back) that works only in realtime mode (not in replay)
Levels:
You can plot current MA value using plot trackprice=true or by checking Show Price Line in Style. Problem is:
- you can only change color (not the dashed line style, width), have both ma + price line (not just the line), and it's full screen wide
- you can't set plot trackprice from input => implemented using plotshape/plotchar with fixed text labels serving as levels
- there's no other way of creating a dynamic level: hline, plot, offset - nothing else works.
- you can't plot a text var - all text strings must be constants, so you can't change the style, width and text labels without recompiling.
- from input you can only adjust offset, indent and shift for each level group, and change color
- the dot below each level line is the exact MA value. If you want just the line swap plotshape with plotchar, recompile and save as your private version, adjust Y shift.
To speed up redraw times: reduce last_bars to ~2000, recompile and use as your own private version
Pinescript is a rudimentary language (should be called Painscript instead) that can basically only plot data. You can't do much else. Please see the code for tips and hints.
Certain things just can't be done or require shady workarounds and weeks of testing trying to resolve weird node.js compiler errors.
Feel free to learn from/reuse/change the code as needed and use as your own private version. See comments in code. Good Luck!

BB Quick Fire5 Bollinger Bands in levels 50,2.0 | 50,2.5 |50,3.0 |50,3.5 |50,4.0
This is used to identify pullbakcs and future pitchfork's.

RSI or MFI %BPlot where RSI or MFI is in its Bollinger Bands . Can be used in many different way: as a trend indicator (above below 0.5), part of a trend following strategy when crossing above 0 (resume bullish trend ) or crossing below 1 (resume bearish trend ), also useful for divergences, etc...

MFI/RSI with Volatility Bands [LazyBear (edited)]Edited version of the script by LazyBear.
Update of my previous script.
Features:
- plot both MFI and/or RSI (LazyBear only allows one of both)
- plot RSI/MFI band (over sold - mid - over bought) + indicator lines

MFI/RSI with Volatility Bands [LazyBear (edited)]Edited version of the script by LazyBear.
Update of my previous script.
Features:
- plot both MFI and/or RSI (LazyBear only allows one of both)
- plot an indicator band (over sold - mid - over bought)

BB & KCThis script is a mix of both the default Bollinger Bands and the default Keltner Channels.
It helps in identifying the squeeze of the bands and also the consolidation of the price movement.

Plum Moving AverageThis is a combination of 8 Moving Average & 1 BB for comfortable use.
이것은 조합이다. 8개 이동평균선 & 1개 볼린저밴드. 편하게 사용.

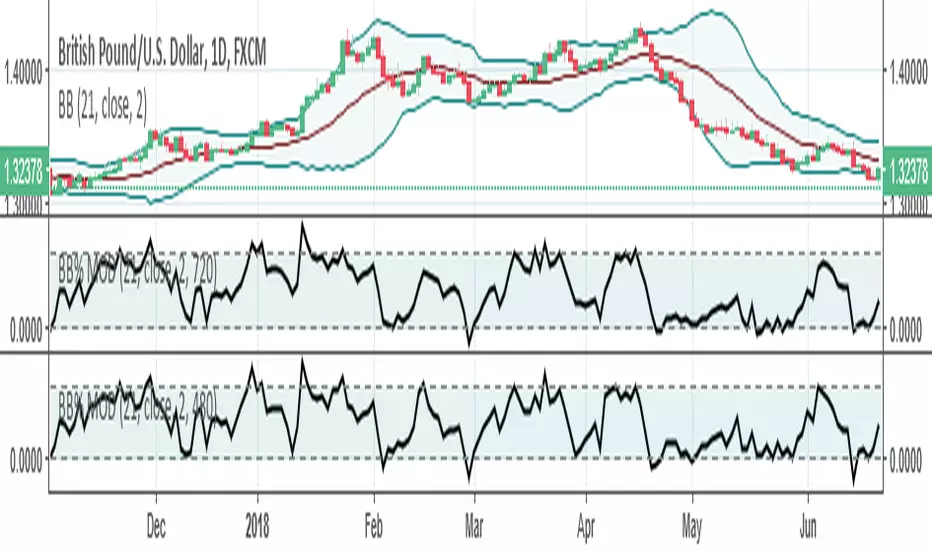
BB% MODHELLO EVERYONE !
I created this indicator to simplify my life in the study of the bollinger bands on a multi-time frame optics.
It works exactly like the bollinger bands %B you have of defaul inside tradingwiew;
BUT you can choose via an integrated button that I integrated if you see the indicator on the chart timeframe or a custom time frame, which can be changed via a window
Timeframe that you can choose from the window: 1M, 3M, 15M, 30M, 45M, 1H, 2H, 4H, 8H, 12H, D, 3D, W
For more info contact me in PM
I usually answer in 1/3 Day
BB% MODHELLO EVERYONE !
I created this indicator to simplify my life in the study of the bollinger bands on a multi-time frame optics.
It works exactly like the bollinger bands %B you have of defaul inside tradingwiew;
BUT you can choose via an integrated button that I integrated if you see the indicator on the chart timeframe or a custom time frame, which can be changed via a window
Timeframe that you can choose from the window: 1M, 3M, 15M, 30M, 45M, 1H, 2H, 4H, 8H, 12H, D, 3D, W .
For more info write me in PM.
I answer in 24/48 H

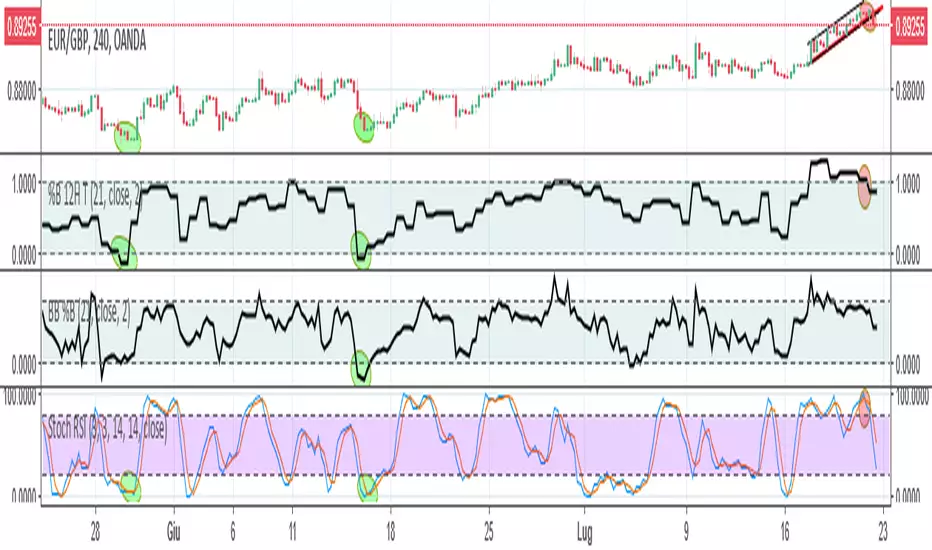
%B 12H THello everyone , I want to share with the comunity my work for look BB %B in a different timeframe without having to change it every time.
I had done to look and study different or multi timeframe a BB %B
I have programmed the script so that it is completely identical to the default one of tradingwiew to simplify its use at all.
I hope this work can be useful to someone else who likes the concept of standard deviation at the base of the bands conceived by Bollinger, but seen as multi timeframe.
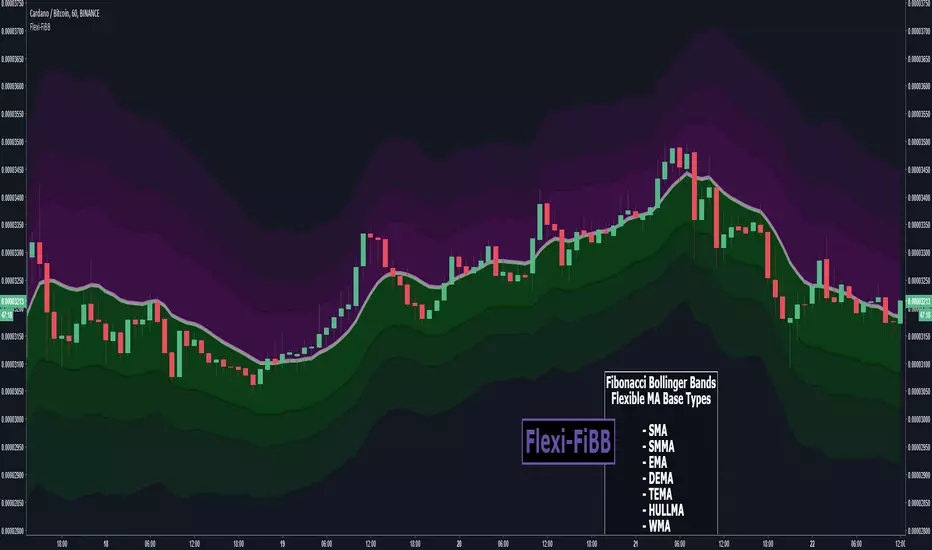
Flexi-FiBBFlexible Fibonacci Bollinger Bands
Colorful 3d Bands displaying Support and Resistance areas based off of Fibonacci Ratios in a customization Bollinger Band.
Choose from vary types of moving average types to get the perfect fit for your trade style.
MA Types Available
- SMA
- SMMA
- EMA
- DEMA
- TEMA
- HULL-MA
- WMA
- VWMA
You can purchase access to this indicator via CryptoProTools
Other recent indicators proving popular among members lately :