Awesome SuperTrend Zone Dynamic Alerts// created by © OmegaTools, upgrade to v6 and alert condition added
//@version=6
Awesome SuperTrend Zone Alerts with dynamic alerts
Bänder und Kanäle

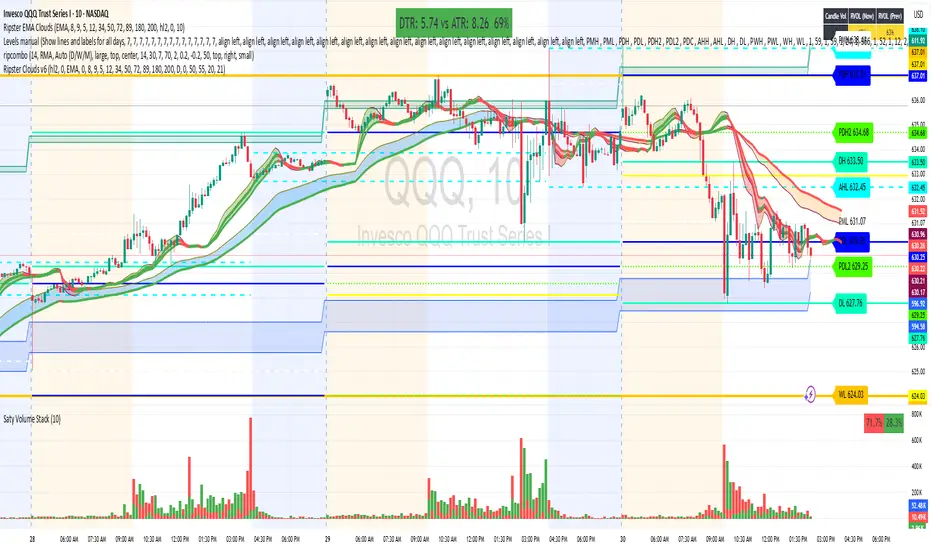
Ripster Clouds (EMA + MTF)v6🧠 Purpose
This indicator combines Ripster EMA Clouds and Multi-Timeframe (MTF) EMA Clouds into one script.
It allows you to visualize short vs long exponential (or simple) moving averages as colored “clouds” to identify trend direction and momentum — across both your current timeframe and a higher timeframe (e.g., daily).
⚙️ Main Features
1. EMA Clouds (Local Timeframe)
Up to 5 separate EMA/SMA cloud sets (8/9, 5/12, 34/50, 72/89, 180/200 by default).
Each can be individually enabled/disabled in the settings.
MA type toggle → Choose between EMA and SMA.
Optional line display toggle for showing the short and long MA lines.
Color-coded trend clouds:
Greenish tones = bullish (short > long)
Reddish tones = bearish (short < long)
Configurable leading offset and global offset for alignment.
2. MTF Clouds (Higher Timeframe)
Two sets of higher timeframe EMA clouds (default: 50/55 and 20/21).
Uses request.security() to pull EMA data from a selected higher timeframe (default = Daily).
Optional line visibility toggle (Display Lines).
Blue and teal semi-transparent fills to distinguish from local clouds.
Each MTF cloud can be toggled independently.
3. Unified Controls
Master toggles:
✅ Show EMA Clouds
✅ Show MTF Clouds
Transparent cloud fills with dynamically changing colors based on EMA crossovers and slope.
No local-scope plot() or fill() calls — fully compliant with Pine v6 rules.
🎨 Color Logic
Each EMA cloud uses a unique color pair (5 total).
Cloud color changes dynamically based on whether the short EMA is above or below the long EMA.
Line color changes with slope:
Olive = EMA rising
Maroon = EMA falling
📊 Technical Structure
Written in Pine Script v6.
All plot() and fill() calls are at global scope to prevent compilation errors.
Uses helper functions only for math/color logic.
Performance-optimized for TradingView’s rendering limits.
🧩 Quick Setup in TradingView
Paste the script into the Pine Editor.
Add to chart.
In settings:
Toggle on/off any EMA or MTF clouds.
Adjust timeframe (Resolution), line visibility, or offsets.
Choose EMA or SMA as the base calculation.
✅ Result
You now have one unified, customizable Ripster EMA + MTF Cloud indicator, stable in Pine v6, with complete flexibility to toggle, style, and analyze multiple timeframe trends on a single chart.
Cora Combined Suite v1 [JopAlgo]Cora Combined Suite v1 (CCSV1)
This is an 2 in 1 indicator (Overlay & Oscillator) the Cora Combined Suite v1 .
CCSV1 combines a price-pane Overlay for structure/trend with a compact Oscillator for timing/pressure. It’s designed to be clear, beginner-friendly, and largely automatic: you pick a profile (Scalp / Intraday / Swing), choose whether to run as Overlay or Oscillator, and CCSV1 tunes itself in the background.
What’s inside — at a glance
1) Overlay (price pane)
CoRa Wave: a smooth trend line based on a compound-ratio WMA (CRWMA).
Green when the slope rises (bull bias), Red when it falls (bear bias).
Asymmetric ATR Cloud around the CoRa Wave
Width expands more up when buyer pressure dominates and more down when seller pressure dominates.
Fill is intentionally light, so candlesticks remain readable.
Chop Guard (Range-Lock Gate)
When the cloud stays very narrow versus ATR (classic “dead water”), pullback alerts are muted to avoid noise.
Visuals don’t change—only the alerting logic goes quiet.
Typical Overlay reads
Trend: Follow the CoRa color; green favors long setups, red favors shorts.
Value: Pullbacks into/through the cloud in trend direction are higher-quality than chasing breaks far outside it.
Dominance: A visibly asymmetric cloud hints which side is funding the move (buyers vs sellers).
2) Oscillator (subpane or inline preview)
Stretch-Z (columns): how far price is from the CoRa mean (mean-reversion context), clipped to ±clip.
Near 0 = equilibrium; > +2 / < −2 = stretched/extended.
Slope-Z (line): z-score of CoRa’s slope (momentum of the trend line).
Crossing 0 upward = potential bullish impulse; downward = potential bearish impulse.
VPO (stepline): a normalized Volume-Pressure read (positive = buyers funding, negative = sellers).
Rendered as a clean stepline to emphasize state changes.
Event Bands ±2 (subpane): thin reference lines to spot extension/exhaustion zones fast.
Floor/Ceiling lines (optional): quiet boundaries so the panel doesn’t feel “bottomless.”
Inline vs Subpane
Inline (overlay): the oscillator auto-anchors and scales beneath price, so it never crushes the price scale.
Subpane (raw): move to a new pane for the classic ±clip view (with ±2 bands). Recommended for systematic use.
Why traders like it
Two in one: Structure on the chart, timing in the panel—built to complement each other.
Retail-first automation: Choose Scalp / Intraday / Swing and let CCSV1 auto-tune lengths, clips, and pressure windows.
Robust statistics: On fast, spiky markets/timeframes, it prefers outlier-resistant math automatically for steadier signals.
Optional HTF gate: You can require higher-timeframe agreement for oscillator alerts without changing visuals.
Quick start (simple playbook)
Run As
Overlay for structure: assess trend direction, where value is (the cloud), and whether chop guard is active.
Oscillator for timing: move to a subpane to see Stretch-Z, Slope-Z, VPO, and ±2 bands clearly.
Profile
Scalp (1–5m), Intraday (15–60m), or Swing (4H–1D). CCSV1 adjusts length/clip/pressure windows accordingly.
Overlay entries
Trade with CoRa color.
Prefer pullbacks into/through the cloud (trend direction).
If chop guard is active, wait; let the market “breathe” before engaging.
Oscillator timing
Look for Funded Flips: Slope-Z crossing 0 in the direction of VPO (i.e., momentum + funded pressure).
Use ±2 bands to manage risk: stretched conditions can stall or revert—better to scale or wait for a clean reset.
Optional HTF gate
Enable to green-light only those oscillator alerts that align with your chosen higher timeframe.
What each signal means (plain language)
CoRa turns green/red (Overlay): trend bias shift on your chart.
Cloud width tilts asymmetrically: one side (buyers/sellers) is dominating; extensions on that side are more likely.
Stretch-Z near 0: fair value around CoRa; pullback timing zone.
Stretch-Z > +2 / < −2: extended; watch for slowing momentum or scale decisions.
Slope-Z cross up/down: new impulse starting; combine with VPO sign to avoid unfunded crosses.
VPO positive/negative: net buying/selling pressure funding the move.
Alerts included
Overlay
Pullback Long OK
Pullback Short OK
Oscillator
Funded Flip Up / Funded Flip Down (Slope-Z crosses 0 with VPO agreement)
Pullback Long Ready / Pullback Short Ready (near equilibrium with aligned momentum and pressure)
Exhaustion Risk (Long/Short) (Stretch-Z beyond ±2 with weakening momentum or pressure)
Tip: Keep chart alerts concise and use strategy rules (TP/SL/filters) in your trade plan.
Best practices
One glance workflow
Read Overlay for direction + value.
Use Oscillator for trigger + confirmation.
Pairing
Combine with S/R or your preferred execution framework (e.g., your JopAlgo setups).
The suite is neutral: it won’t force trades; it highlights context and quality.
Markets
Works on crypto, indices, FX, and commodities.
Where real volume is available, VPO is strongest; on synthetic volume, treat VPO as a soft filter.
Timeframes
Use the Profile preset closest to your style; feel free to fine-tune later.
For multi-TF trading, enable the HTF gate on the oscillator alerts only.
Inputs you’ll actually use (the rest can stay on Auto)
Run As: Overlay or Oscillator.
Profile: Scalp / Intraday / Swing.
Oscillator Render: “Subpane (raw)” for a classic panel; “Inline (overlay)” only for a quick preview.
HTF gate (optional): require higher-timeframe Slope-Z agreement for oscillator alerts.
Everything else ships with sensible defaults and auto-logic.
Limitations & tips
Not a strategy: CCSV1 is a decision support tool; you still need your entry/exit rules and risk management.
Non-repainting design: Signals finalize on bar close; intrabar graphics can adjust during the bar (Pine standard).
Very flat sessions: If price and volume are extremely quiet, expect fewer alerts; that restraint is intentional.
Who is this for?
Beginners who want one clean overlay for structure and one simple oscillator for timing—without wrestling settings.
Intermediates seeking a coherent trend/pressure framework with HTF confirmation.
Advanced users who appreciate robust stats and clean engineering behind the visuals.
Disclaimer: Educational purposes only. Not financial advice. Trading involves risk. Use at your own discretion.

Bollinger Bands JDVRX...Bollinger Bands JDVRXBollinger Bands JDVRXBollinger Bands JDVRXBollinger Bands JDVRX

Trend scalping ROVTradingOnly trading with bullish or bearish trend. Working fine at m5 and m15 time frame

Volume Sentiment Breakout Channels [AlgoAlpha]🟠 OVERVIEW
This tool visualizes breakout zones based on volume sentiment within dynamic price channels . It identifies high-impact consolidation areas, quantifies buy/sell dominance inside those zones, and then displays real-time shifts in sentiment strength. When the market breaks above or below these sentiment-weighted channels, traders can interpret the event as a change in conviction, not just a technical breakout.
🟠 CONCEPTS
The script builds on two layers of logic:
Channel Detection : A volatility-based algorithm locates price compression areas using normalized highs and lows over a defined lookback. These “boxes” mark accumulation or distribution ranges.
Volume Sentiment Profiling : Each channel is internally divided into small bins, where volume is aggregated and signed by candle direction. This produces a granular sentiment map showing which levels are dominated by buyers or sellers.
When a breakout occurs, the script clears the previous box and forms a new one, letting traders visually track transitions between phases of control. The colored gradients and text updates continuously reflect the internal bias—green for net-buying, red for net-selling—so you can see conviction strength at a glance.
🟠 FEATURES
Volume-weighted sentiment map inside each box, with gradient color intensity proportional to participation.
Dynamic text display of current and overall sentiment within each channel.
Real-time trail lines to show active bullish/bearish trend extensions after breakout.
🟠 USAGE
Setup : Add the script to your chart and enable Strong Closes Only if you prefer cleaner breakouts. Use shorter normalization length (e.g., 50–80) for fast markets; longer (100–200) for smoother transitions.
Read Signals : Transparent boxes mark active sentiment channels. Green gradients show buy-side dominance, red shows sell-side. The middle dashed line is the equilibrium of the channel. “▲” appears when price breaks upward, “▼” when it breaks downward.
Understanding Sentiment : The sentiment profile can be used to show the probability of the price moving up or down at respective price levels.


Ichimoku Average with Margin█ OVERVIEW
“Ichimoku Average with Margin” is a technical analysis indicator based on an average of selected Ichimoku system lines, enhanced with a dynamic safety margin (tolerance). Designed for traders seeking a simple yet effective tool for trend identification with breakout confirmation. The indicator offers flexible settings, line and label coloring, visual fills, and alerts for trend changes.
█ CONCEPT
The Ichimoku Cloud (Ichimoku Kinko Hyo) is an excellent, comprehensive technical analysis system, but for many traders—especially beginners—it remains difficult to interpret due to multiple overlapping lines and time displacements.
Experimentally, I decided to create a simplified version based on its foundations: combining selected lines into a single readable average (avgLine) and introducing a dynamic safety margin that acts as a buffer against market noise.
This is not the full Ichimoku system—it’s merely a clear method for determining trend, accessible even to beginners. The trend changes only after the price closes beyond the margin, eliminating false signals.
█ FEATURES
Ichimoku Lines:
- Tenkan-sen (Conversion Line) – Donchian average over 9 periods
- Kijun-sen (Base Line) – Donchian average over 26 periods
- Senkou Span A – average of Tenkan and Kijun
- Senkou Span B – Donchian average over 52 periods
- Chikou Span – close price (no offset)
Dynamic Average (avgLine):
- Arithmetic mean of only the enabled Ichimoku lines – full component selection flexibility.
Safety Margin (tolerance):
Calculated as:
- tolerance = multiplier × SMA(|open - close|, periods)
- Default: multiplier 1.8, period 100.
Trend Detection:
- Uptrend → when price > avgLine + tolerance
- Downtrend → when price < avgLine - tolerance
- Trend changes only after full margin breakout.
- Margin can be set to 0 – then signals trigger on avgLine crossover.
Signal Labels:
- “Buy” (green, upward arrow) – on shift to uptrend
- “Sell” (red, downward arrow) – on shift to downtrend
Visual Fills:
- Between avgLine and marginLine
- Between avgLine and price (with transparency)
- Colors: green (uptrend), red (downtrend)
Alerts:
- Trend Change Up – price crosses above margin
- Trend Change Down – price crosses below margin
█ HOW TO USE
Add to Chart: Paste code in Pine Editor or find in the indicator library.
Settings:
Ichimoku Parameters:
- Conversion Line Length → default 9
- Base Line Length → default 26
- Leading Span B Length → default 52
- Average Body Periods → default 100
- Tolerance Multiplier → default 1.8
Line Selection:
- Enable/disable: Tenkan, Kijun, Span A, Span B, Chikou
Visual Settings:
- Uptrend Color → default green
- Downtrend Color → default red
- Fill Between Price & Avg → enables shadow fill
Signal Interpretation:
- Average Line (avgLine): Primary trend reference level.
- Margin (marginLine): Buffer – price must break it to change trend. Set to 0 for signals on avgLine crossover.
- Buy/Sell Labels: Appear only on confirmed trend change.
- Fills: Visualize distance between price, average, and margin.
- Alerts: Set in TradingView → notifications on trend change.
█ APPLICATIONS
The indicator works well in:
- Trend-following: Enter on Buy/Sell, exit on reversal.
- Breakout confirmation: Ideal for breakout strategies with false signal protection.
- Noise filtering: Margin eliminates consolidation fluctuations.
Adjusting margin to trading style:
- Short-term trading (scalping, daytrading): Reduce or set margin to 0 → more and faster signals (but more false ones).
- Long-term strategies (swing, position): Increase margin (e.g. 2.0–3.0) → fewer signals, higher quality.
Entry signals are not limited to Buy/Sell labels – use like moving averages:
- Test and bounce off avgLine as support/resistance
- avgLine breakout as momentum signal
- Pullback to margin as trend continuation entry
Combine with:
- Support/resistance levels
- Fair Value Gaps (FVG)
- Volume or other momentum indicators
█ NOTES
- Works on all markets and timeframes.
- Adjust multiplier and periods to instrument volatility.
- Higher multiplier → fewer signals, higher quality.
- Disable unused Ichimoku lines to simplify the average.

Bitcoin CME gaps multi-timeframe auto finder1. Overview
The Bitcoin CME Gap Multi-Timeframe Detector automatically identifies price gaps in the Bitcoin CME (Chicago Mercantile Exchange) futures market and visually displays them on the TradingView chart.
Because the CME futures market closes for about an hour after each weekday session and remains closed over the weekend, price gaps frequently appear when trading resumes on Monday.
This indicator analyzes gaps across six major timeframes, from 5-minute to 1-day charts, allowing traders to easily identify structural imbalances and potential support/resistance zones.
It is the most accurate and feature-rich CME gaps indicator available on TradingView.
2. Key Features
■ Multi-Timeframe Gap Detection
Analyzes 5m, 15m, 30m, 1h, 4h, and 1D charts simultaneously.
This enables traders to observe both short-term volatility and mid-to-long-term structure, providing a multi-dimensional view of market dynamics.
■ Gap Direction Classification
Up Gap: When the next candle’s open is higher than the previous candle’s high (default color: green tone)
Down Gap: When the next candle’s open is lower than the previous candle’s low (default color: red tone)
Gaps are color-coded to intuitively visualize potential support and resistance zones.
■ Highlight Function
Gaps exceeding a user-defined threshold (%) are highlighted (default color: yellow).
This helps quickly identify zones with abnormal volatility or sharp price dislocations.
■ Labels and Box Extension
Each gap displays a percentage label indicating its relative size and significance.
Gap zones are extended to the right as boxes, allowing traders to visually track when and how the gap gets filled over time.
■ Alert System
When a gap forms on the selected timeframe (or across all timeframes), a TradingView alert is triggered.
This enables real-time response to significant gap events.
3. Trading Strategies
■ Gap Fill Behavior
CME gaps statistically tend to get filled over time.
Gap boxes help distinguish between filled and unfilled gaps at a glance.
Up Gap: Price tends to decline to fill the previous high–next open zone.
Down Gap: Price often rises later to fill the previous low–next open zone.
■ Support & Resistance Levels
Gap zones frequently act as strong support or resistance.
When price retests a gap area, observing the reaction of buyers and sellers can provide valuable trading insights.
Overlapping gap boxes across multiple timeframes indicate high-confidence support/resistance zones.
■ Market Sentiment & Volatility Analysis
Large gaps usually result from shifts in market sentiment or major news events.
This indicator allows traders to detect volatility spikes early and prepare for potential trend reversals.
■ Combination with Other Technical Tools
While fully functional on its own, this indicator works even better when combined with tools like moving averages (MA), RSI, MACD, or Fibonacci retracements.
For example, if the bottom of a gap coincides with the 0.618 Fibonacci level, it may signal a strong rebound zone.
4. Settings Options
Minimum Gap % | Sets the minimum percentage movement required to detect a gap (lower values show smaller gaps)
Display Timeframes | Choose which timeframes to display (5m, 15m, 30m, 1h, 4h, 1D)
Box Colors | Assign colors for up and down gaps
Box Extension (Bars) | Number of bars to extend gap boxes to the right
Show Labels | Toggle display of gap percentage labels
Label Position / Size | Adjust label position and size
Highlight Gap ≥ % | Highlight gaps exceeding a specified percentage
Highlight Colors | Set highlight color for labels and boxes
Enable Alerts | Enable or disable alerts
Alert Timeframe | Select timeframe(s) for alerts (“All” = all timeframes)
5. Summary
This indicator is a professional trading tool that provides quantitative and visual analysis of price gaps in the Bitcoin CME futures market.
By combining multi-timeframe detection, highlighting, and alert systems, it helps traders clearly identify zones of market imbalance and potential reversal areas.


Trend change[YI_YA_HA_]這是一個趨勢變化和盤整突破偵測指標。
This is a trend change and consolidation breakout detection indicator.
它能自動識別價格進入狹窄盤整區間。
It automatically identifies when price enters a tight consolidation range.
當價格突破箱型上緣,就判定為上升趨勢開始。
When price closes above the box top, it signals the start of an uptrend.
當價格突破箱型下緣,則觸發下跌趨勢警報。
When price closes below the box bottom, it triggers a downtrend alert.
程式會畫出黃色盤整箱體,突破後自動消失。
The script draws a yellow consolidation box that auto-deletes after breakout.
突破向上時,會從低點畫一條綠色趨勢線持續延伸。
On upward breakout, a green trendline is drawn from the low and extends right.
右側標籤即時顯示目前趨勢狀態與價格。
A label on the right shows the current trend status and price in real-time.

Lateral Market DetectorOverview
The Lateral Market Detector is a TradingView indicator designed to identify and highlight range-bound market conditions (sideways movement) where price oscillates between defined support and resistance levels with minimal overall movement.
How It Works
The indicator analyzes price action using a dynamic range detection algorithm:
Range Calculation: Examines the last N candlesticks (default 50, adjustable 20-200) and calculates the difference between the highest high and lowest low within this period.
Laterality Detection: Compares the calculated range against a configurable tolerance threshold (in pips). If the range is smaller than the tolerance, the market is identified as laterally moving.
Confirmation Logic: Counts consecutive candlesticks that remain within the detected range. The indicator only confirms a lateral condition when the minimum number of consecutive candlesticks has been reached (default 15).
Visual Representation: Once confirmed, displays a colored rectangle (box) spanning from the range's start point to the current bar, with horizontal dashed lines marking the high and low levels.
Dynamic Update: Continuously updates the rectangle as new candlesticks form, adjusting the top and bottom boundaries if price remains within the lateral zone.
Key Features
Multi-Timeframe Optimization
Automatic timeframe adaptation using square root scaling
When enabled, parameters adjust proportionally based on the current timeframe (M1, M5, M15, M30, H1, D1, W1, MN)
Prevents the need for manual parameter adjustments across different timeframes
Formula: Adjusted_Tolerance = Base_Tolerance × √(Timeframe_Multiplier)
Customizable Parameters
Tolerance Pip (M1): Sets the maximum range width to identify laterality
Minimum Candlesticks: Minimum consecutive candles required to confirm a lateral zone
Candlesticks to Analyze: Lookback period for range calculation
Breakout Sensitivity: Controls the threshold for identifying range breakouts
Full Visual Customization
Rectangle color and transparency
High/Low line color and thickness
Automatic status display showing current timeframe, lateral confirmation, and active parameters
Use Cases
Range Trading: Identify optimal entry and exit points at support/resistance
Breakout Trading: Visual confirmation before entering breakout trades
Trend Analysis: Distinguish between trending and consolidating markets
Risk Management: Define clear stop-loss levels based on range boundaries
Technical Specifications
Indicator Type: Overlay
Maximum Boxes: 100 (prevents performance degradation)
Supported Assets: Forex, CFDs, Stocks, Cryptocurrencies
Pine Script Version: v5
Chart Display: Real-time updates on each new candlestick

Opening Range Break LRSThis script is designed for a trend-following, opening range breakout strategy. The main idea is to only trade breakouts that happen in the same direction as the short-term trend, which the script identifies using a linear regression slope.
1. Identify the Short-Term Trend
This is the first and most important step. The script does this for you using the Linear Regression and the bar coloring.
• If the bars are colored BLUE: The linear regression slope is positive. This means the script considers the short-term trend to be UP. A trader using this script would only look for long (buy) trades.
• If the bars are colored YELLOW: The linear regression slope is negative. This means the script considers the short-term trend to be DOWN. A trader using this script would only look for short (sell) trades.
This filter is designed to prevent you from trading a "false breakout" against the immediate momentum.
2. Watch the Opening Ranges Form
At the start of the trading session (8:30 AM by default), the script will begin drawing boxes for the 5, 15, 30, and 60-minute opening ranges you've enabled.
• The 5-minute box (e.g., gray) will be set after the 8:30 - 8:35 period.
• The 15-minute box (e.g., blue) will be set after the 8:30 - 8:45 period.
• ...and so on.
These boxes, which extend for the rest of the day, represent the key high and low levels established at the open. The "Live Box Extension" input simply keeps the right edge of the box a few bars away from the current price so you can see it clearly.
3. Look for a Filtered Breakout Signal
This is where the trend filter (Step 1) and the range boxes (Step 2) come together.
Bullish Trade Example (Long):
1. A trader sees the bars are colored BLUE (uptrend). They are now only looking for a break above one of the ORB highs.
2. They will ignore any break below the ORB lows, as that would be trading against the trend filter.
3. The price moves up and finally closes above the 15-minute ORB high.
4. The script will plot a green "Break 15" label. This is the trader's signal to enter a long trade.
Bearish Trade Example (Short):
1. A trader sees the bars are colored YELLOW (downtrend). They are now only looking for a break below one of the ORB lows.
2. They will ignore any break above the ORB highs.
3. The price moves down and closes below the 5-minute ORB low.
4. The script will plot a red "Break 5" label. This is the trader's signal to enter a short trade.
4. Use Multiple Timeframes for Context
The real power of this script is seeing all the ranges at once. A trader wouldn't just trade them in isolation.
• Confirmation: A "Break 5" signal is a quick, early signal. But if the price also breaks the "15" and "30" minute highs, it signals much stronger bullish consensus, which might encourage the trader to hold the trade longer.
• Support & Resistance: The other ORB levels act as a map for the day.
o As Targets: If a trader takes a "Break 15" long signal, the 30-minute ORB high and 60-minute ORB high become logical profit targets.
o As Warning Signs: If the price gives a "Break 5" long signal but is struggling right under the 15-minute high, a trader might wait for that 15-minute level to break before entering, seeing it as a key resistance level.
Summary: A Trader's Workflow
1. Morning (8:30 AM): Watch the script. What color are the bars? (Blue = longs only, Yellow = shorts only).
2. Wait: Let the 5, 15, 30, and 60-minute ranges form. The boxes will be drawn on the chart.
3. Execute: Wait for a "Break" signal (a label) that matches your trend direction.
4. Manage: Use the other ORB levels as potential profit targets or as confirmation of the move's strength.
5. Single Signal: The "Single Signal Only" input, if checked, ensures they only get one signal per timeframe (e.g., one "Break 15" long, and that's it for the day), which helps prevent over-trading in choppy conditions.

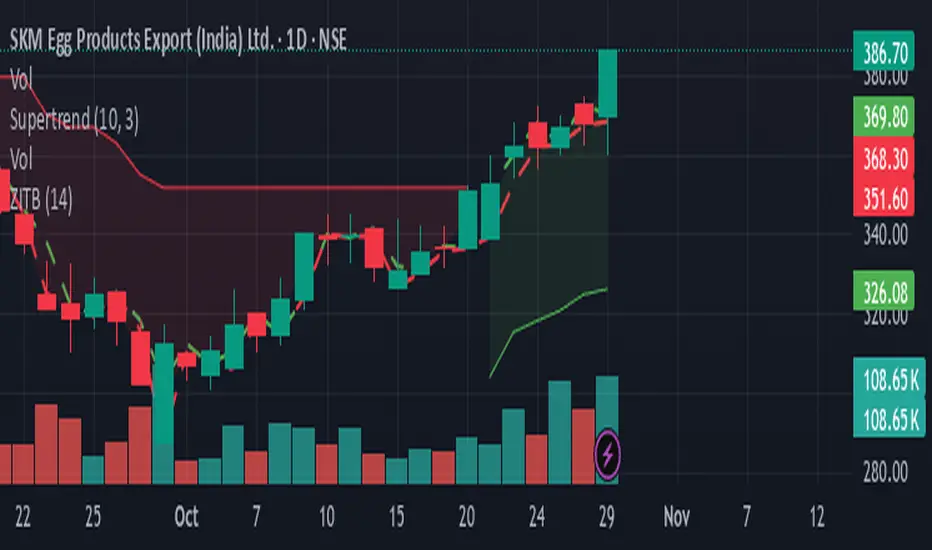
Zarattini Intra-day Threshold Bands (ZITB)This indicator implements the intraday threshold band methodology described in the research paper by Carlo Zarattini et al.
Overview:
Plots intraday threshold bands based on daily open/close levels.
Supports visualization of BaseUp/BaseDown levels and Threshold Upper/Lower bands.
Optional shading between threshold bands for easier interpretation.
Usage Notes / Limitations:
Originally studied on SPY (US equities), this implementation is adapted for NSE intraday market timing, specifically the NIFTY50 index.
Internally, 2-minute candles are used if the chart timeframe is less than 2 minutes.
Values may be inaccurate if the chart timeframe is more than 1 day.
Lookback days are auto-capped to avoid exceeding TradingView’s 5000-bar limit.
The indicator automatically aligns intraday bars across multiple days to compute average deltas.
For better returns, it is recommended to use this indicator in conjunction with VWAP and a volatility-based position sizing mechanism.
Can be used as a reference for Open Range Breakout (ORB) strategies.
Customizations:
Toggle plotting of base levels and thresholds.
Toggle shading between thresholds.
Line colors and styles can be adjusted in the Style tab.
Intended for educational and research purposes only.
This indicator implements the approach described in the research paper by Zarattini et al.
Note: This implementation is designed for the NSE NIFTY50 index. While Zarattini’s original study was conducted on SPY, this version adapts the methodology for the Indian market.
Methodology Explanation
This indicator is primarily designed for Open Range Breakout (ORB) strategies.
Base Levels
BaseUp = Maximum of today’s open and previous day’s close
BaseDown = Minimum of today’s open and previous day’s close
Delta Calculation
For the past 14 trading days (lookbackDays), the delta for each intraday candle is calculated as the ab
solute difference from the close of the first candle of that day.
Average Delta
For a given intraday time/candle today, deltaAvg is computed as the average of the deltas at the same time across the previous 14 days.
Threshold Bands
ThresholdUp = BaseUp + deltaAvg
ThresholdDown = BaseDown − deltaAvg
Signals
Spot price moving above ThresholdUp → Long signal
Spot price moving below ThresholdDown → Short signal
Tip: For better returns, combine this indicator with VWAP and a volatility-based position sizing mechanism.
Auto Fibonacci LevelsAuto Fibonacci Momentum Zones with Visible Range Table
Overview and Originality
The Auto Fibonacci Momentum Zones indicator offers a streamlined, static overlay of Fibonacci retracement levels inspired by extreme RSI momentum thresholds, enhanced with a dynamic table displaying the high and low of the currently visible chart range. This isn't a repackaged RSI oscillator or basic Fib drawer—common in TradingView's library—but a purposeful fusion of geometric harmony (Fibonacci ratios) with momentum psychology (RSI extremes at 35/85), projected as fixed horizontal reference lines on the price chart. The addition of the visible range table, powered by PineCoders' VisibleChart library, provides real-time context for the chart's current view, enabling traders to quickly assess range compression or expansion relative to these zones.
This script's originality stems from its "static momentum mapping": by hardcoding Fib levels on a dynamic chart, it creates universal psychological support/resistance lines that transcend specific assets or timeframes.
Unlike dynamic Fib tools that auto-adjust to price swings (risking noise in ranging markets) or standalone RSI plots (confined to panes), this delivers clean, bias-adjustable overlays for confluence analysis. The visible range table justifies the library integration—it's not a gratuitous add-on but a complementary tool that quantifies the "screen real estate" of price action, helping users correlate Fib touches with actual volatility. Drawn from original code (no auto-generation or public templates), it builds TradingView's body of knowledge by simplifying multi-tool workflows into one indicator, ideal for discretionary traders who value visual efficiency over algorithmic complexity.
How It Works: Underlying Concepts
Fibonacci retracements, derived from the Fibonacci sequence and the golden ratio (≈0.618), identify potential reversal points based on the idea that markets retrace prior moves in predictable proportions: shallow (23.6%, 38.2%), mid (50%), and deep (61.8%, 78.6%).
Adjustable Outputs
1. The "Invert Fibs" toggle (default: true) for bearish/topping bias, can be flipped aligning with trend context.
2. Fibonacci Levels: Seven semi-transparent horizontal lines are drawn using `hline()`:
- 0.0 at high (gray).
- 0.236: high - (range × 0.236) (light cyan, shallow pullback).
- 0.382: high - (range × 0.382) (teal, common retracement).
- 0.5: midpoint average (green, equilibrium).
- 0.618: high - (range × 0.618) (amber, golden pocket for reversals).
- 0.786: high - (range × 0.786) (orange, deep support).
- 1.0 at low (gray).
Colors progress from cool (shallow) to warm (deep) for intuitive scanning.
3. Optional Fib Labels: Right-edge text labels (e.g., "0.618") appear only if enabled, positioned at the last bar + offset for non-cluttering visibility.
4. Visible Range Table: Leveraging the VisibleChart library's `visible.high()` and `visible.low()` functions, a compact 2x2 table (top-right corner) updates on the last bar to show the extrema of bars currently in view. This mashup enhances utility: Fib zones provide fixed anchors, while the table's dynamic values reveal if price is "pinned" to a zone (e.g., visible high hugging 0.382 signals resistance). The library is invoked sparingly for performance, adding value by bridging static geometry with viewport-aware data—unavailable in built-ins without custom code.
How to Use It
1. Setup:
Add to any chart (e.g., 15M for scalps, Daily for swings). As an overlay, lines appear directly on price candles—adjust chart scaling if needed.
2. Input Tweaks:
Invert Fibs: Enable for downtrends (85 top), disable for uptrends (35 bottom).
Show Fibs: Toggle labels for ratio callouts (off for clean charts).
Show Table: Display/hide the visible high/low summary (red for high, green for low, formatted to 2 decimals).
3. Trading Application:
Zone Confluence: Seek price reactions at each fibonacci level—e.g., a doji at 0.618 + rising volume suggests entry; use 0.0/1.0 as invalidation.
Range Context: Check the table: If visible high/low spans <20% of the Fib arc (e.g., both near 0.5), anticipate breakout; wider spans signal consolidation.
Multi-Timeframe: Overlay on higher TF for bias, lower for precision—e.g., Daily Fibs guide 1H entries.
Enhancements: Pair with volume or candlesticks; set alerts on line crosses via TradingView's built-in tools. Backtest on your symbols to validate (e.g., equities favor 0.382, forex the 0.786).
This indicator automates advanced Fibonacci synthesis dynamically, eliminating manual measurement and calculations.
published by ozzy_livin

SuperTrend Cyan — Split ST & Triple Bands (A/B/C)SuperTrend Cyan — Split ST & Triple Bands (A/B/C)
✨ Concept:
The SuperTrend Cyan indicator expands the classical SuperTrend logic into a split-line + triple-band visualization for clearer structure and volatility mapping.
Instead of a single ATR-based line, this tool separates SuperTrend direction from volatility envelopes (A/B/C), providing a layered view of both regime and range compression.
✨ The design goal:
Preserve the simplicity of SuperTrend
Add volatility context via multi-band envelopes
Provide a compact MTF (Multi-Timeframe) summary for broader trend alignment
✨ How It Works
1. SuperTrend Core (Active & Opposite Lines)
Uses ATR-based bands (Factor × ATR-Length).
Active SuperTrend is plotted according to current regime.
Opposite SuperTrend (optional) shows potential reversal threshold.
2. Triple Band System (A/B/C)
Each band (A, B, C) scales from the median price (hl2) by different ATR multipliers.
A: Outer band (wider, long-range context)
B: Inner band (mid-range activity)
C: Core band (closest to price, short-term compression)
Smoothness can be controlled with EMA.
Uptrend fills are lime-toned, downtrend fills are red-toned, with adjustable opacity (gap intensity).
3. Automatic Directional Switch
When the regime flips from up → down (or vice versa), the overlay automatically switches between lower and upper bands for a clean transition.
4. Multi-Timeframe SuperTrend Table
Displays SuperTrend direction across 5m, 15m, 1h, 4h, and 1D frames.
Green ▲ = Uptrend, Red ▼ = Downtrend.
Useful for checking cross-timeframe trend alignment.
✨ How to Read It
Green SuperTrend + Lime Bands
- Uptrend regime; volatility expanding upward
Red SuperTrend + Red Bands
- Downtrend regime; volatility expanding downward
Narrow gaps (A–C)
- Low volatility / compression (potential squeeze)
Wide gaps
- High volatility / active trend phase
Opposite ST line close to price
- Early warning for regime transition
✨ Practical Use
Identify trend direction (SuperTrend color & line position).
Assess volatility conditions (band width and gap transparency).
Watch for MTF alignment: consistent up/down signals across 1h–4h–1D = strong structural trend.
Combine with momentum indicators (e.g., RSI, DFI, PCI) for confirmation of trend maturity or exhaustion.
✨ Customization Tips
ST Factor / ATR Length
- Adjust sensitivity of SuperTrend direction changes
Band ATR Length
- Controls overall smoothness of volatility envelopes
Band Multipliers (A/B/C)
- Define how wide each volatility band extends
Gap Opacity
- Affects visual contrast between layers
MTF Table
- Enable/disable multi-timeframe display
✨ Educational Value
This script visualizes the interaction between trend direction (SuperTrend) and volatility envelopes, helping traders understand how price reacts within layered ATR zones.
It also introduces a clean MTF (multi-timeframe) perspective — ideal for discretionary and system traders alike.
✨ Disclaimer
This indicator is provided for educational and research purposes only.
It does not constitute financial advice or a trading signal.
Use at your own discretion and always confirm with additional tools.
───────────────────────────────
📘 한국어 설명 (Korean translation below)
───────────────────────────────
✨개념
SuperTrend Cyan 지표는 기존의 SuperTrend를 확장하여,
추세선 분리(Split Line) + 3중 밴드 시스템(Triple Bands) 으로
시장의 구조적 흐름과 변동성 범위를 동시에 시각화합니다.
단순한 SuperTrend의 강점을 유지하면서도,
ATR 기반의 A/B/C 밴드를 통해 변동성 압축·확장 구간을 직관적으로 파악할 수 있습니다.
✨ 작동 방식
1. SuperTrend 코어 (활성/반대 라인)
ATR×Factor를 기반으로 추세선을 계산합니다.
현재 추세 방향에 따라 활성 라인이 표시되고, “Show Opposite” 옵션을 켜면 반대편 경계선도 함께 보입니다.
2. 트리플 밴드 시스템 (A/B/C)
hl2(중간값)를 기준으로 ATR 배수에 따라 세 개의 밴드를 계산합니다.
A: 외곽 밴드 (가장 넓고 장기 구조 반영)
B: 중간 밴드 (중기적 움직임)
C: 코어 밴드 (가격에 가장 근접, 단기 변동성 반영)
EMA 스무딩으로 부드럽게 조정 가능.
업트렌드 구간은 라임색, 다운트렌드는 빨간색 음영으로 표시됩니다.
3. 자동 전환 시스템
추세가 전환될 때(Up ↔ Down), 밴드 오버레이도 자동으로 교체되어 깔끔한 시각적 구조를 유지합니다.
4. MTF SuperTrend 테이블
5m / 15m / 1h / 4h / 1D 프레임별 SuperTrend 방향을 표시합니다.
초록 ▲ = 상승, 빨강 ▼ = 하락.
복수 타임프레임 정렬 확인용으로 유용합니다.
✨ 해석 방법
초록 SuperTrend + 라임 밴드
- 상승 추세 및 확장 구간
빨강 SuperTrend + 레드 밴드
- 하락 추세 및 확장 구간
밴드 폭이 좁음
- 변동성 축소 (스퀴즈)
밴드 폭이 넓음
- 변동성 확장, 추세 강화
반대선이 근접
- 추세 전환 가능성 높음
✨ 활용 방법
SuperTrend 색상으로 추세 방향을 확인
A/B/C 밴드 폭으로 변동성 수준을 판단
MTF 테이블을 통해 복수 타임프레임 정렬 여부 확인
RSI, DFI, PCI 등 다른 지표와 함께 활용 시, 추세 피로·모멘텀 변화를 조기에 파악 가능
✨ 교육적 가치
이 스크립트는 추세 구조(SuperTrend) 와 변동성 레이어(ATR Bands) 의 상호작용을
시각적으로 학습하기 위한 교육용 지표입니다.
또한, MTF 구조를 통해 시장의 “위계적 정렬(hierarchical alignment)”을 쉽게 인식할 수 있습니다.
✨ 면책
이 지표는 교육 및 연구 목적으로만 제공됩니다.
투자 판단의 책임은 사용자 본인에게 있으며, 본 지표는 매매 신호를 보장하지 않습니다.

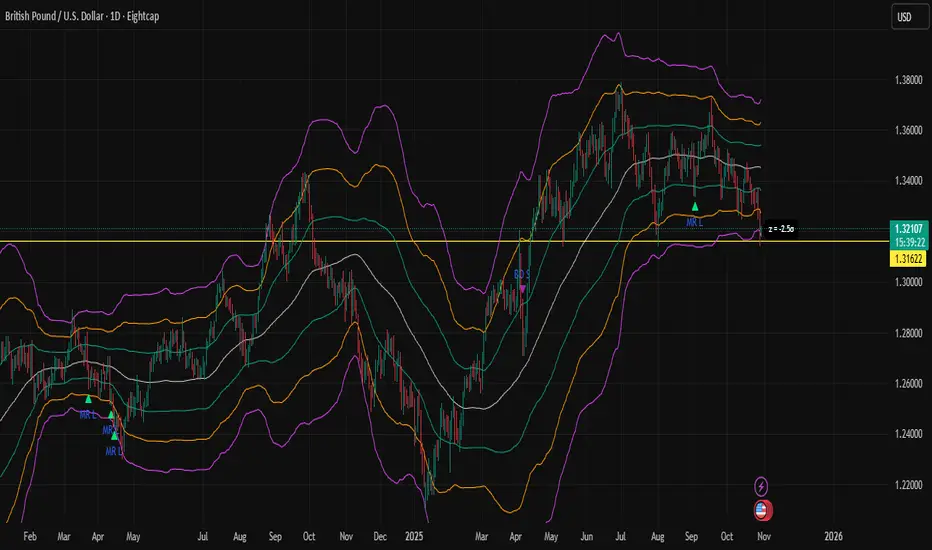
Z-Score Bands + SignalsZ-Score Statistical Market Analyzer
A multi-dimensional market structure indicator based on standardized deviation & regime logic
English Description
Concept
This indicator builds a statistical model of price behaviour by converting every candle’s movement into a Z-score — how many standard deviations each close is away from its moving average.
It visualizes the normal distribution structure of returns and provides adaptive entry signals for both Mean Reversion and Breakout regimes.
Rather than predicting price direction, it measures statistical displacement from equilibrium and dynamically adjusts the decision logic according to the market’s volatility regime.
⚙️ Main Components
Z-Score Bands (±1σ, ±2σ, ±3σ)
– The core structure visualizes volatility boundaries based on rolling mean and standard deviation.
– Price outside ±2σ often indicates statistical extremes.
Dual Signal Systems
Mean Reversion (MRL / MRS): when price (or return z-score) crosses back inside ±2σ bands.
Breakout (BOL / BOS): when price continues to expand beyond ±2σ.
Volatility Regime Classification
The indicator detects whether the market is currently in a low-vol or high-vol regime using percentile statistics of σ.
Low vol → Mean Reversion preferred
High vol → Breakout preferred
🧠 Adaptive Switches
A. Freeze MA/σ - Use previous-bar stats to avoid repainting and lag.
B. Confirm on Close - Only generate signals once the base-timeframe bar closes (eliminates look-ahead bias).
C. Return-based Signal - Use log-return Z-score instead of price deviation — normalizes volatility across assets.
D. Outlier Filter - Exclude bars with abnormal single-bar returns (e.g., >20%). Reduces false spikes.
E. Regime Gating - Automatically switch between Mean Reversion and Breakout logic depending on volatility percentile.
Each module can be toggled individually to test different statistical behaviours or tailor to a specific market condition.
📊 Interpretation
When the histogram of returns approximates a normal distribution, mean-reversion logic is often more effective.
When price persistently drifts beyond ±2σ or ±3σ, the distribution becomes leptokurtic (fat-tailed) — a breakout structure dominates.
Hence, this tool can help you:
Identify whether an asset behaves more “Gaussian” or “fat-tailed”;
Select the correct trading regime (MR or BO);
Quantitatively measure market tension and volatility clusters.
🧩 Recommended Use
Works on any timeframe and any asset.
Best used on liquid instruments (e.g., XAU/USD, indices, major FX pairs).
Combine with volume, sentiment or structural filters to confirm signals.
For strategy automation, pair with the companion script:
🧠 “Z-Score Strategy • Multi-Source Confirm (MRL/MRS/BOL/BOS)”.
⚠️ Disclaimer
This script is designed for educational and research purposes.
Statistical deviation ≠ directional prediction — use with sound risk management.
Past distribution patterns may shift under new volatility regimes.
==================================================================================
中文说明(简体)
概念简介
该指标基于价格的统计分布原理,将每根 K 线的波动转化为标准化的 Z-Score(标准差偏离值),用于刻画市场处于均衡或偏离状态。
它同时支持 均值回归(Mean Reversion) 与 突破延展(Breakout) 两种逻辑,并可根据市场波动结构自动切换策略模式。
⚙️ 主要功能模块
Z-Score 通道(±1σ / ±2σ / ±3σ)
用滚动均值与标准差动态绘制的统计波动带,价格超出 ±2σ 区域通常意味着极端偏离。
双信号系统
MRL / MRS(均值回归多空):价格重新回到 ±2σ 以内时触发。
BOL / BOS(突破延展多空):价格持续运行在 ±2σ 之外时触发。
波动率分层
自动识别市场处于高波动还是低波动区间:
低波动期 → 适合均值回归逻辑;
高波动期 → 适合突破趋势逻辑。
🧠 A–E 模块说明
A. 固定统计参数:使用上一根 K 线的均值和标准差,防止重绘。
B. 收盘确认信号:仅在当前时间框架收盘后生成信号,避免前视偏差。
C. 收益率信号模式:采用对数收益率的 Z-Score,更具普适性。
D. 异常波过滤:忽略单根极端波动(如 >20%)的噪声信号。
E. 波动率调节逻辑:根据市场处于高/低波动区间,自动切换 MRL/MRS 或 BOL/BOS。
📊 应用解读
如果收益率分布接近正态分布 → 市场倾向震荡,MRL/MRS 效果较佳;
若价格频繁偏离 ±2σ 或 ±3σ → 市场呈现“肥尾”分布,趋势延展占主导。
因此,该指标的核心目标是:
识别当前市场的统计结构类型;
根据波动特征自动切换交易逻辑;
提供结构化、可量化的市场状态刻画。
💡 使用建议
适用于所有时间框架与金融品种。
建议结合成交量或结构性指标过滤。
若用于策略回测,可搭配同名 “Z-Score Strategy • Multi-Source Confirm” 策略脚本。
⚠️ 免责声明
本指标仅用于研究与教学,不构成任何投资建议。
统计偏离 ≠ 趋势预测,实际市场行为可能在不同波动结构下改变。
pine script tradingbot - many ema oscillator## 🧭 **Many EMA Oscillator (TradingView Pine Script Indicator)**
*A multi-layer EMA differential oscillator for trend strength and momentum analysis*
---
### 🧩 **Overview**
The **Many EMA Oscillator** is a **TradingView Pine Script indicator** designed to help traders visualize **trend direction**, **momentum strength**, and **multi-timeframe EMA alignment** in one clean oscillator panel.
It’s a **custom EMA-based trend indicator** that shows how fast or slow different **Exponential Moving Averages (EMAs)** are expanding or contracting — helping you identify **bullish and bearish momentum shifts** early.
This **Pine Script EMA indicator** is especially useful for traders looking to combine multiple **EMA signals** into one **momentum oscillator** for better clarity and precision.
---
### ⚙️ **How It Works**
1. **Multiple EMA Layers:**
The indicator calculates seven **EMAs** (default: 20, 50, 100, 150, 200, 300) and applies a **smoothing filter** using another EMA (default smoothing = 20).
This removes short-term noise and gives a smoother, professional-grade momentum reading.
2. **EMA Gap Analysis:**
The oscillator measures the **difference between consecutive EMAs**, revealing how trend layers are separating or converging.
```
diff1 = EMA(20) - EMA(50)
diff2 = EMA(50) - EMA(100)
diff3 = EMA(100) - EMA(150)
diff4 = EMA(150) - EMA(200)
diff5 = EMA(200) - EMA(300)
```
These gaps (or “differentials”) show **trend acceleration or compression**, acting like a **multi-EMA MACD system**.
3. **Color-Coded Visualization:**
Each differential (`diff1`–`diff5`) is plotted as a **histogram**:
- 🟢 **Green bars** → EMAs expanding → bullish momentum growing
- 🔴 **Red bars** → EMAs contracting → bearish momentum or correction
This gives a clean, compact view of **trend strength** without cluttering your chart.
4. **Automatic Momentum Signals:**
- **🟡 Up Triangle** → All EMA gaps increasing → strong bullish trend alignment
- **⚪ Down Triangle** → All EMA gaps decreasing → trend weakening or bearish transition
---
### 📊 **Inputs**
| Input | Default | Description |
|-------|----------|-------------|
| `smmoth_emas` | 20 | Smoothing factor for all EMAs |
| `Length2`–`Length7` | 20–300 | Adjustable EMA periods |
| `Length21`, `Length31`, `Length41`, `Length51` | Optional | For secondary EMA analysis |
---
### 🧠 **Interpretation Guide**
| Observation | Meaning |
|--------------|----------|
| Increasing green bars | Trend acceleration and bullish continuation |
| Decreasing red bars | Trend exhaustion or sideways consolidation |
| Yellow triangles | All EMA layers aligned bullishly |
| White triangles | All EMA layers aligned bearishly |
This **EMA oscillator for TradingView** simplifies **multi-EMA trading strategies** by showing alignment strength in one place.
It works great for **swing traders**, **scalpers**, and **trend-following systems**.
---
### 🧪 **Best Practices for Use**
- Works on **all TradingView timeframes** (1m, 5m, 1h, 1D, etc.)
- Suitable for **stocks, forex, crypto, and indices**
- Combine with **RSI**, **MACD**, or **price action** confirmation
- Excellent for detecting **EMA compression zones**, **trend continuation**, or **momentum shifts**
- Can be used as part of a **multi-EMA trading strategy** or **trend strength indicator setup**
---
### 💡 **Why It Stands Out**
- 100% built in **Pine Script v6**
- Optimized for **smooth EMA transitions**
- Simple color-coded momentum visualization
- Professional-grade **multi-timeframe trend oscillator**
This is one of the most **lightweight and powerful EMA oscillators** available for TradingView users who prefer clarity over clutter.
---
### ⚠️ **Disclaimer**
This indicator is published for **educational and analytical purposes only**.
It does **not provide financial advice**, buy/sell signals, or investment recommendations.
Always backtest before live use and trade responsibly.
---
### 👨💻 **Author**
Developed by **@algo_coders**
Built in **Pine Script v6** on **TradingView**
Licensed under the (mozilla.org)

Liquidity Sweep & Reversal — Body Anchored + Risk (v6)Overview
The Liquidity Sweep & Reversal — Locked to Price (v6) indicator identifies liquidity sweeps around major swing highs and lows, confirming reversals when price closes back inside the swept level.
All signals are locked to price (bottom of green candle for BUY, top of red candle for SELL), so they remain perfectly aligned when zooming or scaling.
This indicator is ideal for swing traders and scalpers who trade reversals, liquidity events, and reclaim structures.
How It Works
Detects confirmed swing highs and lows using a pivot-based structure.
Waits for a liquidity sweep — when price wicks beyond a recent swing.
Confirms a reclaim when price closes back inside the previous swing level.
Triggers a BUY or SELL signal anchored to the candle body.
Automatically calculates stop loss and risk using ATR and your inputs.
Input Settings
Swing Detection
Swing Detection Strength: How many bars confirm a swing pivot. Higher = stronger swings.
Bars to Confirm Reclaim: Number of bars after a sweep for price to close back within the swing zone.
Swing Proximity %: How close price must come to a swing to count as a liquidity sweep.
Trend Filter (optional)
Use EMA Trend Filter: When enabled, only BUY in uptrend and SELL in downtrend.
Fast EMA Length / Slow EMA Length: Define EMAs used to detect trend direction.
Risk & Stop Management
ATR Length: Period for ATR calculation (volatility measurement).
Base ATR Stop Buffer (x ATR): Distance of stop loss from entry based on ATR multiplier.
Position Size (quote units): Your total position size in quote currency (e.g., USDT).
Risk % of (Position / 20): Defines how much of your position to risk per trade.
Example: (Position / 20) × Risk % = per-trade risk.
Chart Elements
BUY Arrow (green): Appears after a liquidity sweep and reclaim near a swing low.
SELL Arrow (red): Appears after a sweep and reclaim near a swing high.
Labels: Display entry price, stop loss (SL), and calculated risk dollar value.
EMAs: Optional fast/slow moving averages for directional bias.
Dynamic Stops: Adjust automatically using ATR × risk settings.
Trading Tips
Use BUY signals near liquidity sweeps under swing lows.
Use SELL signals near liquidity sweeps above swing highs.
Adjust swing length for different timeframes:
Lower values for scalping (3–5)
Higher values for swing trading (7–10)
Respect stop loss levels and use risk control settings for consistent sizing.
Combine with volume, OBV, or structure for confirmation.
Alerts
BUY — Locked to Price: "BUY: swing low reclaimed with dynamic stop."
SELL — Locked to Price: "SELL: swing high reclaimed with dynamic stop."
Best Use Cases
Liquidity-based reversals
Swing entry confirmation
Stop hunt reclaims
Structure-based entries
Author
Created by @roccodallas
For traders who value clean structure, risk control, and chart precision.

MA99+MA200+MA400HMA+SLMA+HMA+SL,you can type your enter price,00000011111112222223333333444444455555666666
Multi Time Frame EMAsThree EMAs with the option to hide them on higher timeframes. Simple and easy to use.

ATR Money Line Bands V2The "ATR Money Line Bands V2" is a clever TradingView overlay designed for trend identification with volatility-aware bands, evolving from basic ATR envelopes.
Reasoning Behind Construction: The core idea is to blend a smoothed trend line with dynamic volatility bands for reliable signals in varying markets. The "Money Line" uses linear regression (ta.linreg) on closes over a length (default 16) instead of a moving average, as it fits data via least-squares for a cleaner, forward-projected trend without lag artifacts. ATR (default 12-period) powers the bands because it measures true range volatility better than std dev in gappy assets like crypto/stocks—bands offset from the Money Line by ATR * multiplier (default 1.5). A dynamic multiplier (boosts by ~33% on spikes > prior ATR * 1.3) prevents tight bands from false breakouts during surges. Trend detection checks slope against an ATR-scaled tolerance (default 0.15) to ignore noise, labeling bull/bear/neutral—avoiding whipsaws in flats.
Properties: It's an overlay with a colored Money Line (green bull, red bear, yellow neutral) and invisible bands (toggle to show gray lines) filled semi-transparently matching trend for visual pop. Dynamic adaptation makes bands widen/contract intelligently. An info table (positionable, e.g., top_right) displays real-time values: Money Line, bands, ATR, trend—great for quick scans. Limits history (2000 bars) and labels (500) for efficiency.
Tips for Usage: Apply to any timeframe/asset; defaults suit medium-term (e.g., daily stocks). Watch color flips: green for longs (enter on pullbacks to lower band), red for shorts (vice versa), yellow to sit out. Use bands as S/R—breakouts signal momentum, squeezes impending vol. Tweak length for sensitivity (shorter for intraday), multiplier for width (higher for trends), tolerance for fewer neutrals. Pair with volume/RSI for confirmation; backtest to optimize. In choppy markets, disable dynamic mult to avoid over-expansion. Overall, it's adaptive and visual—helps trend-follow without overcomplicating.

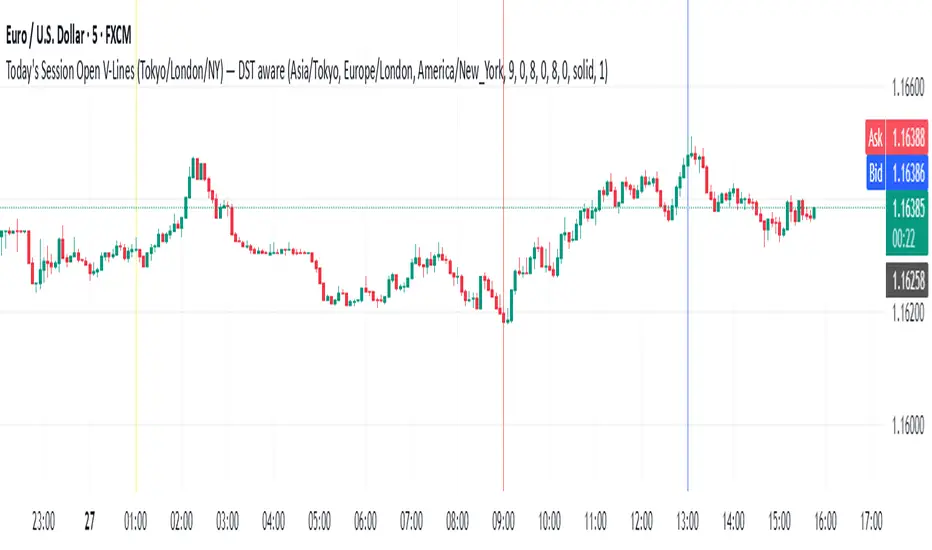
Todays Session Open LN,NYWhen are the Asian, London and New York open for each session simple stuff trading view made me right more stuff so i can publish this what to do c'est la vie