Supply and Demand Zones [BigBeluga]🔵 OVERVIEW
The Supply and Demand Zones indicator automatically identifies institutional order zones formed by high-volume price movements. It detects aggressive buying or selling events and marks the origin of these moves as demand or supply zones. Untested zones are plotted with thick solid borders, while tested zones become dashed, signaling reduced strength.
🔵 CONCEPTS
Supply Zones: Identified when 3 or more bearish candles form consecutively with above-average volume. The script then searches up to 5 bars back to find the last bullish candle and plots a supply zone from that candle’s low to its low plus ATR.
Demand Zones: Detected when 3 or more bullish candles appear with above-average volume. The script looks up to 5 bars back for a bearish candle and plots a demand zone from its high to its high minus ATR.
Volume Weighting: Each zone displays the cumulative bullish or bearish volume within the move leading to the zone.
Tested Zones: If price re-enters a zone and touches its boundary after being extended for 15 bars, the zone becomes dashed , indicating a potential weakening of that level.
Overlap Logic: Older overlapping zones are removed automatically to keep the chart clean and only show the most relevant supply/demand levels.
Zone Expiry: Zones are also deleted after they’re fully broken by price (i.e., price closes above supply or below demand).
🔵 FEATURES
Auto-detects supply and demand using volume and candle structure.
Extends valid zones to the right side of the chart.
Solid borders for fresh untested zones.
Dashed borders for tested zones (after 15 bars and contact).
Prevents overlapping zones of the same type.
Labels each zone with volume delta collected during zone formation.
Limits to 5 zones of each type for clarity.
Fully customizable supply and demand zone colors.
🔵 HOW TO USE
Use supply zones as potential resistance levels where sell-side pressure could emerge.
Use demand zones as potential support areas where buyers might step in again.
Pay attention to whether a zone is solid (untested) or dashed (tested).
Combine with other confluences like volume spikes, trend direction, or candlestick patterns.
Ideal for swing traders and scalpers identifying key reaction levels.
🔵 CONCLUSION
Supply and Demand Zones is a clean and logic-driven tool that visualizes critical liquidity zones formed by institutional moves. It tracks untested and tested levels, giving traders a visual edge to recognize where price might bounce or reverse due to historical order flow.
Bänder und Kanäle

Bollinger Bands Forecast with Signals (Zeiierman)█ Overview
Bollinger Bands Forecast with Signals (Zeiierman) extends classic Bollinger Bands into a forward-looking framework. Instead of only showing where volatility has been, it projects where the basis (midline) and band width are likely to drift next, based on recent trend and volatility behavior.
The projection is built from the measured slopes of the Bollinger basis, the standard deviation (or ATR, depending on the mode), and a volatility “breathing” component. On top of that, the script includes an optional projected price path that can be blended with a deterministic random walk, plus rejection signals to highlight failed band breaks.
█ How It Works
⚪ Bollinger Core
The script first computes standard Bollinger Bands using the selected Source, Length, and Multiplier:
Basis = SMA(Source, Length)
Band width = Multiplier × StDev(Source, Length)
Upper/Lower = Basis ± Width
This remains the “live” (non-forecast) structure on the chart.
⚪ Trend & Volatility Slope Estimation
To project forward, the indicator measures directional drift and volatility drift using linear regression differences:
Basis slope from the Bollinger basis
StDev slope from the Bollinger deviation
ATR slope for ATR-based projection mode
These slopes drive the forecast bands forward, reflecting the market’s recent directional and volatility regime.
⚪ Projection Engine (Forecast Bands)
At the last bar, the indicator draws projected basis, upper, and lower lines out to Forecast Bars. The projected basis can be:
Trend (straight linear projection)
Curved (ease-in/out transition toward projected endpoints)
Smoothed (extra smoothing on projected basis/width)
⚪ Price Path Projection + Optional Random Walk
In addition to projecting the bands, the script can draw a price forecast path made of a small number of zigzag swings.
Each swing targets a point offset from the projected basis by a multiple of the projected half-width (“width units”).
Decay gradually reduces swing size as the forecast deepens.
The Optional Random Walk Blend adds a deterministic drift component to the zigzag path. It’s not true randomness; it’s a stable pseudo-random sequence, so the drawing doesn’t jump around on refresh, while still adding “natural” variation.
⚪ Rejection Signals
Signals are based on failed attempts to break a band:
Bear Signal (Down): price tries to push above the upper band, then falls back inside, while still closing above the basis.
Bull Signal (Up): price tries to push below the lower band, then returns back inside, while still closing below the basis.
█ How to Use
⚪ Forward Support/Resistance Corridors
Treat the projected upper/lower bands as a future volatility envelope, not a guarantee:
The upper projection ≈ is likely a resistance level if the regime persists
The lower projection ≈ is likely a support level if the regime persists
Best used for trade planning, targets, and “where price could travel” under similar conditions.
⚪ Regime Read: Trend + Volatility
The projection shape is informative:
Rising basis + expanding width → trend with increasing volatility (needs wider stops / more caution)
Flat basis + compressing width → contraction regime (often precedes expansion)
⚪ Signals for Mean-Reversion / Failed Breakouts
The rejection markers are useful for fade-style setups:
A Down signal near/after upper-band failure can imply rotation back toward the basis.
An Up signal near/after lower-band failure can imply snap-back toward the basis.
With MA filtering enabled, signals are constrained to align with the broader bias, helping reduce chop-driven noise.
█ Related Publications
Donchian Predictive Channel (Zeiierman)
█ Settings
⚪ Bollinger Band
Controls the live Bollinger Bands on the chart.
Source – Price used for calculations.
Length – Lookback period; higher = smoother, lower = more reactive.
Multiplier – Bandwidth; higher = wider bands, lower = tighter bands.
⚪ Forecast
Controls the forward projection of the Bollinger Bands.
Forecast Bars – How far into the future the bands are projected.
Trend Length – Lookback used to estimate trend and volatility slopes.
Forecast Band Mode – Defines projection behavior (linear, curved, breathing, ATR-based, or smoothed).
⚪ Price Forecast
Controls the projected price path inside the bands.
ZigZag Swings – Number of projected oscillations.
Amplitude – Distance from basis, measured in bandwidth units.
Decay – Shrinks swings further into the forecast.
⚪ Random-Walk
Adds controlled randomness to the price path.
Enable – Toggle random-walk influence.
Blend – Strength of randomness vs. zigzag.
Step Size – Size of random steps (band-width units).
Decay – Reduces randomness as the forecast deepens.
Seed – Changes the (stable) random sequence.
⚪ Signals
Controls rejection/mean-reversion signals.
Show Signals – Enable/disable signal markers.
MA Filter (Type/Length) – Filters signals by trend direction.
-----------------
Disclaimer
The content provided in my scripts, indicators, ideas, algorithms, and systems is for educational and informational purposes only. It does not constitute financial advice, investment recommendations, or a solicitation to buy or sell any financial instruments. I will not accept liability for any loss or damage, including without limitation any loss of profit, which may arise directly or indirectly from the use of or reliance on such information.
All investments involve risk, and the past performance of a security, industry, sector, market, financial product, trading strategy, backtest, or individual's trading does not guarantee future results or returns. Investors are fully responsible for any investment decisions they make. Such decisions should be based solely on an evaluation of their financial circumstances, investment objectives, risk tolerance, and liquidity needs.

ADX Volatility Waves [BOSWaves]ADX Volatility Waves - Trend-Weighted Volatility Mapping with State-Based Wave Transitions
Overview
ADX Volatility Waves is a regime-aware volatility framework designed to map statistically significant price extremes through adaptive wave structures driven by trend strength.
Rather than treating volatility as a static dispersion metric, this indicator conditions all volatility expansion, contraction, and zone placement on ADX-derived trend intensity. Price behavior is interpreted through wave-like transitions between balance, expansion, and exhaustion states rather than isolated band interactions.
The result is a dynamic, gradient-based wave system that visually encodes volatility cycles and regime shifts in real time, allowing traders to contextualize price movement within trend-weighted volatility waves.
Price is evaluated not by static thresholds, but by its position and progression within adaptive volatility waves shaped by directional strength.
Conceptual Framework
ADX Volatility Waves is built on the premise that volatility unfolds in waves, not straight lines.
Traditional volatility tools identify dispersion but fail to account for how volatility behaves differently across trend regimes. By embedding ADX directly into volatility construction, this indicator ensures that volatility waves expand during strong directional phases and compress during weak or transitioning regimes.
Three guiding principles define the framework:
Volatility must be conditioned on trend strength
Extremes occur within zones, not at lines
Signals should emerge from completed wave transitions, not instantaneous touches
This reframes analysis from reactive mean-reversion toward regime-aware wave interpretation.
Theoretical Foundation
The indicator fuses directional movement theory with statistical volatility modeling.
Bollinger-derived dispersion provides the structural base, while ADX normalization controls the amplitude of volatility waves. As ADX increases, volatility waves widen and deepen; as ADX weakens, waves compress and tighten around equilibrium.
From this foundation, extended upper and lower wave zones are constructed and smoothed to represent statistically significant expansion and contraction phases.
At its core are three interacting systems:
ADX-Controlled Volatility Engine : Standard deviation is dynamically scaled using normalized ADX values, producing trend-weighted volatility waves.
Wave Zone Construction : Smoothed volatility boundaries are offset and expanded to form upper and lower wave zones, defining overextension and compression regions.
State-Based Wave Transition Logic : Signals occur only after price completes a full wave cycle: expansion into an extreme wave zone followed by a confirmed return to equilibrium.
This structure ensures that signals reflect completed volatility waves, not transient noise.
How It Works
ADX Volatility Waves processes price action through layered wave mechanics:
Trend-Weighted Volatility Calculation : Volatility boundaries are dynamically adjusted using ADX influence, allowing wave amplitude to scale with trend strength.
Structural Smoothing : Volatility boundaries are smoothed to stabilize wave geometry and reduce short-term distortions.
Wave Offset & Expansion : Upper and lower wave zones are positioned beyond equilibrium and expanded proportionally to volatility range, forming clearly defined expansion waves.
Gradient Wave Depth Mapping : Each wave zone is subdivided into multiple gradient layers, visually encoding increasing extremity as price moves deeper into a wave.
Wave State Tracking & Cooldown Control : The system tracks prior wave occupancy, enforces neutral stabilization periods, and applies cooldowns to prevent overlapping wave signals.
Compression Detection : Volatility width monitoring identifies compression phases, highlighting conditions where new volatility waves are likely to form.
Together, these processes create a continuous, adaptive wave map of volatility behavior.
Interpretation
ADX Volatility Waves reframes market reading around volatility cycles:
Upper Volatility Waves (Red Gradient) : Represent upside expansion phases. Deeper wave penetration indicates increased overextension relative to trend-adjusted volatility.
Lower Volatility Waves (Green Gradient) : Represent downside expansion phases. Sustained presence signals pressure, while exits toward balance suggest wave completion.
Equilibrium Zone : The neutral region between volatility waves. Confirmed re-entry into this zone marks the completion of a wave cycle and forms the basis for BUY and SELL signals.
Regime Context via ADX : Strong ADX regimes widen waves, reducing premature reversal signals. Weak ADX regimes compress waves, increasing sensitivity to reversion.
Wave progression and completion matter more than single-bar interactions.
Signal Logic & Visual Cues
ADX Volatility Waves produces single-entry BUY and SELL labels as its visual cues, plotted only when price first enters a volatility wave zone after the defined cooldown period.
Buy Signal (Bottom Zone Entry) : A BUY label appears when price enters the lower volatility wave (oversold zone). This highlights potential expansion into undervalued extremes, providing visual context for trend assessment rather than a guaranteed execution trigger.
Sell Signal (Top Zone Entry) : A SELL label appears when price enters the upper volatility wave (overbought zone). This marks potential overextension into upper volatility extremes, serving as a contextual indicator of trend stress.
All labels respect cooldown tracking to prevent clustering. Alerts are tied directly to these zone-entry signals, and a separate alert monitors volatility squeezes for awareness of compression periods.
Strategy Integration
ADX Volatility Waves integrates cleanly into volatility-aware trading frameworks:
Wave Context Mapping : Use wave depth to assess expansion and exhaustion risk rather than forcing immediate entries.
Transition-Based Execution : Prioritize BUY and SELL signals formed after confirmed wave completion.
Trend-Regime Filtering : In strong ADX regimes, treat waves as continuation pressure. In weak regimes, favor completed wave reversions.
Volatility Cycle Awareness : Monitor compression phases to anticipate the emergence of new volatility waves.
Multi-Timeframe Alignment : Apply higher-timeframe ADX regimes to contextualize lower-timeframe wave behavior.
Technical Implementation Details
Core Engine : ADX-normalized volatility expansion
Wave System : Smoothed, offset, expanded volatility waves
Visualization : Multi-layer gradient wave zones
Signal Logic : State-based wave transitions with cooldown enforcement
Alerts : Wave entry, wave completion, volatility compression
Performance Profile : Lightweight, real-time optimized overlay
Optimal Application Parameters
Timeframe Guidance:
1 - 5 min : Short-term volatility waves and intraday transitions
15 - 60 min : Structured intraday wave cycles
4H - Daily : Macro volatility regimes and expansion phases
Suggested Baseline Configuration:
BB Length : 20
BB StdDev : 1.5
ADX Length : 14
ADX Influence : 0.8
Wave Offset : 1.0
Wave Width : 1.0
Neutral Confirmation : 5 bars
These suggested parameters should be used as a baseline; their effectiveness depends on the asset volatility, liquidity, and preferred entry frequency, so fine-tuning is expected for optimal performance.
Performance Characteristics
High Effectiveness:
Markets exhibiting rhythmic volatility expansion and contraction
Assets with responsive ADX regime behavior
Reduced Effectiveness:
Erratic, news-driven price action
Illiquid markets with distorted volatility metrics
Integration Guidelines
Confluence : Combine with BOSWaves structure or trend tools
Discipline : Respect wave completion and cooldown logic
Risk Framing : Interpret wave depth probabilistically, not predictively
Regime Awareness : Always contextualize waves within ADX strength
Disclaimer
ADX Volatility Waves is a professional-grade volatility and regime-mapping tool. It does not predict price and does not guarantee profitability. Performance depends on market conditions, parameter calibration, and disciplined execution. BOSWaves recommends using this indicator as part of a comprehensive analytical framework incorporating trend, volatility, and structural context.

"Clean Market Structure & Trend Confirmation" Clean Market Structure & Trend Confirmation is a high-probability Market Structure and Trend Confirmation indicator trading system designed specifically for SPY and QQQ.
It combines trend structure, multi-timeframe confirmation, momentum gating, and market-state filtering to deliver clean, disciplined BUY and SELL signals — without noise, chop, or over-trading.
This script is built for traders who want clarity first, execution second.

Probability-Based Adaptive Detection🙏🏻 PBAD (Probability-Based Adaptive Detection) : adaptive control tool for outliers || novelty detection, made for worst case data & processes, for the highest time complexity O(n^2) compared with the alternatives (would be explained in a sec). Thresholds are completely data driven and axiomatic, no need in provided hyperparameters, are not learned or optimized. The method accepts multiple weights, e.g. both temporal and volatility weights.
Method briefly explained (I can go deeper if any1 asks explicitly):
Performs weighted KDE on initial input data, finds KDE global maximum (mode), creates new “residuals” dataset by centering initial data around this value;
Performs weighted KDE on residuals, uses sigmoid based probability mass targets with increasing probability coverage to construct a set of non-disjoint High Density Intervals (also called HDR, HPD in Bayesian terms);
Uses these intervals to calculate analogs of centralized & standardized moments;
Uses these ^^ moments to construct a set of control thresholds. The scheme used in PBAD is not only based on a central threshold, or on neighboring ones, it utilizes all previous thresholds, gaining more information.
...
The most important part is to understand whether you really need PBAD. Because even tho it seems to be the best one given highest algocomplexity, irl it would work worse in cases when it’s not required by your data.
Here’s the menu (aka taxonomy omg) of methods you can use that would let you make the right choice:
Moment-Based Adaptive Detection (MBAD) :
Norm: L2
Time complexity: original O(n), successfully reduced to O(1) in online version
Use case: default, general purpose
Based on: method of moments (powers of residuals from mean)
Thresholds architecture: centralized
Quantile-Based Adaptive Detection (QBAD):
Norm: L1
Time complexity: O(nlogn)
Use case: either bad data Or process instability
Based on: quantile moments (dyadic percentiles of residuals from median)
Thresholds architecture: chained/recursive/sequential
Probability-Based Adaptive Detection (PBAD):
Norm: L0
Time complexity: O(n^2)
Use case: both bad data And process instability
Based on: probability moments (target probability masses of residuals from KDE mode)
Thresholds architecture: decentralized (for lack of a better name xd, the idea is that these thresholds gain information from the all other threshold and are Not exclusively based on the central or neighboring thresholds)
...
Examples of true use cases:
^^ an appropriate financial instrument to use PBAD
^^ and another one
...
Additional details about how to use it:
Keep the student5 kernel, it’s the best you can do. I added others mostly for comparisons and if you want to use the tool Not for its primary purpose (on a fine data)
“Calculate for N bars” and “Starting at bar N” options allow to reduce calculation period only on the N number of last bars or next bars from a chosen one. It's vital, because calculations here are heavy
Keep plotting offset at 1 (allows to visually compare current bar with the previous threshold values). This is the way it should be done on price data.
HLC3 is the optimal source input, unless you want to use your own better one point estimate of each datapoint (in the best case done by using PBAD itself on OHLC+ values).
In essence it should be used just like MBAD or QBAD, fade/push extensions and limit, fade/push/skip deviations & basis, or other strategies of your. Again, the only reason for 3 methods to exist is to be chosen for according data characteristics.
Btw:
This is the initial version, I don’t consider it perfected tbh, even tho it works as expected, however this method is very situational anyways.
In this script KDE function is modified to ensure the outcoming probabilities Do sum up to 1. I didn’t do this normalization in Weighted KDE Mode script , but there it’s not required since we just need a KDE global max.
see ya
∞

rj_temu_pair_tradea simple "temu" implementation of a pair trade
see robotjames.substack.com for details.

Varun's StrategyBuy and Sell strategy designed for a 1 minute chart to buy when RSI drops under 25 and sell when RSI exceeds 75

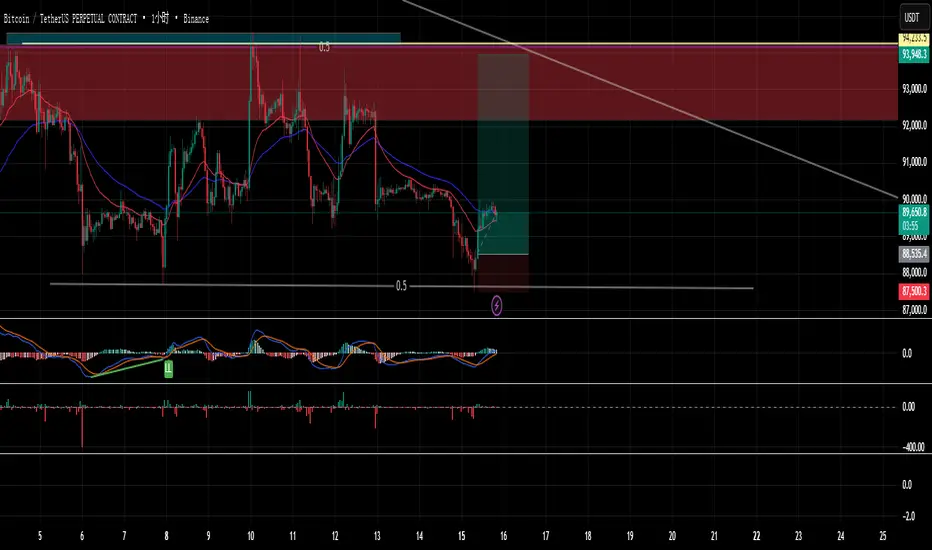
premium//@version=5
indicator("Custom Binance Premium Index + Alerts", overlay=false)
// === 1. 数据源(可修改) ===
// 永续合约价格(默认 BTCUSDT 永续)
futures = request.security("BINANCE:BTCUSDT_PERP", timeframe.period, close)
// 现货价格(默认 BTCUSDT 现货)
spot = request.security("BINANCE:BTCUSDT", timeframe.period, close)
// === 2. 计算自定义溢价指数 ===
premium = ((futures / spot) - 1) * 100
// === 3. 用户设定阈值(你给的值) ===
upper = 1.5 // 溢价 ≥ 1.5 触发告警
lower = -2.0 // 溢价 ≤ -2.0 触发告警
// === 4. 绘图 ===
plot(premium, title="Premium Index (%)", color=color.new(color.blue, 0))
hline(upper, "Upper Threshold (1.5%)", color=color.new(color.red, 0))
hline(lower, "Lower Threshold (-2.0%)", color=color.new(color.green, 0))
// === 5. 告警条件 ===
alertcondition(premium >= upper,
title="溢价 ≥ 1.5%",
message="Premium Index ≥ 1.5%(永续合约偏高,多头较强)"
)
alertcondition(premium <= lower,
title="溢价 ≤ -2.0%",
message="Premium Index ≤ -2.0%(永续合约偏低,空头压力大)"
)
// === 6. 信息显示 ===
label.new(bar_index, premium, "Premium: " + str.tostring(premium, "#.##") + "%",
style=label.style_label_left, color=color.new(color.blue, 85))
NQ bands 50/65.5/100this is a indicator that puts lines 50 points above and below price, 65.5 points above and below price and 100 points above and below price for the Nasdaq Futures.

Volume MAs Oscillator | Lyro RS// This Pine Script® code is subject to the terms of the Mozilla Public License 2.0 at mozilla.org
// © LyroRS
//@version=6
indicator("Volume MAs Oscillator | Lyro RS")
import LyroRS/LMAs/1 as DynamicMAs
//─────────────────────────────────────────────────────────────────────────────────────────────────────────────
//─██████─────────████████──████████─████████████████───██████████████───────████████████████───██████████████─
//─██░░██─────────██░░░░██──██░░░░██─██░░░░░░░░░░░░██───██░░░░░░░░░░██───────██░░░░░░░░░░░░██───██░░░░░░░░░░██─
//─██░░██─────────████░░██──██░░████─██░░████████░░██───██░░██████░░██───────██░░████████░░██───██░░██████████─
//─██░░██───────────██░░░░██░░░░██───██░░██────██░░██───██░░██──██░░██───────██░░██────██░░██───██░░██─────────
//─██░░██───────────████░░░░░░████───██░░████████░░██───██░░██──██░░██───────██░░████████░░██───██░░██████████─
//─██░░██─────────────████░░████─────██░░░░░░░░░░░░██───██░░██──██░░██───────██░░░░░░░░░░░░██───██░░░░░░░░░░██─
//─██░░██───────────────██░░██───────██░░██████░░████───██░░██──██░░██───────██░░██████░░████───██████████░░██─
//─██░░██───────────────██░░██───────██░░██──██░░██─────██░░██──██░░██───────██░░██──██░░██─────────────██░░██─
//─██░░██████████───────██░░██───────██░░██──██░░██████─██░░██████░░██───────██░░██──██░░██████─██████████░░██─
//─██░░░░░░░░░░██───────██░░██───────██░░██──██░░░░░░██─██░░░░░░░░░░██───────██░░██──██░░░░░░██─██░░░░░░░░░░██─
//─██████████████───────██████───────██████──██████████─██████████████───────██████──██████████─██████████████─
//─────────────────────────────────────────────────────────────────────────────────────────────────────────────
// LyroRS v1.0
// Groups
ma_g = "𝗠𝗢𝗩𝗜𝗡𝗚 𝗔𝗩𝗘𝗥𝗔𝗚𝗘"
bands_g = "𝗕𝗔𝗡𝗗"
display_g = '𝗗𝗜𝗦𝗣𝗟𝗔𝗬'
// Inputs
// -- Moving Average
source = input.source(close, "Source", group= ma_g, tooltip= "Select where the data originates (open, high, low, close, etc..).")
ma_type = input.string("EMA", "Select Moving Average", options= , group=ma_g, tooltip="Choose a moving average type to apply to the price multiplied by volume. VWMA already incorporates volume directly.")
ma_length = input.int(30, "Moving Average Length", group= ma_g, tooltip= "Defines the length or period of the selected moving average.")
// -- Bands
band_length = input.int(27, "Band Length", group=bands_g, tooltip="Number of bars used to calculate standard deviation.")
band_smoothing = input.float(0.8, "Band Smoothing", group=bands_g, minval=0, tooltip="Smooths the band edges to reduce noise.")
pbm = input.float(1.8, "Positive Band Multiplier", group=bands_g, minval=0, tooltip="Multiplier for the upper band distance.")
nbm = input.float(-0.85, "Negative Band Multiplier", group=bands_g, maxval=0, tooltip="Multiplier for the lower band distance.")
// Color Inputs
signal_type = input.string("Trend", "Select Signal Type", options= , group=display_g, tooltip="Select which way to use the indicator.")
ColMode = input.string("Mystic", "Custom Color Palette", inline="drop", options= , display=display.none, group= display_g, tooltip="Select a predefined color scheme for the indicator display. (Major Themes color mode automatically switches colors based on the major asset you picked for valuation analysis.)")
cpyn = input.bool (true, "Use Custom Palette", group= display_g, display=display.none, tooltip="Enables custom color selection for signals.")
cp_UpC = input.color (#00ff00, "Custom Up", inline = "Custom Palette", group= display_g, display=display.none, tooltip="")
cp_DnC = input.color (#ff0000, "Custom Down", inline = "Custom Palette", group= display_g, display=display.none, tooltip="User specifed bullish and bearish colors.")
d_obos_sigs = input.bool (true, "Display Oversold/Overbought Signs", group= display_g, display=display.none, tooltip="Enables triangle signs to be displayed.")
d_signs = input.bool (true, "Display Signs", group= display_g, display=display.none, tooltip="Enables signs for Trend mode.")
d_bgcol = input.bool (true, "Display Background Color", group= display_g, display=display.none, tooltip="Enables background color for Reversion & Valuation mode.")
// Colors
color UpC = na
color DnC = na
// -- Predefined Colors
switch ColMode
"Classic" =>
UpC := #00E676
DnC := #880E4F
"Mystic" =>
UpC := #30FDCF
DnC := #E117B7
"Accented" =>
UpC := #9618F7
DnC := #FF0078
"Royal" =>
UpC := #FFC107
DnC := #673AB7
// -- Custom Colors
if cpyn
UpC := cp_UpC
DnC := cp_DnC
// Coloring Function for Valuation
coloring(src) =>
color.from_gradient(src, ta.lowest(src, band_length), ta.highest(src, band_length), UpC, DnC)
// Moving Average Switch
float ma = na
switch ma_type
"SMA" => ma := DynamicMAs.SMA(source * volume, ma_length) / DynamicMAs.SMA(volume, ma_length)
"EMA" => ma := DynamicMAs.EMA(source * volume, ma_length) / DynamicMAs.EMA(volume, ma_length)
"WMA" => ma := DynamicMAs.WMA(source * volume, ma_length) / DynamicMAs.WMA(volume, ma_length)
"VWMA" => ma := DynamicMAs.VWMA(source, volume, ma_length) // Already Volume Based MA
"DEMA" => ma := DynamicMAs.DEMA(source * volume, ma_length) / DynamicMAs.DEMA(volume, ma_length)
"TEMA" => ma := DynamicMAs.TEMA(source * volume, ma_length) / DynamicMAs.TEMA(volume, ma_length)
"RMA" => ma := DynamicMAs.RMA(source * volume, ma_length) / DynamicMAs.RMA(volume, ma_length)
"HMA" => ma := DynamicMAs.HMA(source * volume, ma_length) / DynamicMAs.HMA(volume, ma_length)
"LSMA" => ma := DynamicMAs.LSMA(source * volume, ma_length, 0) / DynamicMAs.LSMA(volume, ma_length, 0)
"SMMA" => ma := DynamicMAs.SMMA(source * volume, ma_length) / DynamicMAs.SMMA(volume, ma_length)
"ALMA" => ma := DynamicMAs.ALMA(source * volume, ma_length, 0, 20) / DynamicMAs.ALMA(volume, ma_length, 0, 20)
"ZLSMA" => ma := DynamicMAs.ZLSMA(source * volume, ma_length) / DynamicMAs.ZLSMA(volume, ma_length)
"FRAMA" => ma := DynamicMAs.FRAMA(source * volume, ma_length) / DynamicMAs.FRAMA(volume, ma_length)
"KAMA" => ma := DynamicMAs.KAMA(source * volume, ma_length) / DynamicMAs.KAMA(volume, ma_length)
"JMA" => ma := DynamicMAs.JMA(source * volume, ma_length, 0) / DynamicMAs.JMA(volume, ma_length, 0)
"T3" => ma := DynamicMAs.T3(source * volume, ma_length, 0.5) / DynamicMAs.T3(volume, ma_length, 0.5)
price_diff = ((source - ma) / ma) * 100 // Percentage Difference between Source and the Moving Average of the source
// Calculations for the Bands
std = ta.stdev(price_diff, band_length)
upperBandRaw = std * pbm
lowerBandRaw = std * nbm
var float upperBand = na
var float lowerBand = na
// Smooth
upperBand := upperBandRaw * band_smoothing + nz(upperBand ) * (1 - band_smoothing)
lowerBand := lowerBandRaw * band_smoothing + nz(lowerBand ) * (1 - band_smoothing)
// Plot Color
var color pc = na
var color uB_color = na
var color lB_color = na
var int signal = 0
if signal_type == "Trend"
uB_color := UpC
lB_color := DnC
if price_diff > upperBand
pc := UpC
signal := 1
if price_diff < lowerBand
pc := DnC
signal := -1
if signal_type == "Reversion"
uB_color := DnC
lB_color := UpC
if price_diff > upperBand
pc := DnC
signal := -1
else if price_diff < lowerBand
pc := UpC
signal := 1
else
pc := color.gray
signal := 0
if signal_type == "Valuation"
uB_color := UpC
lB_color := DnC
pc := coloring(price_diff)
// Plot
plot(price_diff, color= pc, linewidth = 2, title= "Volume MAs Oscillator")
plot(upperBand, color= color.new(uB_color, 50), title= "Upper Band")
plot(lowerBand, color= color.new(lB_color, 50), title= "Lower Band")
plot(0, color= color.new(pc, 60), linewidth = 2, display= display.pane, title= "Mid Line")
plot(0, color= color.new(pc, 75), linewidth = 5, display= display.pane, title= "Mid Line Glow 1")
plot(0, color= color.new(pc, 85), linewidth = 10, display= display.pane, title= "Mid Line Glow 2")
plotchar(upperBand + 0.5, char='▼', color= ta.crossunder(price_diff, upperBand) ? DnC : na, location=location.absolute, title= "Overbought Signal", display= d_obos_sigs ? display.pane : display.none, size= size.tiny)
plotchar(lowerBand - 0.5, char='▲', color= ta.crossover(price_diff, lowerBand) ? UpC : na, location=location.absolute, title= "Oversold Signal", display= d_obos_sigs ? display.pane : display.none, size= size.tiny)
reversion_enable = signal_type == "Reversion"
valuation_enable = signal_type == "Valuation"
bgcolor(d_bgcol and ((valuation_enable and price_diff > upperBand) or (reversion_enable and ta.crossunder(price_diff, upperBand))) ? color.new(DnC, 85) : na, title= "BG Color OB")
bgcolor(d_bgcol and ((valuation_enable and price_diff > upperBand) or (reversion_enable and ta.crossunder(price_diff, upperBand))) ? color.new(DnC, 85) : na, title= "BG Color OB Overlay", force_overlay = true)
bgcolor(d_bgcol and ((valuation_enable and price_diff < lowerBand) or (reversion_enable and ta.crossover(price_diff, lowerBand))) ? color.new(UpC, 85) : na, title= "BG Color OS")
bgcolor(d_bgcol and ((valuation_enable and price_diff < lowerBand) or (reversion_enable and ta.crossover(price_diff, lowerBand))) ? color.new(UpC, 85) : na, title= "BG Color OS Overlay", force_overlay = true)
plotshape(ta.crossover(signal, 0), title="Buy Signal", location=location.belowbar,
style=shape.labelup, text="𝓛𝓸𝓷𝓰", textcolor=#000000, size=size.small,
color=UpC, force_overlay=true, display= signal_type == "Trend" and d_signs == true ? display.pane : display.none)
plotshape(ta.crossunder(signal, 0), title="Sell Signal", location=location.abovebar,
style=shape.labeldown, text="𝓢𝓱𝓸𝓻𝓽", textcolor=#000000, size=size.small,
color=DnC, force_overlay=true, display= signal_type == "Trend" and d_signs == true ? display.pane : display.none)
plotcandle(open, high, low, close, color= pc, wickcolor = pc, bordercolor = pc, force_overlay = true, display= display.pane, title= "Plot Candle")
barcolor(pc, title= "Barcolor")
// ==========================================================================================
// === Dashboard with Telegram Link ===
var table myTable = table.new(position.top_center, 1, 1, border_width=1, frame_color=color.black, bgcolor=color.white)
// Add Telegram Message to Dashboard
table.cell(myTable, 0, 0, "Join Telegram @mrexpert_ai", bgcolor=color.blue, text_color=color.white, text_size=size.normal)

COIN-Clean Market Structure & Trend Confirmation TP(Updated)COIN-Clean Market Structure & Trend Confirmation TP(Updated) — COIN (Simple Trend + Buy/Sell Confirmation + Take-Profit Targets)
This indicator is designed to help you trade COIN by clearly showing trend direction, confirmation signals, and predefined take-profit levels. It removes guesswork and helps you stay on the right side of the move.
HOW TO LOAD
Add the indicator to a COIN chart. Turn on Extended Hours for best results. The default settings are already optimized and do not need to be changed.
THE RIBBON (WHAT TO TRADE)
The ribbon shows the overall trend.
Teal ribbon = price is trending up (look for BUY setups).
Red ribbon = price is trending down (look for SELL setups).
Gray ribbon = no clear trend (do not trade).
If the ribbon is gray, the indicator will block signals to protect you from choppy markets.
BULL AND BEAR DOTS (TREND CHANGE ALERTS)
Bull dot appears when the trend turns bullish.
Bear dot appears when the trend turns bearish.
These dots are early warnings, not entries. Always wait for a BUY or SELL arrow before taking a trade.
BUY AND SELL ARROWS (WHEN TO ENTER)
BUY arrows appear only when conditions strongly favor upward movement.
SELL arrows appear only when conditions strongly favor downward movement.
These arrows are confirmation signals. Enter only after the arrow appears.
Not every move will get a signal. Fewer, higher-quality signals are intentional.
OPENING BIAS (FIRST MINUTES PROTECTION)
Right after the market opens, the indicator sets a directional bias.
During this time, it will only allow trades in the safer direction.
This helps avoid getting chopped up during the opening volatility.
TAKE-PROFIT TARGETS AND STOP
When a BUY or SELL arrow appears, take-profit levels automatically show on the chart:
TP1, TP2, and TP3 are profit targets.
STOP is where the trade is considered wrong.
You can scale out at each target or exit fully at any level.
Only the most recent targets are shown to keep the chart clean.
SIMPLE WAY TO USE IT
Check the ribbon color (teal or red).
Ignore the chart if the ribbon is gray.
Wait for a BUY or SELL arrow.
Use the take-profit targets and stop provided.
Do not chase moves without arrows.
IMPORTANT NOTES
This indicator does not repaint confirmed signals.
It is meant to keep trading simple and disciplined.
It works best during strong trend days, not sideways markets.

Advance SMC (Milad Tayefi)Smart money indicator which recognizes market structure and produces buy/sell signals.

FX Session High/Low Bands - Last 5 EST Days
FX Session High/Low Bands - Last 5 Days
Description:
This indicator plots horizontal bands representing the high and low price levels from the major forex trading sessions over the last 5 days. It helps traders identify key support and resistance zones based on recent session activity.
Features:
Multiple Session Tracking: Displays high/low levels for major FX sessions:
Asian Session (Tokyo)
European Session (London)
US Session (New York)
5-Day Lookback: Captures the highest high and lowest low from each session over the previous 5 trading days
Visual Bands: Clear horizontal lines or filled zones showing session boundaries
Dynamic Updates: Automatically recalculates as new session data becomes available
How to Use:
Support/Resistance: Previous session highs/lows often act as key price levels
Breakout Trading: Watch for price breaking above/below session bands
Range Trading: Trade within the bands during consolidation periods
Session Overlap: Pay attention to multiple session bands converging
Ideal For:
Forex day traders
Session-based trading strategies
Support/resistance identification
Multi-timeframe analysis

"Clean Market Structure & Trend Confirmation" TP LADDER(UPDATED)Clean Market Structure & Trend Confirmation — TP Ladder
This indicator is designed to identify high-probability intraday trend trades using market structure, momentum confirmation, and a visual ribbon system, with automatic take-profit and stop-loss levels plotted after confirmed signals.
WHAT THIS INDICATOR IS FOR
This script is built for active intraday traders trading SPY, QQQ, It focuses on trend continuation and directional momentum rather than scalping chop. It works best during regular market hours with extended hours enabled.
HOW TO LOAD (IMPORTANT)
Add the script to your chart
Set chart timeframe to 5-minute
Turn Extended Trading Hours ON
Use during the NY session (especially open and trend periods)
THE RIBBON (MOST IMPORTANT RULE)
The ribbon defines the trend.
• Blue/Teal ribbon = bullish trend
• Red ribbon = bearish trend
• Gray ribbon = compression / no trade zone
Only trade in the direction of the ribbon.
No ribbon alignment = no trade.
BULL & BEAR DOTS
“BULL” dot appears when structure flips bullish.
“BEAR” dot appears when structure flips bearish.
These confirm trend direction, not entries by themselves.
BUY & SELL ARROWS (ENTRIES)
• BUY arrow prints only when bullish ribbon, structure, momentum, and filters align
• SELL arrow prints only when bearish ribbon, structure, momentum, and filters align
• Arrows are non-repainting when using close-confirmed mode
No arrow = no trade.
CONTINUATION (C) LOGIC
The script allows limited continuation entries after pullbacks when structure realigns.
By default, only one continuation per direction per day is allowed to prevent overtrading and signal spam.
TAKE-PROFIT (TP) LADDER
When a BUY or SELL arrow confirms, the script automatically plots:
• TP1 = partial profit
• TP2 = extended target
• TP3 = final extension
• STOP = ATR-based stop loss
All levels are calculated using ATR and adjust automatically to volatility.
The ladder only appears after a confirmed signal.
HOW TO TRADE IT (SIMPLE FLOW)
Identify ribbon direction
Wait for BUY or SELL arrow
Enter on confirmation
Scale out at TP1, TP2, TP3
Respect the STOP line
If structure breaks or ribbon flips, exit.
WHAT TO AVOID
• Do not trade against the ribbon
• Do not trade in gray ribbon conditions
• Do not chase candles without arrows
• Do not expect constant signals (quality over quantity)

Selected Days Indicator V3-TrDoes the stock drop every Wednesday? Do March months always move similarly? Does the 1st week of the month behave differently?
Do you ever say "it always makes this move in these months"? Don't you want to see more clearly whether it actually makes this move or not? Don't you want to see and test periodically repeating price patterns?
Hisse her Çarşamba düşüyor mu? Mart ayları hep benzer mi hareket ediyor? Ayın 1. haftası farklı mı davranıyor?
Bazen "bu aylarda hep bu hareketi yapıyor" dediğiniz oluyor mu? Gerçekten de bu hareketi yapıp yapmadığını daha net görmek istemez misiniz? Periyodik tekrarlayan fiyat kalıplarını görmek ve test etmek istemiyor musunuz?
1. Problem
Some stocks or crypto assets exhibit systematic behaviors on certain days, weeks, or months. But it's hard to see - everything is mixed together on the chart. This indicator isolates the days/weeks/months you want and shows only them. Hides everything else.
2. How It Works
Three-layer filter: Day (Monday, Tuesday...), Week (1st, 2nd, 3rd week of the month), Month (January, February...). Select what you want, let the rest disappear. Example: Show only Thursdays of March-June-September. Or compare every 1st week of the month. View as candlestick, line, or column chart.
3. What's It Good For?
Test "end-of-month effect". Find "day-of-the-week anomaly". Analyze crypto volatility by days. See seasonality in commodities. Discover patterns specific to your own strategy. Past data doesn't guarantee the future but provides statistical advantage.

Daily & Pre-Market Key Levels (v5)Plots:
- Today's high/low
- Pre-market High/Low
- Yesterday's high/low/close
- Day before yesterday high/low

Market + Direction + Entry + Hold + Exit v1.5 FINALOverview
This script is a complete trend-based trading framework designed to filter market conditions, determine directional bias, detect high-quality pullback entries, manage active trades, and identify trend-weakening exit points.
It is optimized for NQ futures, Gold (XAUUSD), and Bitcoin, with adaptive parameters for each asset.
The logic focuses on trading only when conditions are favorable, aligning entries with the primary trend, and avoiding low-probability setups.
1. Market Condition Filter
Before any signal appears, the script checks whether the market is active using three conditions:
ATR compared to ATR moving average (volatility condition)
Volume compared to average volume (liquidity condition)
Price distance from VWAP (suppression of mean-reversion environments)
A trade environment is considered active when at least two of these three conditions are positive.
2. Trend Direction Filter
Directional bias is defined by:
EMA21 relative to EMA55
Price relative to VWAP
Heikin-Ashi structure
When these conditions align, the script switches into long-only or short-only mode.
No counter-trend signals are displayed.
3. Entry Logic (L, L2, L3 and S, S2, S3)
The system identifies pullback entries within a confirmed trend.
Long entries require:
Uptrend confirmation
Price dipping toward EMA21 or EMA55
A constructive Heikin-Ashi candle
Market environment active
Short entries mirror the same structure in bearish conditions.
Re-entries (L2, L3, S2, S3) are given only if the trend remains intact after the first entry.
4. Hold Logic
A hold signal appears if momentum remains aligned with the trend.
Momentum is evaluated using the Stochastic indicator (K and D lines).
5. Exit Logic
An exit signal appears when:
The recent structural low (for longs) or high (for shorts) is broken, and
The EMA slope indicates weakening trend strength
This combination identifies high-probability trend exhaustion.
How to Use
Add the script to your chart.
Select an asset preset (NQ, GOLD, BTC).
Wait for the market to be active.
Follow the entry signals (L, L2, L3 or S, S2, S3).
Hold signals help confirm continuation.
Exit signals indicate potential trend reversal or weakness.
Feature Summary
Market environment filter
Trend direction filter
Pullback-based entry system
Multi-stage re-entry framework
Momentum-based hold signal
Structure-based exit
Asset-adaptive parameters
Clean chart visualization
Disclaimer
This script is for research and educational use.
It does not constitute financial advice.
Always backtest before using in live markets.
개요
이 스크립트는 시장 상태 필터링, 추세 방향 판단, 고품질 눌림목 진입, 보유 판단, 추세 약화 기반 청산까지 모두 포함하는 완전한 트레이딩 프레임워크입니다.
NQ, 골드(XAUUSD), 비트코인에 맞게 최적화되어 있습니다.
1. 시장 필터
다음 세 가지 중 두 가지 이상이 충족될 때만 매매 환경을 ‘활성’으로 판단합니다.
ATR 기준 변동성 체크
거래량 활성도 체크
가격의 VWAP 거리 체크
2. 방향(추세) 필터
다음 조건을 기반으로 상승·하락 추세를 결정합니다.
EMA21 vs EMA55
가격 vs VWAP
Heikin-Ashi 구조
이 조건이 일치할 때만 롱 전용 또는 숏 전용 모드로 진입합니다.
3. 진입 로직
추세가 유지되는 상태에서 EMA21 또는 EMA55까지 눌림이 나올 때
L 또는 S 신호를 제공합니다.
추세가 유지되면 L2/L3, S2/S3 재진입 신호가 추가로 발생합니다.
4. 보유(Hold)
모멘텀이 추세 방향과 일치할 때 보유 신호를 제공합니다.
5. 청산(Exit)
다음 두 조건이 동시에 나타날 때 청산 신호가 표시됩니다.
직전 구조(스윙)가 붕괴될 때
EMA 기울기가 약화될 때
사용 방법
차트에 스크립트를 추가합니다.
자산 프리셋(NQ, GOLD, BTC)을 선택합니다.
시장이 활성일 때만 신호를 참고합니다.
L/S 진입 신호와 보유/청산 신호를 활용해 매매 흐름을 관리합니다.

Rainbow MA Cloud█ OVERVIEW
Rainbow MA Cloud displays 8 Moving Averages as a gradient-colored cloud to visualize trend direction and strength. The "rainbow" effect shows momentum through ribbon width, while perfect MA alignment signals strong trending conditions.
█ CONCEPTS
The indicator uses 8 MAs with Fibonacci-based default lengths (8, 13, 21, 34, 55, 89, 144, 233) to create a layered view of price momentum across multiple timeframes.
Perfect Alignment Detection:
• Bullish Alignment — All 8 MAs in ascending order (MA1 > MA2 > ... > MA8)
Indicates strong uptrend with momentum across all timeframes
• Bearish Alignment — All 8 MAs in descending order (MA1 < MA2 < ... < MA8)
Indicates strong downtrend with aligned selling pressure
• Mixed — MAs are not in sequential order, suggesting consolidation or transition
Ribbon Width:
• Widening ribbon = Trend acceleration, increasing momentum
• Narrowing ribbon = Trend weakening, potential reversal or consolidation
█ FEATURES
1 — MA Configuration
Choose from EMA, SMA, WMA, VWMA, or HMA calculation methods.
All 8 MA lengths are fully customizable.
2 — Color Themes
Five built-in themes: Rainbow, Warm, Cool, Neon, Mono.
Creates visually distinct gradient from fast to slow MAs.
3 — Alignment Background
Green background during bullish alignment.
Red background during bearish alignment.
Helps quickly identify strong trending periods.
4 — Trend Signals
Labels appear when perfect alignment forms.
"BULL ALIGN" for bullish, "BEAR ALIGN" for bearish.
5 — Information Panel
Real-time display of alignment status, trend strength percentage,
ribbon width, price position relative to cloud, and MA values.
█ HOW TO USE
Entry Signals:
• Look for alignment signals (BULL/BEAR ALIGN) as trend confirmation
• Enter long when bullish alignment forms with price above cloud
• Enter short when bearish alignment forms with price below cloud
Trend Following:
• Stay in position while alignment background color persists
• Widening ribbon confirms trend continuation
• Exit or reduce when alignment breaks (background disappears)
Support/Resistance:
• Cloud edges act as dynamic support (bullish) or resistance (bearish)
• Price entering cloud suggests consolidation or potential reversal
█ LIMITATIONS
• Alignment signals are lagging by nature (based on MA crossovers)
• Works best on trending markets; generates mixed signals during ranging periods
• Ribbon width measurement uses outer MAs only (MA1 vs MA8)
█ COMPANION INDICATOR
Use "Rainbow MA Width" indicator for detailed Z-Score analysis of ribbon expansion/contraction patterns.

225 SMA CrossoverWell-known strategy from Zahlengraf from the Mauerstrassenwetten subreddit for you to test yourself.
You can change the length of the SMA and whether to trade long, short or both directions.

GS Volume Truth Serum (With Alerts)this tells you when institutions are behind a move and its not a bull trap


EMA 8 / 20 / 200Created to easily use the 8/20/200 strategy.
This indicator is designed to give a clear, multi-timeframe view of trend, momentum, and structure using three exponential moving averages.
1. Trend direction (EMA 200 – pink)
The 200 EMA acts as the long-term trend filter.
Price above the 200 EMA suggests a bullish market bias.
Price below the 200 EMA suggests a bearish market bias.
Many traders avoid taking trades against this higher-timeframe direction.
2. Momentum and trade bias (EMA 20 – blue)
The 20 EMA reflects short-term momentum.
When price respects the 20 EMA in an uptrend, pullbacks often provide continuation entries.
In downtrends, the 20 EMA frequently acts as dynamic resistance.
3. Entry timing (EMA 8 – yellow)
The 8 EMA is a fast reaction line used for precise timing.
Crosses of the 8 EMA over the 20 EMA can signal momentum shifts.
Strong trends often show price holding above (or below) the 8 EMA during impulse moves.
4. Confluence and trade filtering
The indicator works best when the EMAs are aligned:
Bullish alignment: EMA 8 > EMA 20 > EMA 200
Bearish alignment: EMA 8 < EMA 20 < EMA 200
Misaligned EMAs usually indicate consolidation or low-probability conditions.
5. Risk management context
EMAs can act as dynamic support and resistance:
Stops are often placed beyond the 20 EMA or 200 EMA depending on trade horizon.
Loss of EMA structure is a warning sign that the trend may be weakening.
In short, the indicator is a trend-first, momentum-second framework that helps you decide when to trade, in which direction, and when to stay out.
