Backtesting Stats (Altrady)Track and analyze your backtesting results directly on your chart.
This indicator simplifies manual backtesting by summarizing your trades in a clear, structured table. Enter your R-values (one per line) in the text area, and instantly see:
✅ Trade list – All entries displayed with color-coded wins/losses.
✅ Key stats – Total trades, win rate, and RR sum in the top row.
✅ Quick insights – Spot trends, refine your strategy, and track performance without spreadsheets.
How to Use
1️⃣ Open settings and enter R-values, one per line (e.g., 2.5, -1, 3.2) along with short comments (bad entry, counter trend, etc)
2️⃣ View the table in the top-right corner of your chart.
3️⃣ Analyze your results, adjust your strategy, and improve consistency.
Perfect for manual backtesters who want a fast, no-spreadsheet solution. 🚀
Backtest

*Auto Backtest & Optimize EngineFull-featured Engine for Automatic Backtesting and parameter optimization. Allows you to test millions of different combinations of stop-loss and take profit parameters, including on any connected indicators.
⭕️ Key Futures
Quickly identify the optimal parameters for your strategy.
Automatically generate and test thousands of parameter combinations.
A simple Genetic Algorithm for result selection.
Saves time on manual testing of multiple parameters.
Detailed analysis, sorting, filtering and statistics of results.
Detailed control panel with many tooltips.
Display of key metrics: Profit, Win Rate, etc..
Comprehensive Strategy Score calculation.
In-depth analysis of the performance of different types of stop-losses.
Possibility to use to calculate the best Stop-Take parameters for your position.
Ability to test your own functions and signals.
Customizable visualization of results.
Flexible Stop-Loss Settings:
• Auto ━ Allows you to test all types of Stop Losses at once(listed below).
• S.VOLATY ━ Static stop based on volatility (Fixed, ATR, STDEV).
• Trailing ━ Classic trailing stop following the price.
• Fast Trail ━ Accelerated trailing stop that reacts faster to price movements.
• Volatility ━ Dynamic stop based on volatility indicators.
• Chandelier ━ Stop based on price extremes.
• Activator ━ Dynamic stop based on SAR.
• MA ━ Stop based on moving averages (9 different types).
• SAR ━ Parabolic SAR (Stop and Reverse).
Advanced Take-Profit Options:
• R:R: Risk/Reward ━ sets TP based on SL size.
• T.VOLATY ━ Calculation based on volatility indicators (Fixed, ATR, STDEV).
Testing Modes:
• Stops ━ Cyclical stop-loss testing
• Pivot Point Example ━ Example of using pivot points
• External Example ━ Built-in example how test functions with different parameters
• External Signal ━ Using external signals
⭕️ Usage
━ First Steps:
When opening, select any point on the chart. It will not affect anything until you turn on Manual Start mode (more on this below).
The chart will immediately show the best results of the default Auto mode. You can switch Part's to try to find even better results in the table.
Now you can display any result from the table on the chart by entering its ID in the settings.
Repeat steps 3-4 until you determine which type of Stop Loss you like best. Then set it in the settings instead of Auto mode.
* Example: I flipped through 14 parts before I liked the first result and entered its ID so I could visually evaluate it on the chart.
Then select the stop loss type, choose it in place of Auto mode and repeat steps 3-4 or immediately follow the recommendations of the algorithm.
Now the Genetic Algorithm at the bottom right will prompt you to enter the Parameters you need to search for and select even better results.
Parameters must be entered All at once before they are updated. Enter recommendations strictly in fields with the same names.
Repeat steps 5-6 until there are approximately 10 Part's left or as you like. And after that, easily pour through the remaining Parts and select the best parameters.
━ Example of the finished result.
━ Example of use with Takes
You can also test at the same time along with Take Profit. In this example, I simply enabled Risk/Reward mode and immediately specified in the TP field Maximum RR, Minimum RR and Step. So in this example I can test (3-1) / 0.1 = 20 Takes of different sizes. There are additional tips in the settings.
━
* Soon you will start to understand how the system works and things will become much easier.
* If something doesn't work, just reset the engine settings and start over again.
* Use the tips I have left in the settings and on the Panel.
━ Details:
Sort ━ Sorting results by Score, Profit, Trades, etc..
Filter ━ Filtring results by Score, Profit, Trades, etc..
Trade Type ━ Ability to disable Long\Short but only from statistics.
BackWin ━ Backtest Window Number of Candle the script can test.
Manual Start ━ Enabling it will allow you to call a Stop from a selected point. which you selected when you started the engine.
* If you have a real open position then this mode can help to save good Stop\Take for it.
1 - 9 Сheckboxs ━ Allow you to disable any stop from Auto mode.
Ex Source - Allow you to test Stops/Takes from connected indicators.
Connection guide:
//@version=6
indicator("My script")
rsi = ta.rsi(close, 14)
buy = not na(rsi) and ta.crossover (rsi, 40) // OS = 40
sell = not na(rsi) and ta.crossunder(rsi, 60) // OB = 60
Signal = buy ? +1 : sell ? -1 : 0
plot(Signal, "🔌Connector🔌", display = display.none)
* Format the signal for your indicator in a similar style and then select it in Ex Source.
⭕️ How it Works
Hypothesis of Uniform Distribution of Rare Elements After Mixing.
'This hypothesis states that if an array of N elements contains K valid elements, then after mixing, these valid elements will be approximately uniformly distributed.'
'This means that in a random sample of k elements, the proportion of valid elements should closely match their proportion in the original array, with some random variation.'
'According to the central limit theorem, repeated sampling will result in an average count of valid elements following a normal distribution.'
'This supports the assumption that the valid elements are evenly spread across the array.'
'To test this hypothesis, we can conduct an experiment:'
'Create an array of 1,000,000 elements.'
'Select 1,000 random elements (1%) for validation.'
'Shuffle the array and divide it into groups of 1,000 elements.'
'If the hypothesis holds, each group should contain, on average, 1~ valid element, with minor variations.'
* I'd like to attach more details to My hypothesis but it won't be very relevant here. Since this is a whole separate topic, I will leave the minimum part for understanding the engine.
Practical Application
To apply this hypothesis, I needed a way to generate and thoroughly mix numerous possible combinations. Within Pine, generating over 100,000 combinations presents significant challenges, and storing millions of combinations requires excessive resources.
I developed an efficient mechanism that generates combinations in random order to address these limitations. While conventional methods often produce duplicates or require generating a complete list first, my approach guarantees that the first 10% of possible combinations are both unique and well-distributed. Based on my hypothesis, this sampling is sufficient to determine optimal testing parameters.
Most generators and randomizers fail to accommodate both my hypothesis and Pine's constraints. My solution utilizes a simple Linear Congruential Generator (LCG) for pseudo-randomization, enhanced with prime numbers to increase entropy during generation. I pre-generate the entire parameter range and then apply systematic mixing. This approach, combined with a hybrid combinatorial array-filling technique with linear distribution, delivers excellent generation quality.
My engine can efficiently generate and verify 300 unique combinations per batch. Based on the above, to determine optimal values, only 10-20 Parts need to be manually scrolled through to find the appropriate value or range, eliminating the need for exhaustive testing of millions of parameter combinations.
For the Score statistic I applied all the same, generated a range of Weights, distributed them randomly for each type of statistic to avoid manual distribution.
Score ━ based on Trade, Profit, WinRate, Profit Factor, Drawdown, Sharpe & Sortino & Omega & Calmar Ratio.
⭕️ Notes
For attentive users, a little tricks :)
To save time, switch parts every 3 seconds without waiting for it to load. After 10-20 parts, stop and wait for loading. If the pause is correct, you can switch between the rest of the parts without loading, as they will be cached. This used to work without having to wait for a pause, but now it does slower. This will save a lot of time if you are going to do a deeper backtest.
Sometimes you'll get the error “The scripts take too long to execute.”
For a quick fix you just need to switch the TF or Ticker back and forth and most likely everything will load.
The error appears because of problems on the side of the site because the engine is very heavy. It can also appear if you set too long a period for testing in BackWin or use a heavy indicator for testing.
Manual Start - Allow you to Start you Result from any point. Which in turn can help you choose a good stop-stick for your real position.
* It took me half a year from idea to current realization. This seems to be one of the few ways to build something automatic in backtest format and in this particular Pine environment. There are already better projects in other languages, and they are created much easier and faster because there are no limitations except for personal PC. If you see solutions to improve this system I would be glad if you share the code. At the moment I am tired and will continue him not soon.
Also You can use my previosly big Backtest project with more manual settings(updated soon)

Walk Forward PatternsINTRO
In Euclidean geometry, every mathematical output has a planar projection. 'Walk Forward Patterns' can be considered a practical example of this concept. On the other hand, this indicator might also be viewed as an experiment in 'how playing with Lego as a child contributes to time series analysis' :)
OVERVIEW
This script dynamically generates the necessary optimization and testing ranges for Walk Forward Analysis based on user-defined bar count and length inputs. It performs automatic calculations for each step, offers 8 different window options depending on the inputs, and visualizes the results dynamically. I should also note that most of the window models consist of original patterns I have created.
ADDITIONAL INFO : WHAT IS WALK FORWARD ANALYSIS?
Although it is not the main focus of this indicator, providing a brief definition of Walk Forward Analysis can be helpful in correctly interpreting the results it generates. Walk Forward Analysis (WFA) is a systematic method for optimizing parameters and validating trading strategies. It involves dividing historical data into variable segments, where a strategy is first optimized on an in-sample period and then tested on an out-of-sample period. This process repeats by shifting the windows forward, ensuring that each test evaluates the strategy on unseen data, helping to assess its robustness and adaptability in real market conditions.
ORIGINALITY
There are very few studies on Walk Forward Analysis in TradingView. Even worse, there are no any open-source studies available. Someone has to start somewhere, I suppose. And in my personal opinion, determining the optimization and backtest intervals is the most challenging part of WFA. These intervals serve as a prerequisite for automated parameter optimization. I felt the need to publish this pattern module, which I use in my own WFA models, partly due to this gap on community scripts.
INDICATOR MECHANICS
To use the indicator effectively, you only need to perform four simple tasks:
Specify the total number of bars in your chart in the 'Bar Index' parameter.
Define the optimization (In-Sample Test) length.
Define the testing (Out-Of-Sample Test) length.
Finally, select the window type.
The indicator automatically models everything else (including the number of steps) based on your inputs. And the result; you now have a clear idea of which bars to use for your Walk Forward tests!
A COMMONLY USED WINDOW SELECTION METHOD: ROLLING
A more concrete definition of Walk Forward Analysis, specifically for the widely used Rolling method, can be described as follows:
Parameters that have performed well over a certain period are identified (Optimization: In-Sample).
These parameters are then tested on a shorter, subsequent period (Backtest: Out-of-Sample).
The process is repeated forward in time (At each step, the optimization and backtest periods are shifted by the backtest length).
If the cumulative percentage profit obtained from the backtest results is greater than half of the historical optimization profit, the strategy is considered "successful."
If the strategy is successful, the most recent (untested) optimization values are used for live trading.
OTHER WINDOW OPTIONS
ANCHORED: That's a pattern based on progressively expanding optimization ranges at each step. Backtest ranges move forward in a staircase-like manner.
STATIC: Optimization ranges remain fixed, while backtest ranges are shifted forward.
BLOCKED: Optimization ranges are shifted forward in groups of three blocks. Backtest ranges are also shifted in a staircase manner, even at the cost of creating gaps from the optimization end bars.
TRIANGULAR: Optimization ranges are shifted forward in triangular regions, while backtest ranges move in a staircase pattern.
RATIO: The optimization length increases by 25% of the initial step’s fixed length at each step. In other words, the length grows by 25% of the first step's length incrementally. Backtest ranges always start from the bar where the optimization ends.
FIBONACCI: A variation of the Ratio method, where the optimization shift factor is set to 0.618
RANDOM WALK
Unlike the window models explained above, we can also generate optimization and backtest ranges completely randomly—offering almost unlimited variations! When you select the "Random" option in the "Window" parameter on the indicator interface, random intervals are generated based on various trigonometric calculations. By changing the numerical value in the '🐒' parameter, you can create entirely unique patterns.
WHY THE 🐒 EMOJI?
Two reasons.
First, I think that as humanity, we are a species of tailless primates who become happy when we understand things :). At least evolutionarily. The entire history of civilization is built on the effort to express the universe in a scale we can comprehend. 'Knowledge' is an invention born from this effort, which is why we feel happiness when we 'understand'. Second, I can't think of a better metaphor for randomness than a monkey sitting at a keyboard. See: Monkey Test.
Anyway, I’m rambling :)
NOTES
The indicator generates results for up to 100 steps. As the number of steps increases, the table may extend beyond the screen—don’t forget to zoom out!
FINAL WORDS
I haven’t published a Walk Forward script yet . However, there seem to be examples that can perform parameter optimization in the true sense of the word, producing more realistic results without falling into overfitting in my library. Hopefully, I’ll have the chance to publish one in the coming weeks. Sincerely thanks to Kıvanç Özbilgiç, Robert Pardo, Kevin Davey, Ernest P. Chan for their inspiring publishments.
DISCLAIMER
That's just a script, nothing more. I hope it helps everyone. Do not forget to manage your risk. And trade as safely as possible. Best of luck!
© dg_factor

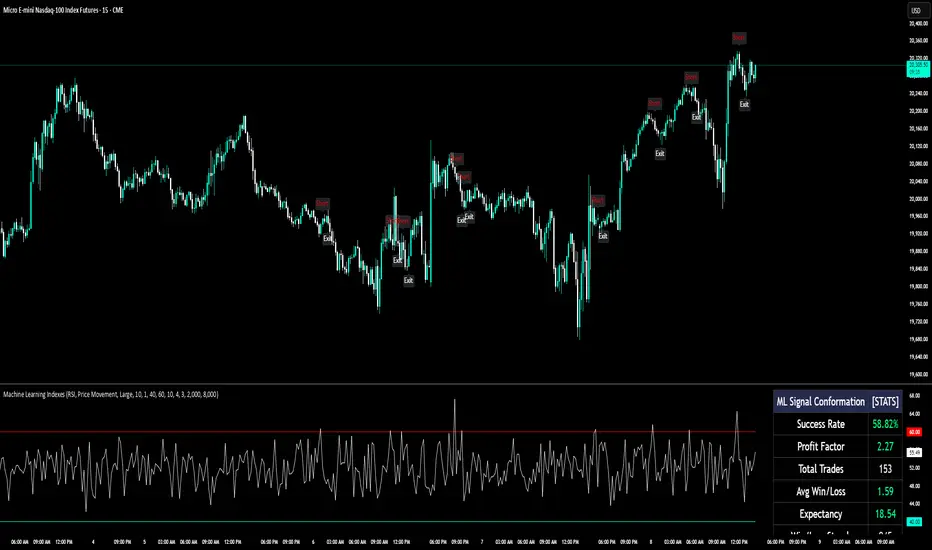
Machine Learning IndexesMachine Learning Indexes Script Description
The Machine Learning Indexes script is an advanced Pine Script™ indicator that applies machine learning techniques to analyze various market data types. It enables traders to generate adaptive long and short signals using highly customizable settings for signal detection and analysis.
Key Features:
Signal Mode: Allows the user to choose between generating signals for "Longs" (buy opportunities) or "Shorts" (sell opportunities).
Index Type: Supports multiple index types including RSI, CCI, MFI, Stochastic, and Momentum. All indexes are normalized between 0-100 for uniformity.
Data Set Selection: Provides options for analyzing Price, Volume, Volatility, or Momentum-based data sets. This enables traders to adapt the script to their preferred market analysis methodology.
Absolute vs. Directional Changes: Includes a toggle to calculate absolute changes for values or maintain directional sensitivity for trend-based analysis.
Dynamic Index Calculation: Automatically calculates and compares multiple index lengths to determine the best fit for current market conditions, adding precision to signal generation.
Input Parameters:
Signal Settings:
Signal Mode: Selects between "Longs" or "Shorts" to define the signal direction.
Index Type: Chooses the type of market index for calculations. Options include RSI, CCI, MFI, Stochastic, and Momentum.
Data Set Type: Determines the basis of the analysis, such as Price, Volume, Volatility, or Momentum-based data.
Absolute Change: Toggles whether absolute or directional changes are considered for calculations.
Index Settings:
Min Index Length: Sets the base index length used for calculations.
Index Length Variety: Adjusts the increment steps for variations in index length.
Lower/Upper Bands: Define thresholds for the selected index, indicating overbought and oversold levels.
Signal Parameters:
Target Signal Size: Number of bars used to identify pivot points.
Backtest Trade Size: Defines the number of bars over which signal performance is measured.
Sample Size: Number of data points used to calculate signal metrics.
Signal Strength Needed: Sets the minimum confidence required for a signal to be considered valid.
Require Low Variety: Option to prioritize signals with lower variability in results.
How It Works:
The script dynamically calculates multiple index variations and compares their accuracy to detect optimal parameters for generating signals.
Signal validation considers the chosen mode (longs/shorts), data set, index type, and signal parameters.
Adaptive moving averages (ADMA) and Band Signals (BS) are plotted to visualize the interaction between market trends and thresholds.
Long and short signals are displayed with clear up (L) and down (S) labels for easy interpretation.
Performance Metrics:
Success Rate: Percentage of valid signals that led to profitable outcomes.
Profit Factor: Ratio of gains from successful trades to losses from unsuccessful trades.
Disclaimer:
This indicator is for informational purposes only and does not guarantee future performance. It is designed to support traders in making informed decisions but should be used alongside other analysis methods and risk management strategies.
Machine Learning RSI Bands V3The Machine Learning RSI Bands V3 is a cutting-edge trading tool designed to provide actionable insights by combining the strength of machine learning with a traditional RSI framework. It adapts dynamically to changing market conditions, offering traders a robust, data-driven approach to identifying opportunities.
Let’s break down its functionality and the logic behind each input to give you a clear understanding of how it works and how you can use it effectively.
RSI Parameters RSI Source (rsisrc): Choose the data source for RSI calculation, such as the closing price. This allows you to focus on the specific price data that aligns with your trading strategy. RSI Length (rsilen): Set the number of periods used for RSI calculation. A shorter length makes the RSI more reactive to price changes, while a longer length smooths out volatility. These inputs allow you to customize the foundational RSI calculations, ensuring the indicator fits your style of trading.
Band Limits Lower Band Limit (lb): Defines the RSI value below which the market is considered oversold. Upper Band Limit (ub): Defines the RSI value above which the market is considered overbought. These settings give you control over the thresholds for market conditions. By adjusting the band limits, you can tailor the indicator to be more or less sensitive to market movements.
Sampling and Reaction Settings Target Reaction Size (l): Determines the number of bars used to define pivot points. Smaller values react to shorter-term price movements, while larger values focus on broader trends. Backtesting Reaction Size (btw): Sets the number of bars used to validate signal performance. This ensures signals are only considered valid if they perform consistently within the specified range. Data Format (version): Choose between Absolute (ignoring direction) and Directional (incorporating directional price changes). Sampling Method (sm): Select how the data is analyzed—options include Price Movement, Volume Movement, RSI Movement, Trend Movement, or a Hybrid approach. These settings empower you to refine how the indicator processes and interprets data, whether focusing on short-term price shifts or broader market trends.
Signal Settings Signal Confidence Method (cm): Choose between: Threshold: Signals must meet a confidence limit before being generated. Voting: Requires a majority of 5 signal components to confirm a trade. Confidence Limit (cl): Defines the confidence threshold for generating signals when using the Threshold method. Votes Needed (vn): Sets the number of votes required to confirm a trade when using the Voting method. Use All Outputs (fm): If enabled, signals are generated without filtering, providing an unfiltered view of potential opportunities. This section offers a balance between precision and flexibility, enabling you to control the rigor applied to signal generation.
How It Works
The script uses machine learning models to adaptively calculate dynamic RSI bands. These bands adjust based on market conditions, providing a more responsive and nuanced interpretation of overbought and oversold levels.
Dynamic Bands: The lower and upper RSI bands are recalibrated using machine learning to reflect current market conditions. Signals: Long and short signals are generated when RSI crosses these bands, with additional filters applied based on your chosen confidence method and sampling settings. Transparency: Real-time success rates and profit factors are displayed on the chart, giving you clear feedback on the indicator's performance.
Why Use Machine Learning RSI Bands V3?
This indicator is built for traders who want more than static thresholds and generic signals. It offers:
Adaptability: Machine learning dynamically adjusts the indicator to market conditions. Customizability: Each input serves a specific purpose, giving you full control over its behavior. Accountability: With built-in performance metrics, you always know how the tool is performing.
This is a tool designed for those who value precision and adaptability in trading.

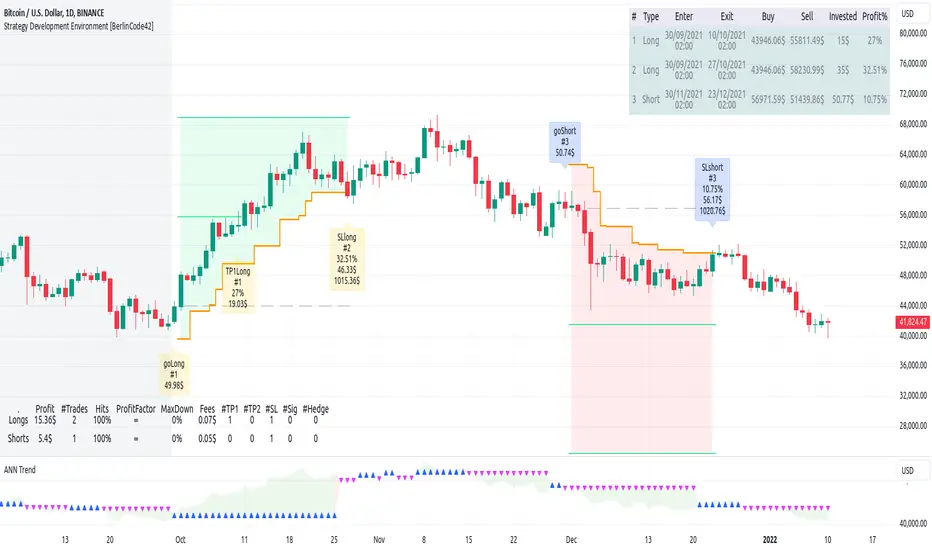
Strategy Development Environment [BerlinCode42]Happy Trade,
Intro
What is New
Algebraic/Boolean Equation
Instruction Set for The Algebraic/Boolean Equation
Example
Usage
Settings Menu
Declaration for Tradingview House Rules on Script Publishing
Disclaimer
Conclusion
1. Intro
This is a rich equipped fork of my previous "Backtest any Indicator v5". And serves as the fitting backtester and trade strategy creation tool for my upcoming ANN Indicators (artificial neural network).
As the previous version this script has no trade signal generating code. The trade signals comes in by the five user settable input slots where the user plug-in external indicators. The final trade siganls go long etc are defined by a algebraic/boolean equation typed in as text in 4 terminals as shown in Image 0 . With this algebraic/boolean equations input the user can setup any trade logic as complex and fast and easy as never seen before here on TradingView.
Image 0
2. What is new
Input algebraic/boolean equations in text-form for go long, go short, exit long & exit short
Five input slots for external indicator signals
Equation tester
User settable signal delay for enter and exit trades
User selectable alternating trades filter
User settable exit long = enter short
Intrabar or trade only on bar closing
Time filter with duration input
User settable UTC Adjustment
Long and short trades possible
Two Take Profits with quantity setting
Trailing Stop
Webhook connection
3. Algebraic/Boolean Equation
This is where the magic happens. Unlike other backtesters that rely on drop-down menus to define trade signal equations—thus limiting the number of input signals and the complexity of logic—this script uses a string interpreter to solve equations. With this, you can develop your trade logic equations and add signals or conditions simply by writing them down in algebraic/boolean form.
The instruction set for this interpreter includes not only external input signals but also several internal values. These include BarTime, BarIndex, Open, High, Low, Close, True Range, Minimal Tick, Volume, and a signal that indicates whether there is an open trade (long, short, or none). You can also reference the values of past bars for all these inputs and, of course, use constant values in your equations. There is a sad limitation: Only one past bar value per equation is practicable. If you use more, errors can occur. It seems to be caused by the pipe line architecture of the parallel computing. In any attempt to solve this issue an older function call result was hand over.
The implemented functions cover a wide range of algebraic and boolean operations. A boolean "true" is represented by all values greater than zero, while "false" is represented by zero or values less than zero.
4. Instruction set for the Algebraic/Boolean Equation
There are functions that accept either two input values or one input value. The general form is (XandY) or (notX), where X and Y can be any input slot, predefined value, constant, or another sub-equation. Functions are always written in lowercase, while input slots and predefined values use uppercase letters.
Each sub-equation must be enclosed in parentheses, e.g., (A+B). Without proper use of parentheses, the interpreter cannot determine which function to calculate first. Negative constants must be expressed by subtracting from zero (e.g., (0-3.14)), so careful attention is required.
Here are some examples that demonstrate both incorrect and correct notations:
incorrect correct
(A+B*C) (A+(B*C))
(A+B+D+E) (A+(B+(D+E)))
(-20>A) ((0-20)>A)
(A*-B) (A*(0-B))
(AnotB) (Aand(notB))
ABS(a-b) (abs(A-B))
The correct usage ensures the interpreter calculates in the intended order.
And here comes the complete Instruction Set:
Addition: (A+B)
Subtraction: (A-B)
Multiplication: (A*B)
Division: (A/B)
Absolut value: (absA)
Power of: (A^B)
Natural Logarithm: (logA)
Lowest value of Low of last x bars: (lotx)
Highest value of High of last x bars: (hotx)
Modulo, Remainder of a Division: (A%B)
Round: (rndA)
round to ceil: (ceiA)
Round to floor: (floA)
Round to next minimal tick: (mitA)
EMA of A of last 3 bars: (e03A)
EMA of A of last 7 bars: (e07A)
EMA of A of last 10 bars: (e10A)
EMA of A of last 20 bars: (e20A)
EMA of A of last 50 bars: (e50A)
Smaller then: (AB)
Equal to: (A==B)
Unequal to: (A!=B)
And: (AandB)
Or: (AorB)
Exclusive Or: (AxorB)
Not: (notA)
Past bar value: (A ) ,whereby x can be 1,2,3,...,barIndex-1
Bar time: (T)
Bar index: (I)
Opening Price of Bar: (O)
Highest Price of Bar: (H)
Lowest Price of Bar: (L)
Closing Price of Bar: (C)
Min tick value for the current symbol: (K)
Trade Volume: (V)
True Range: (R)
Is Money invested: (M) ,Long position: M=1,
Short position: M=-1,
No position: M=0
Reminder: if you wanna replace A or B above don't forget the parentheses. So if you have (logA) and wanna replace A with D+F so the correct replacement would be (log(D+F)).
In the following there are some examples of popular bar patterns and useful filters:
Doji: ((abs(O-C))<(10*K))and((H-L)>(100*K))
green Hammer: (((H-C)<(5000*K))and(((O-L)/2)>(abs(O-C)))
Up trend: (C>(e10H))
Down trend: (C<(e10L))
cool down 7 bars: (( any buy condition )and((e07(absM))==0))
possible Pivot High: (H==(hot30))and((CC))
possible Pivot Low: (L==(lot30))and((C>H )or(O0)), goShort ((A>0)and((A )<0)), Enter Signal delay=0, Exit Signal delay=0, Alternate Trades=true
take profit 1 =0.4% (30%), take profit 2 =0.7%, trailing stop loss=0.2%, intrabar, start capital=1000$, qty=5%, fee=0.05%, no Session Filter
Image 1
6. Usage
First you need to attach some signals from external Indicators. In the example above we use the Stochastic RSI indicator from TradingView. Load the Stochastic RSI indicator to the chart. Then you go to the settings menu of this script, choose in the drop-down menu of Input A the signal .
In case you wanna use a signal which is not in the drop-down menu of Input A do the following:
1) You need to know the name of the boolean (or integer) variable of your indicator which hold the desired signal. Lets say that this boolean variable is called BUY. If this BUY variable is not plotted on the chart you simply add the following code line at the end of your pine script.
For boolean (true/false) BUY variables use this:
plot(BUY ? 1:0,'Your buy condition hold in that variable BUY',display = display.data_window)
And in case your script's BUY variable is an integer or float then use instate the following code line:
plot(BUY ,'Your buy condition hold in that variable BUY',display = display.data_window)
2) Probably the name of this BUY variable in your indicator is not BUY. Simply replace in the code line above the BUY with the name of your script's trade condition variable.
3) Do the same procedure for your SELL variable. Then save your changed Indicator script.
4) Then add the changed Indicator script from step before and this backtester script to the chart ...
5) and go to the settings of it. Choose under "Settings -> Input A " your Indicator. So in the example above choose .
The form is usually: ' : BUY'. Then you see something like Image 1
6) Decide about each trade logic for Go Long and Go Short . In this Example we use for GoLong if "Stoch RSI: K" is smaller then 20. The "Stoch RSI: K" we already loaded it in input A. So we set under Go Long (A<20) and set Enter Signal Delay to 0.
Now we setup Go Short if "Stoch RSI: K" is bigger then 80. So we set under Go Short A>80. Enter Signal Delay is already set.
7) For the Exit conditions you can choose (trailing) Stop loss or Take Profit or Exit by Indicator Signal. What ever comes first triggers the exit. If you like to use an EMA Indicator for the Exit by Indicator just load it in a free input slot B, D, E, F or use the inbuild EMA. For this example we use the inbuild EMA of the last 7 values of close. It is called by the following equation: (e07C). So to exit a long trade when the close price crossunder this EMA you have to type in Exit Long ((e07C)>C). For exit a short trade enter in Exit Short ((e07C)
PSE, Practical Strategy EnginePSE, Practical Strategy Engine
A ready-to-use engine that is simple to connect your indicator to, simple to use, and effective at generating alerts for order-filled events during the real-time candle.
Great for
• Evaluating indicators on important metrics without the need to write a strategy script for backtesting.
• Using indicators with built-in risk management.
About The PSE
This engine accepts entry and exit signals from your indicator to provide trade signals for both long and short positions. The PSE was written for trading Funds (e.g. ETF’s), Stocks, Forex, Futures, and Cryptocurrencies. The trades on the chart indicate market, limit, and stop orders. The PSE allows for backtesting of trades along with metrics of performance based on trade-groups with many great features.
Note: A link to a video of how to connect your indicator(s) to the PSE is provided below.
Key Features
Trade-Grp’s
A Trade-Grp makes up one or more trade positions from the first position entering to the last position exiting. Using Trade-Grp’s instead of positions should help you better assess if the metric results fit your trading style.
Below are two (2) examples of a Trade-Grp with three (3) positions.
Metrics
A table of metrics is available if the “Show Metrics Table” checkbox is enabled on the Inputs tab, but metrics always show in the Data Window.
Examples of the Metrics Table are shown below.
• ROI (Return on Investment) and CAGR (Compound Annual Growth Rate) are based on the Avg Invest/Trade-Grp and are adjusted for dividends if the “Include Dividends in Profit” checkbox is enabled.
• Profit/Risked is based on Trade-Grp’s. Also known as reward/risk, as well as expectancy per amount risked. It determines the effectiveness of your strategy and provides a measure of comparison between your strategies. This is adjusted for dividends if the “Include Dividends in Profit” checkbox is enabled. In the Data Window the color is green when above the breakeven point of making a profit and red when below the breakeven point. In the Table the color is red if below the breakeven point, otherwise it is the default color. For example, using the 3 metrics tables above:
For every USD risked the profit is 1.709 USD.
For every BTC risked the profit is 0.832 BTC.
For every JPY risked the profit is 0.261 JPY.
• Winning % is based on Trade-Grp’s. In the Data Window the color is green when above the breakeven point of making a profit and red when below the breakeven point. In the Table the color is red if below the breakeven point, otherwise it is the default color.
The breakeven point is a relationship between the Profit/Risked and Winning % to indicate system profitability potential. Another way to assess trading system performance. For example, for a low Winning % a high Profit/Risked is needed for the system to be potentially profitable.
• Profit Factor (PF) is based on Trade-Grp’s. The dividend payment, if any, is not considered in the calculation of a win or loss. The “Include Dividends in Profit Factor” checkbox allows you the option to either include or not include dividends in the calculation of Profit Factor. The default is enabled.
Must enable the “Include Dividends in Profit” checkbox to include dividends in PF.
Including dividends in PF evaluates the trading strategy with a more overall profitability performance view.
Enable/Disable “Include Dividends in Profit Factor” checkbox also affects the Avg Trade-Grp Loss, and thus Equity Loss from ECL and % Equity Loss from ECL.
• Max Consecutive Losses are based on Trade-Grp’s.
• Nbr of Trade-Grp’s and Nbr of Positions.
These help you to determine if enough trades have occurred to validate your strategy. The Nbr of Positions is the count of positions on the chart. The TV list of trades in the Strategy Tester may indicate more than what is actually shown on the chart. The Data Window includes 'Nbr Strat Tester Trades', which equals the TV listing trades, to help you locate specific trades on the chart.
• Time in Market (%) is based on Trade-Grp’s and date range selected.
• Avg Invest/Trade-Grp will indicate the average amount of money invested in a Trade-Grp. This is adjusted for dividends if the “Include Dividends in Profit” checkbox is enabled.
• Equivalent Consecutive Losses, labeled as Equiv. Cons. Losses (ECL).
This value is determined by the Winning % and Nbr of Trade-Grp’s. This simulates the more likely case of a series of losses, then a small win, then another series of losses to form an equivalent consecutive losing streak. To lower the value, increase the Winning %.
• Equity Loss from ECL is the equity loss from the equivalent consecutive losses.
• % Equity Loss from ECL is the percent of equity loss from the equivalent consecutive losses.
Risk Management
• Pyramid rules enforce and maintain position sizing designated by you on the Inputs tab (% Equity to Risk, Up/Dwn Gap) & Properties tab (number of pyramids, slippage, and commission).
A pyramid position will not occur unless both its stop covers the last entry price with gap/slippage and commission cost of previous trade is covered. If take profit is enabled, a pyramid position will not occur unless commission cost of the trade is covered when take profit target is reached.
• Position sizing, stop-loss (SL), trailing stop-loss (TSL), and take profit (TP) are used.
• Wash sale prevention for applicable assets is enforced. Wash sale assets include stock and fund (e.g. ETF’s).
• No more than one entry position per candle is enforced .
Other Great Features
• Losing Trade-Grp’s indicated at the exit with label text in the color blue. Used to easily find consecutive losses affecting your strategy’s performance. The dividend payment, if any, is not considered in the calculation of a win or loss.
• Position values can be displayed on the chart. The number format is based on the min tick value, but is limited to 8 decimal places only for display purposes.
• Dividends per share and the amount can be displayed on the chart.
• Hold Days . This is the number of days to hold before allowing the next Trade-Grp. Can be a decimal number. This feature may help those trading on a cash account to avoid any settlement violations when trading the same asset.
• Date Filter. Partition the time when trading is allowed to see if the strategy works well across the date range selected. The metrics should be acceptable across all four (4) time ranges: entire range, 1st half, IQR (inter-quartile range), and 2nd half.
• Price gap amount identification. Used in determining if a pyramid entry may be profitable, and may be used in determining slippage amount to use.
• When TP is enabled, the PSE will only allow a pyramid position if the potential is profitable based on commission and price gap selected.
• Trade-Grp’s shown in background color: green for long positions and red for short positions.
• The PSE will alert you to update your stop-loss as the market changes if your exchange/broker does not allow for trailing stop-loss orders. Enable this option on the Inputs tab with Alert Chg TSL.
• The PSE will alert you if your drawdown exceeds Max % Equity Drawdown set on the Inputs tab.
• The PSE will send an alert to warn you of an expiring GTC order.
Some brokers will indicate the order is GTC, Good 'Till Cancelled, but there really is a time limit on the order and is typically 60-120 days. Therefore, the PSE will alert you if you've been in position for close to 60 days so you can refresh your order. The alert is typically a few days before the 60-day time period.
• For order fill alerts just use a {{placeholder}} in the Message of the alert. Details on how to enter placeholders is explained below.
• Identify same bar enter/exit for first entries and pyramids. This is shown in the Data Window as well. This can help you determine what stop-loss % works best for your trading style.
• Leverage trading information is displayed in the Data Window and applies to Trade-Grps.
Failed PosSize or Margin (%): Shows a zero if the failed-to-trade position size was less than 1 or shows the margin % which failed to meet the margin requirement set in the Properties tab. A flag will show on the bar where a failed-to-trade occurred. This is only applicable to the first position of a Trade-Grp. Position the cursor over the flag for the value to show in the Data Window.
Notional Value: total Trade-Grp position size x latest entry price x point value. The equity must be > notional value x margin requirement for a trade to occur.
Current Margin (%): must be greater than margin requirement set on the Properties tab in order for a trade to occur.
Margin Call Price: when enabled on the Style tab is displayed on both the chart and the Data Window as shown below.
PSE Settings
Pyramids
• Pyramiding requires the Stop Method to be set to either TSL or Both (meaning SL & TSL).
• The maximum number of pyramids is determined by the value entered in the Properties tab.
• Pyramid orders require the enter price to be higher than the previous close for Longs and lower than the previous close for Shorts.
• Pyramids also require the stop with gap/slippage to be higher than the last entry price for Longs, and lower than the last entry price for Shorts. This covers all previous positions and maintains position sizing.
• When take profit, TP, is enabled, the pyramids also require that they will be profitable when opening a position assuming they will reach TP. This is automatically adjusted by you with the Dwn Gap/Up Gap, Slippage, and Commission settings.
Inputs Tab
General Settings
Color Traded Background
Enable to change background color where in a trade. Green for long positions and red for short positions.
Show Losing Trade-Grp
Enable to show if losing Trade-Grp and is indicated by text in blue color. The last position may be at a loss, but if there was profit for the Trade-Grp, then it will not be shown as a loss .
Show Position Values
Enable to show the currency value of each position in gold color.
Include Dividends in Profit
This feature is only applicable if the asset pays dividends and the time frame period of the chart is 1D or less, otherwise ignored. The PSE assumes dividends are taken as cash and not reinvested.
Enable to adjust ROI, CAGR, Profit/Risked, Avg Invest/Trade-Grp, and Equity to include dividend payments. This feature considers if you were in position at least one day prior to the ex-dividend date and had not exited until after the ex-dividend date.
When Show Dividends is enabled it will display the payout in currency/share, as well as the total amount based on the number of shares the position(s) of the Trade-Grp are currently holding.
Include Dividends in Profit Factor
This checkbox allows you the option to either include or not include dividends in the calculation of Profit Factor. Must enable the “Include Dividends in Profit” checkbox to include dividends in PF. The dividend payment, if any, is not considered in the calculation of a win or loss.
Show Metrics Table
Options are font size and table location.
Alert Failed to Trade
Enable for the strategy to alert you when a trade did not happen due to low equity or low order size. Applicable only for the first position of a Trade-Grp.
Trade Direction
Options are 'Longs Only', 'Both', 'Shorts Only'.
Hold Days
This is the number of days to hold before allowing the next Trade-Grp. Applies only to the first trade position of a Trade-Grp. Where a Trade-Grp consists of the first position plus any pyramid positions.
The value entered will be overwritten to >= 31 to prevent wash sale for applicable assets in the event the last Trade-Grp was a loss. Wash sale assets include stock and fund (i.e. ETF’s).
The minimum value is the equivalent of 1 candle and is automatically assigned by the PSE if the entered value is equivalent to less than one candle. To calculate Hold Days in # of candles on the Hour chart divide the chart period by 24 x #candles. On the Minute chart divide the chart period by 60 then by 24 x #candles.
Show Vertical Lines at From Date & To Date
Shows a vertical dotted line at the From Date and To Date for visual inspection of the setting.
Date Filter
When enabled, trades are allowed between the From Date and To Date, i.e., the date range.
When disabled, trades are allowed for all candles.
Partition the time when trading is allowed to see if your indicator settings work well across the date range. Click 1st Half, IQR (inter-quartile range), or 2nd Half buttons to trade a portion of the date range.
Select only one at-a-time to partition the time when trading is allowed.
When 1st Half is enabled only trades for the 1st half of the date range are allowed.
When IQR is enabled only trades for the inter-quartile date range are allowed.
When 2nd Half is enabled only trades for the 2nd half of the date range are allowed.
Position Sizing
The % of Equity to Risk has been separated into two (2) areas: for initial trades and for pyramid trades. This allows for greater ability to maximize profits within your acceptable drawdown. A variation of the Anti-Martingale method from the initial trade if you choose to use it in that manner.
% Equity to Risk for Initial Trades: enter the percent of equity you want to risk per position for the initial trades of each Trade-Grp. For example, for 1% enter 1.
% Equity to Risk for Pyramid Trades: enter the percent of equity you want to risk per position for the pyramid trades of each Trade-Grp. For example, for 2% enter 2.
% Equity for Max Position Size: the position size will not exceed this amount. For example, for 25% enter 25.
Max % Equity Drawdown Warning: an alert will be triggered if the maximum drawdown exceeds this v alue. For example, for 10% enter 10.
Stop Methods
NOTE: The Stop Method must be either Both or TSL in order for the pyramids to work. This feature enforces position sizing.
Stop-loss, SL, and trailing stop-loss, TSL, are other features that enforce risk management.
The trailing stop-loss, TSL, is activated immediately if Stop Method = TSL. If Stop Method = Both, then the TSL is activated when its value is above stop-loss, SL, for Longs and below the SL for Shorts.
The calculated TSL value (shown on the chart by + symbol) of the previous bar is used for the current bar and the plot value is off by default, but you can it turn on via the Style tab. This is available so you can better understand how the TSL value used was calculated from. It is beneficial to show when monitoring the real-time candle.
Alert Chg TSL
When enabled, this feature will alert you to update your stop price if it moves greater than the change amount in %. The amount is the absolute % so will work for both Longs and Shorts. For example, for 1% enter 1 . This is provided since some exchanges/brokers do not offer TSL orders and you must manually adjust as price action plays out.
The alert will also suggest a stop limit price based on the gap selected and explained below.
The alert will occur at the close of the candle at the calculated TSL value of the candle just prior to the real-time candle.
Dwn Gap/Up Gap Input Settings
A price gap is the difference between the closing price of the previous candle and the opening price of the current candle. Dwn Gap and Up Gap are illustrated here.
The values of the Dwn Gap and Up Gap can be seen in the Data Window and are based on the settings of the Date Filter.
The options are “zero gap”, "median gap", "avg gap", "80 pct gap", "90 pct gap". The X pct gap stands for X percentile rank. For example, "80 pct gap" means that 80% of the gaps are less than or equal to the value shown in the Data Window. Select “zero gap” to disable this feature.
If Show Stop Limit is enabled, it will show a dotted-line below or above the current stop price where a stop-limit order should be taken. It is shown based on the gap option selected. Again, the PSE trades market, limit, and stop orders, but a stop-limit may be shown if you wanted to see where one would be set using the Up/Dwn Gap.
Dwn Gap: Affects Short Take Profit, Long Pyramid Entries, and to show the Long Stop Limit.
Up Gap : Affects Long Take Profit, Short Pyramid Entries, and to show the Short Stop Limit.
Fixed Take Profit (TP)
When take profit (TP) is enabled, the PSE will determine if opening a pyramid position will be in profit assuming the TP will be hit while considering commission costs (on Properties tab).
The larger of Up Gap or Slippage value is used with Long positions regarding TP.
The larger of Dwn Gap or Slippage value is used with Short positions regarding TP.
Properties Tab
• Initial Capital: Set as desired.
• Base Currency: Leave as Default. The PSE is designed to use the instrument’s currency, therefore leave as Default.
• Order Size: Leave as default. This setting has been disabled and position sizing is handled on the Inputs tab and is based on % of equity.
• Pyramiding: Set as desired.
• Commission: Set as number %. The PSE is designed to only work with commission as a percent of the position value.
• Verify Price for Limit Orders: Set as desired.
Slippage
Adjust Slippage on the Properties tab to account for a realistic bid-ask spread. You can use one of Dwn/Up Gap values or other guidelines. Again, the Dwn/Up Gap values are based on the Date Filter input settings.
Heed warnings from the TradingView Pine Script™ manual about values entered into the Slippage field.
The Slippage (ticks) have a noticeable influence on entry price and exit price especially at the beginning when the date range includes prices from $0.01 to $100,000.00 like that for BTC-USD INDEX. When this is the case, it is best to use different slippage values when partitioning time with the Date Filter.
To minimize the effects of slippage, yet account for it select ‘median gap’ on the Input Tab and use that value for slippage on the Properties tab.
The slippage value is included in the placeholder {{strategy.order.price}}.
Leverage Trading
The PSE is designed to be used both without leverage (the default) and with leverage.
These two settings apply to Trade-Grps. For example, for 5x leverage enter 20 (1/5x100=20).
Margin for Long Positions: Set as desired. The default is 100%.
Margin for Short Positions: Set as desired. The default is 100%.
This setting on the Inputs tab applies to each trade position within a Trade-Grp.
Max % Equity per Position: Set as desired. The default is 20% and intended for non-leverage trading. For leverage trading set as desired. For example, for 3x leverage enter 300 (3x100=300).
Recalculate After Order Is Filled
The PSE uses the strategy parameter calc_on_order_fills=true to allow for enter/exit on the same bar and generate alerts immediately after an order is filled. This parameter is on the Properties tab and is named ‘Recalculate After order is filled’ and is enabled by default.
Disabling this feature will cause the PSE to not work as intended.
You will see the following Caution! on the TV Strategy Tester
This occurs because the PSE has the strategy parameter calc_on_order_fills = true.
Again, the PSE will only work as intended if this parameter is enabled and set to true.
Therefore, you can close the caution sign and be confident of receiving realistic results.
Recalculate On every tick: Disable.
Fill Orders
• Using bar magnifier: Set as desired.
• On Bar Close: Disable. The PSE will not work as intended if this is enabled.
• Using Standard OHLC: Set as desired.
Using The Alert Message Box From TV Strategy Alert
Set alerts to gain access to all the alerts from PSE. This allows for both order filled alerts, as well as the alert function calls related to refresh GTC orders, drawdown exceeded, update stop-loss order, and Failed to Trade.
Example Message for Manual Trading Alerts
(This is just an example. Consult TV manual for possible placeholders to use.)
{
Alert for {{plot("position_for_alert")}} position. (long = 1; short = -1)
{{exchange}}:{{ticker}} on TF of {{interval}} at Broker Name
{{strategy.order.action}} Equity x Equity_Multiplier USD in shares at price = {{strategy.order.price}},
where Equity_Multiplier = {{strategy.order.contracts}} x {{strategy.order.price}} / {{plot("Equity")}}
or {{strategy.order.action}} {{strategy.order.contracts}} shares at price = {{strategy.order.price}}.
}
Note: Use the Equity x Equity_Multiplier method if you have several accounts with different initial capital.
Example Message for Bot Trading Alerts
(You must consult your specific bot for configuring the alert message. This is just an example.)
{
"action": "{{strategy.order.action}}",
“price”: {{strategy.order.price}}
"amount": {{strategy.order.contracts}},
"botId": "1234"
}
Connecting to the PSE
The diagram below illustrates how to connect indicators to the PSE.
The Aroon and MACD indicators are only used here as an example. Substitute your own indicators and add as many as you like.
Connection Indicator for the PSE
A video of how to connect your indicator(s) to the PSE is below.
The Connection Indicator for the PSE, also called here the connection-indicator.
Below is a description of how to connect your chosen indicators to the connection-indicator. Two (2) indicators were chosen for the example, but you may have one (1) or many indicators.
If you have source code access to your indicators you can paste the code directly into the connection-indicator to eliminate the need to have those indicators on the chart and the additional connection of them to the connection-indicator. Below will assume source code to the indicators are not available.
The MACD and Aroon Oscillator are from TV built standard indicators and are shown here just as an example for inputs (i.e. source) to the connection-indicator. They were configured as follows:
The source code for the connection-indicator is shown below. Substitute your own chosen indicators and add as many as you like to create your connection-indicator that feeds into the PSE. The MACD and Aroon Oscillator were simply chosen as an example. Configure your connection-indicator in the manner shown below.
// This Pine Script™ code is subject to the terms of the Mozilla Public License 2.0 at mozilla.org
// This is just an example Indicator to show how to interface with the PSE.
// The indicators used in the example are standard TV built indicators.
//@version=5
indicator(title="Connection Indicator for the PSE", overlay=false, max_lines_count=500, max_labels_count=500, max_boxes_count=500)
// Ind_1 INDICATOR ++++++++++++++++++++++++++++++++++++++++++++++++++++++++
// This is just and example and used MACD histogram as the source.
Filter_Ind_1 = input.bool(false, 'Ind_1', group='Ind_1 INDICATOR ~~~~~~~~~~~~~~~~~', tooltip='Click ON to enable the indicator')
input_Ind_1 = input.source(title = "input_Ind_1", defval = close, group='Ind_1 INDICATOR ~~~~~~~~~~~~~~~~~')
Entry_Ind_1_Long = Filter_Ind_1 ? input_Ind_1 > 0 ? 1 : 0 : 0
Entry_Ind_1_Short = Filter_Ind_1 ? input_Ind_1 < 0 ? 1 : 0 : 0
Exit_Ind_1_Long = Entry_Ind_1_Short
Exit_Ind_1_Short = Entry_Ind_1_Long
// Ind_2 INDICATOR ++++++++++++++++++++++++++++++++++++++++++++++++++++++++
// This is just an example and used Aroon Oscillator as the source. Included limits to use with the oscillator to determine enter and exit.
Filter_Ind_2 = input.bool(false, "Ind_2", group='Ind_2 INDICATOR ~~~~~~~~~~~~~~', tooltip='Click ON to enable the indicator')
Filter_Ind_2_Limit = input.int(35, minval=0, step=5, group='Ind_2 INDICATOR ~~~~~~~~~~~~~~')
Filter_Ind_2_UL = Filter_Ind_2_Limit
Filter_Ind_2_LL = -Filter_Ind_2_Limit
up = input.source(title = "input_Ind_2A Up", defval = close, group='Ind_2 INDICATOR ~~~~~~~~~~~~~~')
down = input.source(title = "input_Ind_2B Down", defval = close, group='Ind_2 INDICATOR ~~~~~~~~~~~~~~')
oscillator = up - down
Entry_Ind_2_Long = Filter_Ind_2? oscillator > Filter_Ind_2_UL ? 1 : 0 : 0
Entry_Ind_2_Short = Filter_Ind_2? oscillator < Filter_Ind_2_LL ? 1 : 0 : 0
Exit_Ind_2_Long = Entry_Ind_2_Short
Exit_Ind_2_Short = Entry_Ind_2_Long
//#region ~~~~~~~ASSEMBLY OF FILTERS ~~~~~~~~~~~~~~~~~~~~~~~~~~~~~~~~~~~~~~~~~~~~~~~~~~~~~~~~~~~~~~~~~}
// You may have as many indicators as you like. Assemble them in similar fashion as below.
// ——————— Assembly of Entry Filters
Nbr_Entries = input.int(1, minval=1, title='Min Nbr Entries', inline='nbr_in_out', group='Assembly of Indicators')
// Update the assembly based on the number of indicators connected.
EntryLongOK = Entry_Ind_1_Long + Entry_Ind_2_Long >= Nbr_Entries? true: false
EntryShortOK = Entry_Ind_1_Short + Entry_Ind_2_Short >= Nbr_Entries? true: false
entry_signal = EntryLongOK ? 1 : EntryShortOK ? -1 : 0
plot(entry_signal, title="Entry_Signal", color=color.new(color.blue, 0))
// ——————— Assembly of Exit Filters
Nbr_Exits = input.int(1, minval=1, title='Min Nbr of Exits', inline='nbr_in_out', group='Assembly of Indicators', tooltip='Enter the minimum number of entries & exits
required for a signal.')
// Update the assembly based on the number of indicators connected.
ExitLongOK = Exit_Ind_1_Long + Exit_Ind_2_Long >= Nbr_Exits? true: false
ExitShortOK = Exit_Ind_1_Short + Exit_Ind_2_Short >= Nbr_Exits? true: false
exit_signal = ExitLongOK ? 1 : ExitShortOK ? -1 : 0
plot(exit_signal, title="Exit_Signal", color=color.new(color.red, 0))
//#endregion ~~~~~~~END OF ASSEMBLY OF FILTERS ~~~~~~~~~~~~~~~~~~~~~~~~~~~~~~~~~~~~~~~~~~~~~~~~~~~~~~~~~~~~~~~~~}
The input box for the connection-indicator is shown below. The default for input source is “close”. For Input_Ind_1 click the dropdown and select the MACD Histogram. For Input_Ind_2 click the dropdown and select Aroon Up and Aroon Down as shown.
Signal Connection Section of PSE
Below is a description of how to connect your chosen indicators to the PSE from the connection-indicator.
At the PSE Input tab, the Signal Connection Section is where you select the source of the Entry and Exit Signal to the PSE. These are the outputs from connection-indicator.
The default source is “close”. Click the dropdown and select the entry and exit signal to establish a connection as shown below.

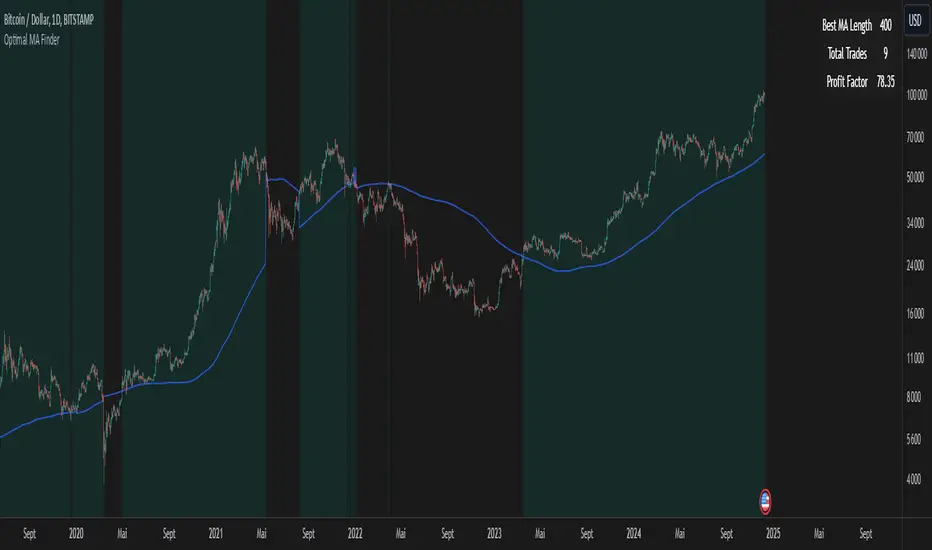
Optimal MA FinderIntroduction to the "Optimal MA Finder" Indicator
The "Optimal MA Finder" is a powerful and versatile tool designed to help traders optimize their moving average strategies. This script combines flexibility, precision, and automation to identify the most effective moving average (MA) length for your trading approach. Whether you're aiming to improve your long-only strategy or implement a buy-and-sell methodology, the "Optimal MA Finder" is your go-to solution for enhanced decision-making.
What Does It Do?
The script evaluates a wide range of moving average lengths, from 10 to 500, to determine which one produces the best results based on historical data. By calculating critical metrics such as the total number of trades and the profit factor for each MA length, it identifies the one that maximizes profitability. It supports both simple moving averages (SMA) and exponential moving averages (EMA), allowing you to tailor the analysis to your preferred method.
The logic works by backtesting each MA length against the price data and assessing the performance under two strategies:
Buy & Sell: Includes both long and short trades.
Long Only: Focuses solely on long positions for more conservative strategies.
Once the optimal MA length is identified, the script overlays it on the chart, highlighting periods when the price crosses over or under the optimal MA, helping traders identify potential entry and exit points.
Why Is It Useful?
This indicator stands out for its ability to automate a task that is often labor-intensive and subjective: finding the best MA length. By providing a clear, data-driven answer, it saves traders countless hours of manual testing while significantly enhancing the accuracy of their strategies. For example, instead of guessing whether a 50-period EMA is more effective than a 200-period SMA, the "Optimal MA Finder" will pinpoint the exact length and type of MA that has historically yielded the best results for your chosen strategy.
Key Benefits:
Precision: Identifies the MA length with the highest profit factor for maximum profitability.
Automation: Conducts thorough backtesting without manual effort.
Flexibility: Adapts to your preferred MA type (SMA or EMA) and trading strategy (Buy & Sell or Long Only).
Real-Time Feedback: Provides actionable insights by plotting the optimal MA directly on your chart and highlighting relevant trading periods.
Example of Use: Imagine you're trading a volatile stock and want to optimize your long-only strategy. By applying the "Optimal MA Finder," you discover that a 120-period EMA results in the highest profit factor. The indicator plots this EMA on your chart, showing you when to consider entering or exiting positions based on price movements relative to the EMA.
In short, the "Optimal MA Finder" empowers traders by delivering data-driven insights and improving the effectiveness of trading strategies. Its clear logic, combined with robust automation, makes it an invaluable tool for both novice and experienced traders seeking consistent results.
Fourier For Loop [BackQuant]Fourier For Loop
PLEASE Read the following, as understanding an indicator's functionality is essential before integrating it into a trading strategy. Knowing the core logic behind each tool allows for a sound and strategic approach to trading.
Introducing BackQuant's Fourier For Loop (FFL) — a cutting-edge trading indicator that combines Fourier transforms with a for-loop scoring mechanism. This innovative approach leverages mathematical precision to extract trends and reversals in the market, helping traders make informed decisions. Let's break down the components, rationale, and potential use-cases of this indicator.
Understanding Fourier Transform in Trading
The Fourier Transform decomposes price movements into their frequency components, allowing for a detailed analysis of cyclical behavior in the market. By transforming the price data from the time domain into the frequency domain, this indicator identifies underlying patterns that traditional methods may overlook.
In this script, Fourier transforms are applied to the specified calculation source (defaulted to HLC3). The transformation yields magnitude values that can be used to score market movements over a defined range. This scoring process helps uncover long and short signals based on relative strength and trend direction.
Why Use Fourier Transforms?
Fourier Transforms excel in identifying recurring cycles and smoothing noisy data, making them ideal for fast-paced markets where price movements may be erratic. They also provide a unique perspective on market volatility, offering traders additional insights beyond standard indicators.
Calculation Logic: For-Loop Scoring Mechanism
The For Loop Scoring mechanism compares the magnitude of each transformed point in the series, summing the results to generate a score. This score forms the backbone of the signal generation system.
Long Signals: Generated when the score surpasses the defined long threshold (default set at 40). This indicates a strong bullish trend, signaling potential upward momentum.
Short Signals: Triggered when the score crosses under the short threshold (default set at -10). This suggests a bearish trend or potential downside risk.'
Thresholds & Customization
The indicator offers customizable settings to fit various trading styles:
Calculation Periods: Control how many periods the Fourier transform covers.
Long/Short Thresholds: Adjust the sensitivity of the signals to match different timeframes or risk preferences.
Visualization Options: Traders can visualize the thresholds, change the color of bars based on trend direction, and even color the background for enhanced clarity.
Trading Applications
This Fourier For Loop indicator is designed to be versatile across various market conditions and timeframes. Some of its key use-cases include:
Cycle Detection: Fourier transforms help identify recurring patterns or cycles, giving traders a head-start on market direction.
Trend Following: The for-loop scoring system helps confirm the strength of trends, allowing traders to enter positions with greater confidence.
Risk Management: With clearly defined long and short signals, traders can manage their positions effectively, minimizing exposure to false signals.
Final Note
Incorporating this indicator into your trading strategy adds a layer of mathematical precision to traditional technical analysis. Be sure to adjust the calculation start/end points and thresholds to match your specific trading style, and remember that no indicator guarantees success. Always backtest thoroughly and integrate the Fourier For Loop into a balanced trading system.
Thus following all of the key points here are some sample backtests on the 1D Chart
Disclaimer: Backtests are based off past results, and are not indicative of the future .
INDEX:BTCUSD
INDEX:ETHUSD
BINANCE:SOLUSD

Interest Rate Trading (Manually Added Rate Decisions) [TANHEF]Interest Rate Trading: How Interest Rates Can Guide Your Next Move.
How were interest rate decisions added?
All interest rate decision dates were manually retrieved from the 'Record of Policy Actions' and 'Minutes of Actions' on the Federal Reserve's website due to inconsistent dates from other sources. These were manually added as Pine Script currently only identifies rate changes, not pauses.
█ Simple Explanation:
This script is designed for analyzing and backtesting trading strategies based on U.S. interest rate decisions which occur during Federal Open Market Committee (FOMC) meetings, to make trading decisions. No trading strategy is perfect, and it's important to understand that expectations won't always play out. The script leverages historical interest rate changes, including increases, decreases, and pauses, across multiple economic time periods from 1971 to the present. The tool integrates two key data sources for interest rates—USINTR and FEDFUNDS—to support decision-making around rate-based trades. The focus is on identifying opportunities and tracking trades driven by interest rate movements.
█ Interest Rate Decision Sources:
As noted above, each decision date has been manually added from the 'Record of Policy Actions' and 'Minutes of Actions' documents on the Federal Reserve's website. This includes +50 years of more than 600 rate decisions.
█ Interest Rate Data Sources:
USINTR: Reflects broader U.S. interest rate trends, including Treasury yields and various benchmarks. This is the preferred option as it corresponds well to the rate decision dates.
FEDFUNDS: Tracks the Federal Funds Rate, which is a more specific rate targeted by the Federal Reserve. This does not change on the exact same days as the rate decisions that occur at FOMC meetings.
█ Trade Criteria:
A variety of trading conditions are predefined to suit different trading strategies. These conditions include:
Increase/Decrease: Standard rate increases or decreases.
Double/Triple Increase/Decrease: A series of consecutive changes.
Aggressive Increase/Decrease: Rate changes that exceed recent movements.
Pause: Identification of no changes (pauses) between rate decisions, including double or triple pauses.
Complex Patterns: Combinations of pauses, increases, or decreases, such as "Pause after Increase" or "Pause or Increase."
█ Trade Execution and Exit:
The script allows automated trade execution based on selected criteria:
Auto-Entry: Option to enter trades automatically at the first valid period.
Max Trade Duration: Optional exit of trades after a specified number of bars (candles).
Pause Days: Minimum duration (in days) to validate rate pauses as entry conditions. This is especially useful for earlier periods (prior to the 2000s), where rate decisions often seemed random compared to the consistency we see today.
█ Visualization:
Several visual elements enhance the backtesting experience:
Time Period Highlighting: Economic time periods are visually segmented on the chart, each with a unique color. These periods include historical phases such as "Stagflation (1971-1982)" and "Post-Pandemic Recovery (2021-Present)".
Trade and Holding Results: Displays the profit and loss of trades and holding results directly on the chart.
Interest Rate Plot: Plots the interest rate movements on the chart, allowing for real-time tracking of rate changes.
Trade Status: Highlights active long or short positions on the chart.
█ Statistics and Criteria Display:
Stats Table: Summarizes trade results, including wins, losses, and draw percentages for both long and short trades.
Criteria Table: Lists the selected entry and exit criteria for both long and short positions.
█ Economic Time Periods:
The script organizes interest rate decisions into well-defined economic periods, allowing traders to backtest strategies specific to historical contexts like:
(1971-1982) Stagflation
(1983-1990) Reaganomics and Deregulation
(1991-1994) Early 1990s (Recession and Recovery)
(1995-2001) Dot-Com Bubble
(2001-2006) Housing Boom
(2007-2009) Global Financial Crisis
(2009-2015) Great Recession Recovery
(2015-2019) Normalization Period
(2019-2021) COVID-19 Pandemic
(2021-Present) Post-Pandemic Recovery
█ User-Configurable Inputs:
Rate Source Selection: Choose between USINTR or FEDFUNDS as the primary interest rate source.
Trade Criteria Customization: Users can select the criteria for long and short trades, specifying when to enter or exit based on changes in the interest rate.
Time Period: Select the time period that you want to isolate testing a strategy with.
Auto-Entry and Pause Settings: Options to automatically enter trades and specify the number of days to confirm a rate pause.
Max Trade Duration: Limits how long trades can remain open, defined by the number of bars.
█ Trade Logic:
The script manages entries and exits for both long and short trades. It calculates the profit or loss percentage based on the entry and exit prices. The script tracks ongoing trades, dynamically updating the profit or loss as price changes.
█ Examples:
One of the most popular opinions is that when rate starts begin you should sell, then buy back in when rate cuts stop dropping. However, this can be easily proven to be a difficult task. Predicting the end of a rate cut is very difficult to do with the the exception that assumes rates will not fall below 0.25%.
2001-2009
Trade Result: +29.85%
Holding Result: -27.74%
1971-2024
Trade Result: +533%
Holding Result: +5901%
█ Backtest and Real-Time Use:
This backtester is useful for historical analysis and real-time trading. By setting up various entry and exit rules tied to interest rate movements, traders can test and refine strategies based on real historical data and rate decision trends.
This powerful tool allows traders to customize strategies, backtest them through different economic periods, and get visual feedback on their trading performance, helping to make more informed decisions based on interest rate dynamics. The main goal of this indicator is to challenge the belief that future events must mirror the 2001 and 2007 rate cuts. If everyone expects something to happen, it usually doesn’t.

Descriptive Backtesting Framework (DBF)As the name suggests, this is a backtesting framework made to offer full backtesting functionality to any custom indicator in a visually descriptive way.
Any trade taken will be very clear to visualize on the chart and the equity line will be updated live allowing us to use the REPLAY feature to view the strategy performing in real time.
Stops and Targets will also get draw on the chart with labels and tooltips and there will be a table on the top right corner displaying lots of descriptive metrics to measure your strategy's performance.
IF YOU DECIDE TO USE THIS FRAMEWORK, PLEASE READ **EVERYTHING** BELOW
HOW TO USE IT
Step 1 - Insert Your Strategy Indicators:
Inside this framework's code, right at the beginning, you will find a dedicated section where you can manually insert any set of indicators you desire.
Just replace the example code in there with your own strategy indicators.
Step 2 - Specify The Conditions To Take Trades:
After that, there will be another section where you need to specify your strategy's conditions to enter and exit trades.
When met, those conditions will fire the trading signals to the trading engine inside the framework.
If you don't wish to use some of the available signals, please just assign false to the signal.
DO NOT DELETE THE SIGNAL VARIABLES
Step 3 - Specify Entry/Exit Prices, Stops & Targets:
Finally you'll reach the last section where you'll be able to specify entry/exit prices as well as add stops and targets.
On most cases, it's easier and more reliable to just use the close price to enter and exit trades.
If you decide to use the open price instead, please remember to change step 2 so that trades are taken on the open price of the next candle and not the present one to avoid the look ahead bias.
Stops and targets can be set in any way you want.
Also, please don't forget to update the spread. If your broker uses commissions instead of spreads or a combination of both, you'll need to manually incorporate those costs in this step.
And that's it! That's all you have to do.
Below this section you'll now see a sign warning you about not making any changes to the code below.
From here on, the framework will take care of executing the trades and calculating the performance metrics for you and making sure all calculations are consistent.
VISUAL FEATURES:
Price candles get painted according to the current trade.
They will be blue during long trades, purple on shorts and white when no trade is on.
When the framework receives the signals to start or close a trade, it will display those signals as shapes on the upper and lower limits of the chart:
DIAMOND: represents a signal to open a trade, the trade direction is represented by the shape's color;
CROSS: means a stop loss was triggered;
FLAG: means a take profit was triggered;
CIRCLE: means an exit trade signal was fired;
Hovering the mouse over the trade labels will reveal:
Asset Quantity;
Entry/Exit Prices;
Stops & Targets;
Trade Profit;
Profit As Percentage Of Trade Volume;
**Please note that there's a limit as to how many labels can be drawn on the chart at once.**
If you which to see labels from the beginning of the chart, you'll probably need to use the replay feature.
PERFORMANCE TABLE:
The performance table displays several performance metrics to evaluate the strategy.
All the performance metrics here are calculated by the framework. It does not uses the oficial pine script strategy tester.
All metrics are calculated in real time. If using the replay feature, they will be updated up to the last played bar.
Here are the available metrics and their definition:
INITIAL EQUITY: the initial amount of money we had when the strategy started, obviously...;
CURRENT EQUITY: the amount of money we have now. If using the replay feature, it will show the current equity up to the last bar played. The number on it's right side shows how many times our equity has been multiplied from it's initial value;
TRADE COUNT: how many trades were taken;
WIN COUNT: how many of those trades were wins. The percentage at the right side is the strategy WIN RATE;
AVG GAIN PER TRADE: the average percentage gain per trade. Very small values can indicate a fragile strategy that can behave in unexpected ways under high volatility conditions;
AVG GAIN PER WIN: the average percentage gain of trades that were profitable;
AVG GAIN PER LOSS: the average percentage loss on trades that were not profitable;
EQUITY MAX DD: the maximum drawdown experienced by our equity during the entire strategy backtest;
TRADE MAX DD: the maximum drawdown experienced by our equity after one single trade;
AVG MONTHLY RETURN: the compound monthly return that our strategy was able to create during the backtested period;
AVG ANNUAL RETURN: this is the strategy's CAGR (compound annual growth rate);
ELAPSED MONTHS: number of months since the backtest started;
RISK/REWARD RATIO: shows how profitable the strategy is for the amount of risk it takes. Values above 1 are very good (and rare). This is calculated as follows: (Avg Annual Return) / mod(Equity Max DD). Where mod() is the same as math.abs();
AVAILABLE SETTINGS:
SPREAD: specify your broker's asset spread
ENABLE LONGS / SHORTS: you can keep both enable or chose to take trades in only one direction
MINIMUM BARS CLOSED: to avoid trading before indicators such as a slow moving average have had time to populate, you can manually set the number of bars to wait before allowing trades.
INITIAL EQUITY: you can specify your starting equity
EXPOSURE: is the percentage of equity you wish to risk per trade. When using stops, the strategy will automatically calculate your position size to match the exposure with the stop distance. If you are not using stops then your trade volume will be the percentage of equity specified here. 100 means you'll enter trades with all your equity and 200 means you'll use a 2x leverage.
MAX LEVERAGE ALLOWED: In some situations a short stop distance can create huge levels of leverage. If you want to limit leverage to a maximum value you can set it here.
SEVERAL PLOTTING OPTIONS: You'll be able to specify which of the framework visuals you wish to see drawn on the chart.
FRAMEWORK **LIMITATIONS**:
When stop and target are both triggered in the same candle, this framework isn't able to enter faster timeframes to check which one was triggered first, so it will take the pessimistic assumption and annul the take profit signal;
This framework doesn't support pyramiding;
This framework doesn't support both long and short positions to be active at the same time. So for example, if a short signal is received while a long trade is open, the framework will close the long trade and then open a short trade;
FINAL CONSIDERATIONS:
I've been using this framework for a good time and I find it's better to use and easier to analyze a strategy's performance then relying on the oficial pine script strategy tester. However, I CANNOT GUARANTEE IT TO BE BUG FREE.
**PLEASE PERFORM A MANUAL BACKTEST BEFORE USING ANY STRATEGY WITH REAL MONEY**

Filtered MACD with Backtest [UAlgo]The "Filtered MACD with Backtest " indicator is an advanced trading tool designed for the TradingView platform. It combines the Moving Average Convergence Divergence (MACD) with additional filters such as Moving Average (MA) and Average Directional Index (ADX) to enhance trading signals. This indicator aims to provide more reliable entry and exit points by filtering out noise and confirming trends. Additionally, it includes a comprehensive backtesting module to simulate trading strategies and assess their performance based on historical data. The visual backtest module allows traders to see potential trades directly on the chart, making it easier to evaluate the effectiveness of the strategy.
🔶 Customizable Parameters :
Price Source Selection: Users can choose their preferred price source for calculations, providing flexibility in analysis.
Filter Parameters:
MA Filter: Option to use a Moving Average filter with types such as EMA, SMA, WMA, RMA, and VWMA, and a customizable length.
ADX Filter: Option to use an ADX filter with adjustable length and threshold to determine trend strength.
MACD Parameters: Customizable fast length, slow length, and signal smoothing for the MACD indicator.
Backtest Module:
Entry Type: Supports "Buy and Sell", "Buy", and "Sell" strategies.
Stop Loss Types: Choose from ATR-based, fixed point, or X bar high/low stop loss methods.
Reward to Risk Ratio: Set the desired take profit level relative to the stop loss.
Backtest Visuals: Display entry, stop loss, and take profit levels directly on the chart with
colored backgrounds.
Alerts: Configurable alerts for buy and sell signals.
🔶 Filtered MACD : Understanding How Filters Work with ADX and MA
ADX Filter:
The Average Directional Index (ADX) measures the strength of a trend. The script calculates ADX using the user-defined length and applies a threshold value.
Trading Signals with ADX Filter:
Buy Signal: A regular MACD buy signal (crossover of MACD line above the signal line) is only considered valid if the ADX is above the set threshold. This suggests a stronger uptrend to potentially capitalize on.
Sell Signal: Conversely, a regular MACD sell signal (crossunder of MACD line below the signal line) is only considered valid if the ADX is above the threshold, indicating a stronger downtrend for potential shorting opportunities.
Benefits: The ADX filter helps avoid whipsaws or false signals that might occur during choppy market conditions with weak trends.
MA Filter:
You can choose from various Moving Average (MA) types (EMA, SMA, WMA, RMA, VWMA) for the filter. The script calculates the chosen MA based on the user-defined length.
Trading Signals with MA Filter:
Buy Signal: A regular MACD buy signal is only considered valid if the closing price is above the MA value. This suggests a potential uptrend confirmed by the price action staying above the moving average.
Sell Signal: Conversely, a regular MACD sell signal is only considered valid if the closing price is below the MA value. This suggests a potential downtrend confirmed by the price action staying below the moving average.
Benefits: The MA filter helps identify potential trend continuation opportunities by ensuring the price aligns with the chosen moving average direction.
Combining Filters:
You can choose to use either the ADX filter, the MA filter, or both depending on your strategy preference. Using both filters adds an extra layer of confirmation for your signals.
🔶 Backtesting Module
The backtesting module in this script allows you to visually assess how the filtered MACD strategy would have performed on historical data. Here's a deeper dive into its features:
Backtesting Type: You can choose to backtest for buy signals only, sell signals only, or both. This allows you to analyze the strategy's effectiveness in different market conditions.
Stop-Loss Types: You can define how stop-loss orders are placed:
ATR (Average True Range): This uses a volatility measure (ATR) multiplied by a user-defined factor to set the stop-loss level.
Fixed Point: This allows you to specify a fixed dollar amount or percentage value as the stop-loss.
X bar High/Low: This sets the stop-loss at a certain number of bars (defined by the user) above/below the bar's high (for long positions) or low (for short positions).
Reward-to-Risk Ratio: Define the desired ratio between your potential profit and potential loss on each trade. The backtesting module will calculate take-profit levels based on this ratio and the stop-loss placement.
🔶 Disclaimer:
Use with Caution: This indicator is provided for educational and informational purposes only and should not be considered as financial advice. Users should exercise caution and perform their own analysis before making trading decisions based on the indicator's signals.
Not Financial Advice: The information provided by this indicator does not constitute financial advice, and the creator (UAlgo) shall not be held responsible for any trading losses incurred as a result of using this indicator.
Backtesting Recommended: Traders are encouraged to backtest the indicator thoroughly on historical data before using it in live trading to assess its performance and suitability for their trading strategies.
Risk Management: Trading involves inherent risks, and users should implement proper risk management strategies, including but not limited to stop-loss orders and position sizing, to mitigate potential losses.
No Guarantees: The accuracy and reliability of the indicator's signals cannot be guaranteed, as they are based on historical price data and past performance may not be indicative of future results.

MetaFOX DCA (ASAP-RSI-BB%B-TV)Welcome To ' MetaFOX DCA (ASAP-RSI-BB%B-TV) ' Indicator.
This is not a Buy/Sell signals indicator, this is an indicator to help you create your own strategy using a variety of technical analyzing options within the indicator settings with the ability to do DCA (Dollar Cost Average) with up to 100 safety orders.
It is important when backtesting to get a real results, but this is impossible, especially when the time frame is large, because we don't know the real price action inside each candle, as we don't know whether the price reached the high or low first. but what I can say is that I present to you a backtest results in the worst possible case, meaning that if the same chart is repeated during the next period and you traded for the same period and with the same settings, the real results will be either identical to the results in the indicator or better (not worst). There will be no other factors except the slippage in the price when executing orders in the real trading, So I created a feature for that to increase the accuracy rate of the results. For more information, read this description.
Below I will explain all the properties and settings of the indicator:
A) 'Buy Strategies' Section: Your choices of strategies to Start a new trade: (All the conditions works as (And) not (OR), You have to choose one at least and you can choose more than one).
- 'ASAP (New Candle)': Start a trade as soon as possible at the opening of a new candle after exiting the previous trade.
- 'RSI': Using RSI as a technical analysis condition to start a trade.
- 'BB %B': Using BB %B as a technical analysis condition to start a trade.
- 'TV': Using tradingview crypto screener as a technical analysis condition to start a trade.
B) 'Exit Strategies' Section: Your choices of strategies to Exit the trades: (All the conditions works as (And) not (OR), You can choose more than one, But if you don't want to use any of them you have to activate the 'Use TP:' at least).
- 'ASAP (New Candle)': Exit a trade as soon as possible at the opening of a new candle after opening the previous trade.
- 'RSI': Using RSI as a technical analysis condition to exit a trade.
- 'BB %B': Using BB %B as a technical analysis condition to exit a trade.
- 'TV': Using tradingview crypto screener as a technical analysis condition to exit a trade.
C) 'Main Settings' Section:
- 'Trading Fees %': The Exchange trading fees in percentage (trading Commission).
- 'Entry Price Slippage %': Since real trading differs from backtest calculations, while in backtest results are calculated based on the open price of the candle, but in real trading there is a slippage from the open price of the candle resulting from the supply and demand in the real time trading, so this feature is to determine the slippage Which you think it is appropriate, then the entry prices of the trades will calculated higher than the open price of the start candle by the percentage of slippage that you set. If you don't want to calculate any slippage, just set it to zero, but I don't recommend that if you want the most realistic results.
Note: If (open price + slippage) is higher than the high of the candle then don't worry, I've kept this in consideration.
- 'Use SL': Activate to use stop loss percentage.
- 'SL %': Stop loss percentage.
- 'SL settings options box':
'SL From Base Price': Calculate the SL from the base order price (from the trade first entry price).
'SL From Avg. Price': Calculate the SL from the average price in case you use safety orders.
'SL From Last SO.': Calculate the SL from the last (lowest) safety order deviation.
ex: If you choose 'SL From Avg. Price' and SL% is 5, then the SL will be lower than the average price by 5% (in this case your SL will be dynamic until the price reaches all the safety orders unlike the other two SL options).
Note: This indicator programmed to be compatible with '3COMMAS' platform, but I added more options that came to my mind.
'3COMMAS' DCA bots uses 'SL From Base Price'.
- 'Use TP': Activate to use take profit percentage.
- 'TP %': Take profit percentage.
- 'Pure TP,SL': This feature was created due to the differences in the method of calculations between API tools trading platforms:
If the feature is not activated and (for example) the TP is 5%, this means that the price must move upward by only 5%, but you will not achieve a net profit of 5% due to the trading fees. but If the feature is activated, this means that you will get a net profit of 5%, and this means that the price must move upward by (5% for the TP + the equivalent of trading fees). The same idea is applied to the SL.
Note: '3COMMAS' DCA bots uses activated 'Pure TP,SL'.
- 'SO. Price Deviation %': Determines the decline percentage for the first safety order from the trade start entry price.
- 'SO. Step Scale': Determines the deviation multiplier for the safety orders.
Note: I'm using the same method of calculations for SO. (safety orders) levels that '3COMMAS' platform is using. If there is any difference between the '3COMMAS' calculations and the platform that you are using, please let me know.
'3COMMAS' DCA bots minimum 'SO. Price Deviation %' is (0.21)
'3COMMAS' DCA bots minimum 'SO. Step Scale' is (0.1)
- 'SO. Volume Scale': Determines the base order size multiplier for the safety orders sizes.
ex: If you used 10$ to buy at the trade start (base order size) and your 'SO. Volume Scale' is 2, then the 1st SO. size will be 20, the 2nd SO. size will be 40 and so on.
- 'SO. Count': Determines the number of safety orders that you want. If you want to trade without safety orders set it to zero.
'3COMMAS' DCA bots minimum 'SO. Volume Scale' is (0.1)
- 'Exchange Min. Size': The exchange minimum size per trade, It's important to prevent you from setting the base order Size less than the exchange limit. It's also important for the backtest results calculations.
ex: If you setup your strategy settings and it led to a loss to the point that you can't trade any more due to insufficient funds and your base order size share from the strategy becomes less than the exchange minimum trade size, then the indicator will show you a warning and will show you the point where you stopped the trading (It works in compatible with the initial capital). I recommend to set it a little bit higher than the real exchange minimum trade size especially if you trade without safety orders to not stuck in the trade if you hit the stop loss
- 'BO. Size': The base order size (funds you use at the trade entry).
- 'Initial Capital': The total funds allocated for trading using your strategy settings, It can be more than what is required in the strategy to cover the deficit in case of a loss, but it should not exceed the funds that you actually have for trading using this strategy settings, It's important to prevent you from setting up a strategy which requires funds more than what you have. It's also has other important benefits (refer to 'Exchange Min. Size' for more information).
- 'Accumulative Results': This feature is also called re-invest profits & risk reduction. If it's not activated then you will use the same funds size in each new trade whether you are in profit or loss till the (initial capitals + net results) turns insufficient. If it's activated then you will reuse your profits and losses in each new trade.
ex: The feature is active and your first trade ended with a net profit of 1000$, the next trade will add the 1000$ to the trade funds size and it will be distributed as a percentage to the BO. & SO.s according to your strategy settings. The same idea in case of a loss, the trade funds size will be reduced.
D) 'RSI Strategy' Section:
- 'Buy': RSI technical condition to start a trade. Has no effect if you don't choose 'RSI' option in 'Buy Strategies'.
- 'Exit': RSI technical condition to exit a trade. Has no effect if you don't choose 'RSI' option in 'Exit Strategies'.
E) 'TV Strategy' Section:
- 'Buy': TradingView Crypto Screener technical condition to start a trade. Has no effect if you don't choose 'TV' option in 'Buy Strategies'.
- 'Exit': TradingView Crypto Screener technical condition to exit a trade. Has no effect if you don't choose 'TV' option in 'Exit Strategies'.
F) 'BB %B Strategy' Section:
- 'Buy': BB %B technical condition to start a trade. Has no effect if you don't choose 'BB %B' option in 'Buy Strategies'.
- 'Exit': BB %B technical condition to exit a trade. Has no effect if you don't choose 'BB %B' option in 'Exit Strategies'.
G) 'Plot' Section:
- 'Signals': Plots buy and exit signals.
- 'BO': Plots the trade entry price (base order price).
- 'AVG': Plots the trade average price.
- 'AVG options box': Your choice to plot the trade average price type:
'Avg. With Fees': The trade average price including the trading fees, If you exit the trade at this price the trade net profit will be 0.00
'Avg. Without Fees': The trade average price but not including the trading fees, If you exit the trade at this price the trade net profit will be a loss equivalent to the trading fees.
- 'TP': Plots the trade take profit price.
- 'SL': Plots the trade stop loss price.
- 'Last SO': Plots the trade last safety order that the price reached.
- 'Exit Price': Plots a mark on the trade exit price, It plots in 3 colors as below:
Red (Default): Trade exit at a loss.
Green (Default): Trade exit at a profit.
Yellow (Default): Trade exit at a profit but this is a special case where we have to calculate the profits before reaching the safety orders (if any) on that candle (compatible with the idea of getting strategy results at the worst case).
- 'Result Table': Plots your strategy result table. The net profit percentage shown is a percentage of the 'initial capital'.
- 'TA Values': Plots your used strategies Technical analysis values. (Green cells means valid condition).
- 'Help Table': Plots a table to help you discover 100 safety orders with its deviations and the total funds needed for your strategy settings. Deviations shown in red is impossible to use because its price is <= 0.00
- 'Portfolio Chart': Plots your Portfolio status during the entire trading period in addition to the highest and lowest level reached. It's important when evaluating any strategy not only to look at the final result, but also to look at the change in results over the entire trading period. Perhaps the results were worryingly negative at some point before they rose again and made a profit. This feature helps you to see the whole picture.
- 'Welcome Message': Plots a welcome message and showing you the idea behind this indicator.
- 'Green Net Profit %': It plots the 'Net Profit %' in the result table in green color if the result is equal to or above the value that you entered.
- 'Green Win Rate %': It plots the 'Win Rate %' in the result table in green color if the result is equal to or above the value that you entered.
- 'User Notes Area': An empty text area, Feel free to use this area to write your notes so you don't forget them.
The indicator will take care of you. In some cases, warning messages will appear for you. Read them carefully, as they mean that you have done an illogical error in the indicator settings. Also, the indicator will sometimes stop working for the same reason mentioned above. If that happens then click on the red (!) next to the indicator name and read the message to find out what illogical error you have done.
Please enjoy the indicator and let me know your thoughts in the comments below.

GKD-BT Optimizer SCSC Backtest [Loxx]The Giga Kaleidoscope GKD-BT Optimizer SCSC Backtest (Solo Confirmation Super Complex) is a Backtest module included in AlgxTrading's "Giga Kaleidoscope Modularized Trading System." (see the section Giga Kaleidoscope (GKD) Modularized Trading System below for an explanation of the GKD trading system)
**the backtest data rendered to the chart above and all screenshots below use $5 commission per trade and 10% equity per trade with $1 million initial capital**
█ GKD-BT Optimizer SCSC Backtest
The GKD-BT Optimizer SCSC Backtest is a comprehensive backtesting module designed to optimize the combination of key GKD indicators within AlgxTrading's "Giga Kaleidoscope Modularized Trading System." This module facilitates precise strategy refinement by allowing traders to configure and optimize the following critical GKD indicators:
GKD-B Baseline
GKD-V Volatility/Volume
GKD-C Confirmation 1
GKD-C Continuation
Each indicator is equipped with an "Optimizer" mode, enabling dynamic feedback and iterative improvements directly into the backtesting environment. This integrated approach ensures that each component contributes effectively to the overall strategy, providing a robust framework for achieving optimized trading outcomes.
The GKD-BT Optimizer supports granular test configurations including a single take profit and stop loss setting, and allows for targeted testing within specified date ranges to simulate forward testing with historical data. This feature is essential for evaluating the resilience and effectiveness of trading strategies under various market conditions.
Furthermore, the module is designed with user-centric features such as:
Customizable Trading Panel: Displays critical backtest results and trade statistics, which can be shown or hidden as per user preference.
Highlighting Thresholds: Users can set thresholds for Total Percent Wins, Percent Profitable, and Profit Factor, which helps in quickly identifying the most relevant metrics for analysis.
The detailed setup ensures that traders can not only adjust their strategies based on historical performance but also fine-tune their approach to meet specific trading objectives.
🔶 To configure this indicator: ***all GKD indicators listed below are all included in the AlgxTrading trading system package***
1. Add GKD-C Confirmation, GKD-B Baseline, GKD-V Volatility/Volume, and GKD-C Continuation to your chart
2. In the GKD-B Baseline indicator, change "Baseline Type" to "Optimizer"
3. In the GKD-V Volatility/Volume indicator, change "Volatility/Volume Type" to "Optimizer"
4. In the GKD-C Confirmation 1 indicator, change "Confirmation Type" to "Optimizer"
5. In the GKD-C Continuation indicator, change "Confirmation Type" to "Optimizer"
An example of steps 2-5. In the screenshot example below, we change the value "Confirmation Type" in the GKD-C Fisher Transform indicator to "Optimizer"
6. In the GKD-BT Optimizer SCSC Backtest, import the value "Input into NEW GKD-BT Backtest" from the GKD-B Baseline indicator into the field "Import GKD-B Baseline indicator"
7. In the GKD-BT Optimizer SCSC Backtest, import the value "Input into NEW GKD-BT Backtest" from the GKD-V Volatility/Volume indicator into the field "Import GKD-V Volatility/Volume indicator"
8. In the GKD-BT Optimizer SCSC Backtest, import the value "Input into NEW GKD-BT Backtest" from the GKD-C Confirmation 1 indicator into the field "Import GKD-C Confirmation 1 indicator"
9. In the GKD-BT Optimizer SCSC Backtest, import the value "Input into NEW GKD-BT Backtest" from the GKD-C Continuation indicator into the field "Import GKD-C Continuation indicator"
An example of steps 6-9. In the screenshot example below, we import the value "Input into NEW GKD-BT Backtest" from the GKD-C Fisher Transform indicator into the GKD-BT Optimizer SCSC Backtest
10. Decide which of the 5 indicators you wish to optimize in first in the GKD-BT Optimizer SCSC Backtest. Change the value of the import from "Input into NEW GKD-BT Backtest" to "Input into NEW GKD-BT Optimizer Signals"
An example of step 10. In the screenshot example below, we chose to optimize the Confirmation 1 indicator, the GKD-C Fisher Transform. We change the value of the field "Import GKD-C Confirmation 1 indicator" from "Input into NEW GKD-BT Backtest" to "Input into NEW GKD-BT Optimizer Signals"
11. In the GKD-BT Optimizer SCSC Backtest and under the "Optimization Settings", use the dropdown menu "Optimization Indicator" to select the type of indicator you selected from step 12 above: "Baseline", "Volatility/Volume", "Confirmation 1", or "Continuation"
12. In the GKD-BT Optimizer SCSC Backtest and under the "Optimization Settings", import the value "Input into NEW GKD-BT Optimizer Start" from the indicator you selected to optimize in step 12 above into the field "Import Optimization Indicator Start"
13. In the GKD-BT Optimizer SCSC Backtest and under the "Optimization Settings", import the value "Input into NEW GKD-BT Optimizer Skip" from the indicator you selected to optimize in step 12 above into the field "Import Optimization Indicator Skip"
An example of step 11. In the screenshot example below, we select "Confirmation 1" from the "Optimization Indicator" dropdown menu
An example of steps 12 and 13. In the screenshot example below, we import "Import Optimization Indicator Start" and "Import Optimization Indicator Skip" from the GKD-C Fisher Transform indicator into their respective fields
🔶 This backtest includes the following metrics
Net profit: Overall profit or loss achieved.
Total Closed Trades: Total number of closed trades, both winning and losing.
Total Percent Wins: Total wins, whether long or short, for the selected time interval regardless of commissions and other profit-modifying addons.
Percent Profitable: Total wins, whether long or short, that are also profitable, taking commissions into account.
Profit Factor: The ratio of gross profits to gross losses, indicating how much money the strategy made for every unit of money it lost.
Average Profit per Trade: The average gain or loss per trade, calculated by dividing the net profit by the total number of closed trades.
Average Number of Bars in Trade: The average number of bars that elapsed during trades for all closed trades.
🔶 Summary of notable settings not already explained above
🔹 Backtest Properties
These settings define the financial and logistical parameters of the trading simulation, including:
Initial Capital: Specifies the starting balance for the backtest, setting the baseline for measuring profitability and loss.
Order Size: Determines the size of trades, which can be fixed or a percentage of the equity, affecting risk and return.
Order Type: Chooses between fixed contract sizes or a percentage-based order size, allowing for static or dynamic trading volumes.
Commission per Order: Accounts for trading costs, subtracting these from profits to provide a more accurate net performance result.
🔹 Signal Qualifiers
This group of settings establishes criteria related to the strategy's Baseline, and Volatility/Volume indicators in relation to the GKD-C Confirmation 1 indicator, which is crucial for validating trade signals. These include:
Maximum Allowable Post Signal Baseline Cross Bars Back: Sets the maximum number of bars that can elapse after a signal generated by a GKD-C Confirmation 1 indicator triggers. If the GKD-C Confirmation 1 indicator generates a long/short signal that doesn't yet agree with the trend position of the Baseline, then should the Baseline "catch-up" to the long/short trend of the GKD-C Confirmation 1 indicator within the number of bars specified by this setting, then a signal is generated.
Maximum Allowable Post Signal Volatility/Volume Cross Bars Back: Sets the maximum number of bars that can elapse after a signal generated by a GKD-C Confirmation 1 indicator triggers. If the GKD-C Confirmation 1 indicator generates a long/short signal that doesn't yet agree with the position of the Volatility/Volume, then should the Volatility/Volume "catch-up" with the long/short of the GKD-C Confirmation 1 indicator within the number of bars specified by this setting, then a signal is generated.
🔹 Signal Settings
Signal Options: These settings allow users to toggle the visibility of different types of entries based on the strategy criteria, such as standard entries, baseline entries, and continuation entries.
Standard Entry Rules Settings: Detailed criteria for standard entries can be customized here, including conditions on baseline agreement, price within specific zones, and agreement with other confirmation indicators.
1-Candle Rule Standard Entry Rules Settings: Similar to standard entries, but with a focus on conditions that must be met within a one-candle timeframe.
Baseline Entry Rules Settings: Specifies rules for entries based on the baseline, including conditions on confirmation agreement and price zones.
Volatility/Volume Entry Rules Settings: This includes settings for entries based on volatility or volume conditions, with specific rules on confirmation agreement and baseline agreement.
Continuation Entry Rules Settings: This group outlines the conditions for continuation entries, focusing on agreement with baseline and confirmation indicators since the entry signal trigger.
🔹 Volatility Settings
Volatility PnL Settings: Parameters for defining the type of volatility measure to use, its period, and multipliers for profit and stop levels.
Volatility Types Included
Standard Deviation of Logarithmic Returns: Quantifies asset volatility using the standard deviation applied to logarithmic returns, capturing symmetric price movements and financial returns' compound nature.
Exponential Weighted Moving Average (EWMA) for Volatility: Focuses on recent market information by applying exponentially decreasing weights to squared logarithmic returns, offering a dynamic view of market volatility.
Roger-Satchell Volatility Measure: Estimates asset volatility by analyzing the high, low, open, and close prices, providing a nuanced view of intraday volatility and market dynamics.
Close-to-Close Volatility Measure: Calculates volatility based on the closing prices of stocks, offering a streamlined but limited perspective on market behavior.
Parkinson Volatility Measure: Enhances volatility estimation by including high and low prices of the trading day, capturing a more accurate reflection of intraday market movements.
Garman-Klass Volatility Measure: Incorporates open, high, low, and close prices for a comprehensive daily volatility measure, capturing significant price movements and market activity.
Yang-Zhang Volatility Measure: Offers an efficient estimation of stock market volatility by combining overnight and intraday price movements, capturing opening jumps and overall market dynamics.
Garman-Klass-Yang-Zhang Volatility Measure: Merges the benefits of Garman-Klass and Yang-Zhang measures, providing a fuller picture of market volatility including opening market reactions.
Pseudo GARCH(2,2) Volatility Model: Mimics a GARCH(2,2) process using exponential moving averages of squared returns, highlighting volatility shocks and their future impact.
ER-Adaptive Average True Range (ATR): Adjusts the ATR period length based on market efficiency, offering a volatility measure that adapts to changing market conditions.
Adaptive Deviation: Dynamically adjusts its calculation period to offer a nuanced measure of volatility that responds to the market's intrinsic rhythms.
Median Absolute Deviation (MAD): Provides a robust measure of statistical variability, focusing on deviations from the median price, offering resilience against outliers.
Mean Absolute Deviation (MAD): Measures the average magnitude of deviations from the mean price, facilitating a straightforward understanding of volatility.
ATR (Average True Range): Finds the average of true ranges over a specified period, indicating the expected price movement and market volatility.
True Range Double (TRD): Offers a nuanced view of volatility by considering a broader range of price movements, identifying significant market sentiment shifts.
🔹 Other Settings
Backtest Dates: Users can specify the timeframe for the backtest, including start and end dates, as well as the acceptable entry time window.
Volatility Inputs: Additional settings related to volatility calculations, such as static percent, internal filter period for median absolute deviation, and parameters for specific volatility models.
UI Options: Settings to customize the user interface, including table activation, date panel visibility, and aesthetics like color and text size.
Export Options: Allows users to select the type of data to export from the backtest, focusing on metrics like net profit, total closed trades, and average profit per trade.
█ Giga Kaleidoscope (GKD) Modularized Trading System
The GKD Trading System is a comprehensive, algorithmic trading framework from AlgxTrading, designed to optimize trading strategies across various market conditions. It employs a modular approach, incorporating elements such as volatility assessment, trend identification through a baseline, multiple confirmation strategies for signal accuracy, and volume analysis. Key components also include specialized strategies for entry and exit, enabling precise trade execution. The system allows for extensive backtesting, providing traders with the ability to evaluate the effectiveness of their strategies using historical data. Aimed at reducing setup time, the GKD system empowers traders to focus more on strategy refinement and execution, leveraging a wide array of technical indicators for informed decision-making.
🔶 Core components of a GKD Algorithmic Trading System
Each GKD indicator is denoted with a module identifier of either: GKD-BT, GKD-B, GKD-C, GKD-V, GKD-M, or GKD-E. This allows traders to understand to which module each indicator belongs and where each indicator fits into the GKD system. The GKD algorithm is built on the principles of trend, momentum, and volatility. There are eight core components in the GKD trading algorithm:
🔹 Volatility - In the GKD trading system, volatility is used as a part of the system to help determine the appropriate stop loss and take profit levels for a trade. There are 17+ different types of volatility available in the GKD system including Average True Range (ATR), True Range Double (TRD), Close-to-Close, Garman-Klass, and more.
🔹 Baseline (GKD-B) - The baseline is essentially a moving average and is used to determine the overall direction of the market. The baseline in the GKD trading system is used to filter out trades that are not in line with the long-term trend of the market. The baseline is plotted on the chart along with other GKD indicators.
Trades are only taken when the price is in the same direction as the baseline. For example, if the baseline is sloping upwards or price is above the baseline, then only long trades are taken, and if the baseline is sloping downwards or price is below the baseline, then only short trades are taken. This approach helps to ensure that trades are in line with the overall trend of the market, and reduces the risk of entering trades that are likely to fail.
🔹 Confirmation 1, Confirmation 2, Continuation (GKD-C) - The GKD trading system incorporates technical confirmation indicators for the generation of its primary long and short signals, essential for its operation.
The GKD trading system distinguishes three specific categories. The first category, Confirmation 1 , encompasses technical indicators designed to identify trends and generate explicit trading signals. The second category, Confirmation 2 , a technical indicator used to identify trends; this type of indicator is primarily used to filter the Confirmation 1 indicator signals; however, this type of confirmation indicator also generates signals*. Lastly, the Continuation category includes technical indicators used in conjunction with Confirmation 1 and Confirmation 2 to generate a special type of trading signal called a "Continuation"
In a full GKD trading system all three categories generate signals. (see the section “GKD Trading System Signals” below)
🔹 Volatility/Volume (GKD-V) - Volatility/Volume indicators are used to measure the amount of buying and selling activity in a market. They are based on the trading Volatility/Volume of the market, and can provide information about the strength of the trend. In the GKD trading system, Volatility/Volume indicators are used to confirm trading signals generated by the various other GKD indicators. In the GKD trading system, Volatility is a proxy for Volume and vice versa.
Volatility/Volume indicators reduce the risk of false signals and improve the overall profitability of trades. These indicators can provide additional information about the market that is not captured by GKD-C confirmation and GKD-B baseline indicators.
🔹 Exit (GKD-E) - The exit indicator in the GKD system is an indicator that is deemed effective at identifying optimal exit points. The purpose of the exit indicator is to identify when a trend is likely to reverse or when the market conditions have changed, signaling the need to exit a trade. By using an exit indicator, traders can manage their risk and prevent significant losses.
🔹 Backtest (GKD-BT) - The GKD-BT backtest indicators link all other GKD-C, GKD-B, GKD-E, GKD-V, and GKD-M components together to create a GKD trading system. GKD-BT backtests generate signals (see the section “GKD Trading System Signals” below) from the confluence of various GKD indicators that are imported into the GKD-BT backtest. Backtest types include: GKD-BT solo and full GKD backtest strategies used for a single ticker; GKD-BT optimizers used to optimize a single indicator or the full GKD trading system; GKD-BT Multi-ticker used to backtest a single indicator or the full GKD trading system across up to ten tickers; GKD-BT exotic backtests like CC, Baseline, and Giga Stacks used to test confluence between GKD components to then be injected into a core GKD-BT Multi-ticker backtest or single ticker strategy.
🔹 Metamorphosis (GKD-M) ** - The concept of a metamorphosis indicator involves the integration of two or more GKD indicators to generate a compound signal. This is achieved by evaluating the accuracy of each indicator and selecting the signal from the indicator with the highest accuracy. As an illustration, let's consider a scenario where we calculate the accuracy of 10 indicators and choose the signal from the indicator that demonstrates the highest accuracy.
The resulting output from the metamorphosis indicator can then be utilized in a GKD-BT backtest by occupying a slot that aligns with the purpose of the metamorphosis indicator. The slot can be a GKD-B, GKD-C, GKD-E, or GKD-V slot, depending on the specific requirements and objectives of the indicator. This allows for seamless integration and utilization of the compound signal within the GKD-BT framework.
*see the section “GKD Trading System Signals” below
**not a required component of the GKD algorithm
🔶 What does the application of the GKD trading system look like?
Example trading system:
Volatility: Average True Range (ATR) (selectable in all backtests and other related GKD indicators)
GKD-B Baseline: GKD-B Multi-Ticker Baseline using Hull Moving Average
GKD-C Confirmation 1 : GKD-C Advance Trend Pressure
GKD-C Confirmation 2: GKD-C Dorsey Inertia
GKD-C Continuation: GKD-C Stochastic of RSX
GKD-V Volatility/Volume: GKD-V Damiani Volatmeter
GKD-E Exit: GKD-E MFI
GKD-BT Backtest: GKD-BT Multi-Ticker Full GKD Backtest
GKD-M Metamorphosis: GKD-M Baseline Optimizer
**all indicators mentioned above are included in the same AlgxTrading package**
Each module is passed to a GKD-BT backtest module. In the backtest module, all components are combined to formulate trading signals and statistical output. This chaining of indicators requires that each module conform to AlgxTrading's GKD protocol, therefore allowing for the testing of every possible combination of technical indicators that make up the various indictor types in the GKD algorithm.
🔶 GKD Trading System Signals
Standard Entry requires a sequence of conditions including a confirmation signal from GKD-C, baseline agreement, price criteria related to the Goldie Locks Zone, and concurrence from a second confirmation and volatility/volume indicators.
1-Candle Standard Entry introduces a two-phase process where initial conditions must be met, followed by a retraction in price and additional confirmations in the subsequent candle, including baseline, confirmations 1 and 2, and volatility/volume criteria.
Baseline Entry focuses on signals generated by the GKD-B Baseline, requiring agreement from confirmation signals, specific price conditions within the Goldie Locks Zone, and a timing condition related to the confirmation 1 signal.
1-Candle Baseline Entry mirrors the baseline entry but adds a requirement for a price retraction and subsequent confirmations in the following candle, maintaining the focus on the baseline's guidance.
Volatility/Volume Entry is predicated on signals from volatility/volume indicators, requiring support from confirmations, price criteria within the Goldie Locks Zone, baseline agreement, and a timing condition for the confirmation 1 signal.
1-Candle Volatility/Volume Entry adapts the volatility/volume entry to include a phase of initial signal and agreement, followed by a retracement phase that seeks further agreement from the system's components in the subsequent candle.
Confirmation 2 Entry is based on the second confirmation signal, requiring the first confirmation's agreement, specific price criteria, agreement from volatility/volume indicators, and baseline, with a timing condition for the confirmation 1 signal.
1-Candle Confirmation 2 Entry adds a retracement requirement to the confirmation 2 entry, necessitating additional agreements from the system's components in the candle following the signal.
PullBack Entry initiates with a baseline signal and agreement from the first confirmation, with a price condition related to volatility. It then looks for price to return within the Goldie Locks Zone and seeks further agreement from the system's components in the subsequent candle.
Continuation Entry allows for the continuation of an active position, based on a previously triggered entry strategy. It requires that the baseline hasn't crossed since the initial trigger, alongside ongoing agreements from confirmations and the baseline.
█ Conclusion
The GKD-BT Optimizer SCSC Backtest is a critical tool within the Giga Kaleidoscope Modularized Trading System, designed for precise strategy refinement and evaluation within the GKD framework. It enables the optimization and testing of various trading indicators and strategies under different market conditions. The module's design facilitates detailed analysis of individual trading components' performance, allowing for the optimization of indicators like Baseline, Volatility/Volume, Confirmation, and Continuation. This optimization process aids traders in identifying the most effective configurations, thereby enhancing trading outcomes and strategy efficiency within the GKD ecosystem.
█ How to Access
You can see the Author's Instructions below to learn how to get access.

GKD-BT Optimizer Full GKD Backtest [Loxx]The Giga Kaleidoscope GKD-BT Optimizer Full GKD Backtest is a Backtest module included in AlgxTrading's "Giga Kaleidoscope Modularized Trading System." (see the section Giga Kaleidoscope (GKD) Modularized Trading System below for an explanation of the GKD trading system)
**the backtest data rendered to the chart above and all screenshots below use $5 commission per trade and 10% equity per trade with $1 million initial capital**
█ GKD-BT Optimizer Full GKD Backtest
The GKD-BT Optimizer Full GKD Backtest is a comprehensive backtesting module designed to optimize the combination of key GKD indicators within AlgxTrading's "Giga Kaleidoscope Modularized Trading System." This module facilitates precise strategy refinement by allowing traders to configure and optimize the following critical GKD indicators:
GKD-B Baseline
GKD-V Volatility/Volume
GKD-C Confirmation 1
GKD-C Confirmation 2
GKD-C Continuation
Each indicator is equipped with an "Optimizer" mode, enabling dynamic feedback and iterative improvements directly into the backtesting environment. This integrated approach ensures that each component contributes effectively to the overall strategy, providing a robust framework for achieving optimized trading outcomes.
The GKD-BT Optimizer supports granular test configurations including a single take profit and stop loss setting, and allows for targeted testing within specified date ranges to simulate forward testing with historical data. This feature is essential for evaluating the resilience and effectiveness of trading strategies under various market conditions.
Furthermore, the module is designed with user-centric features such as:
Customizable Trading Panel: Displays critical backtest results and trade statistics, which can be shown or hidden as per user preference.
Highlighting Thresholds: Users can set thresholds for Total Percent Wins, Percent Profitable, and Profit Factor, which helps in quickly identifying the most relevant metrics for analysis.
The detailed setup ensures that traders can not only adjust their strategies based on historical performance but also fine-tune their approach to meet specific trading objectives.
🔶 To configure this indicator: ***all GKD indicators listed below are all included in the AlgxTrading trading system package***
1. Add GKD-C Confirmation, GKD-B Baseline, GKD-V Volatility/Volume, GKD-C Confirmation 2, and GKD-C Continuation to your chart
2. In the GKD-B Baseline indicator, change "Baseline Type" to "Optimizer"
3. In the GKD-V Volatility/Volume indicator, change "Volatility/Volume Type" to "Optimizer"
4. In the GKD-C Confirmation 1 indicator, change "Confirmation Type" to "Optimizer"
5. In the GKD-C Confirmation 2 indicator, change "Confirmation Type" to "Optimizer"
6. In the GKD-C Continuation indicator, change "Confirmation Type" to "Optimizer"
An example of steps 2-6. In the screenshot example below, we change the value "Confirmation Type" in the GKD-C Fisher Transform indicator to "Optimizer"
7. In the GKD-BT Optimizer Full GKD Backtest, import the value "Input into NEW GKD-BT Backtest" from the GKD-B Baseline indicator into the field "Import GKD-B Baseline indicator"
8. In the GKD-BT Optimizer Full GKD Backtest, import the value "Input into NEW GKD-BT Backtest" from the GKD-V Volatility/Volume indicator into the field "Import GKD-V Volatility/Volume indicator"
9. In the GKD-BT Optimizer Full GKD Backtest, import the value "Input into NEW GKD-BT Backtest" from the GKD-C Confirmation 1 indicator into the field "Import GKD-C Confirmation 1 indicator"
10. In the GKD-BT Optimizer Full GKD Backtest, import the value "Input into NEW GKD-BT Backtest" from the GKD-C Confirmation 2 indicator into the field "Import GKD-C Confirmation 2 indicator"
11. In the GKD-BT Optimizer Full GKD Backtest, import the value "Input into NEW GKD-BT Backtest" from the GKD-C Continuation indicator into the field "Import GKD-C Continuation indicator"
An example of steps 7-11. In the screenshot example below, we import the value "Input into NEW GKD-BT Backtest" from the GKD-C Coppock Curve indicator into the GKD-BT Optimizer Full GKD Backtest
12. Decide which of the 5 indicators you wish to optimize in first in the GKD-BT Optimizer Full GKD Backtest. Change the value of the import from "Input into NEW GKD-BT Backtest" to "Input into NEW GKD-BT Optimizer Signals"
An example of step 12. In the screenshot example below, we chose to optimize the Confirmation 1 indicator, the GKD-C Fisher Transform. We change the value of the field "Import GKD-C Confirmation 1 indicator" from "Input into NEW GKD-BT Backtest" to "Input into NEW GKD-BT Optimizer Signals"
13. In the GKD-BT Optimizer Full GKD Backtest and under the "Optimization Settings", use the dropdown menu "Optimization Indicator" to select the type of indicator you selected from step 12 above: "Baseline", "Volatility/Volume", "Confirmation 1", "Confirmation 2", or "Continuation"
14. In the GKD-BT Optimizer Full GKD Backtest and under the "Optimization Settings", import the value "Input into NEW GKD-BT Optimizer Start" from the indicator you selected to optimize in step 12 above into the field "Import Optimization Indicator Start"
15. In the GKD-BT Optimizer Full GKD Backtest and under the "Optimization Settings", import the value "Input into NEW GKD-BT Optimizer Skip" from the indicator you selected to optimize in step 12 above into the field "Import Optimization Indicator Skip"
An example of step 13. In the screenshot example below, we select "Confirmation 1" from the "Optimization Indicator" dropdown menu
An example of steps 14 and 15. In the screenshot example below, we import "Import Optimization Indicator Start" and "Import Optimization Indicator Skip" from the GKD-C Fisher Transform indicator into their respective fields
🔶 This backtest includes the following metrics
Net profit: Overall profit or loss achieved.
Total Closed Trades: Total number of closed trades, both winning and losing.
Total Percent Wins: Total wins, whether long or short, for the selected time interval regardless of commissions and other profit-modifying addons.
Percent Profitable: Total wins, whether long or short, that are also profitable, taking commissions into account.
Profit Factor: The ratio of gross profits to gross losses, indicating how much money the strategy made for every unit of money it lost.
Average Profit per Trade: The average gain or loss per trade, calculated by dividing the net profit by the total number of closed trades.
Average Number of Bars in Trade: The average number of bars that elapsed during trades for all closed trades.
🔶 Summary of notable settings not already explained above
🔹 Backtest Properties
These settings define the financial and logistical parameters of the trading simulation, including:
Initial Capital: Specifies the starting balance for the backtest, setting the baseline for measuring profitability and loss.
Order Size: Determines the size of trades, which can be fixed or a percentage of the equity, affecting risk and return.
Order Type: Chooses between fixed contract sizes or a percentage-based order size, allowing for static or dynamic trading volumes.
Commission per Order: Accounts for trading costs, subtracting these from profits to provide a more accurate net performance result.
🔹 Signal Qualifiers
This group of settings establishes criteria related to the strategy's Baseline, Volatility/Volume, and Confirmation 2 indicators in relation to the GKD-C Confirmation 1 indicator, which is crucial for validating trade signals. These include:
Maximum Allowable Post Signal Baseline Cross Bars Back: Sets the maximum number of bars that can elapse after a signal generated by a GKD-C Confirmation 1 indicator triggers. If the GKD-C Confirmation 1 indicator generates a long/short signal that doesn't yet agree with the trend position of the Baseline, then should the Baseline "catch-up" to the long/short trend of the GKD-C Confirmation 1 indicator within the number of bars specified by this setting, then a signal is generated.
Maximum Allowable Post Signal Volatility/Volume Cross Bars Back: Sets the maximum number of bars that can elapse after a signal generated by a GKD-C Confirmation 1 indicator triggers. If the GKD-C Confirmation 1 indicator generates a long/short signal that doesn't yet agree with the position of the Volatility/Volume, then should the Volatility/Volume "catch-up" with the long/short of the GKD-C Confirmation 1 indicator within the number of bars specified by this setting, then a signal is generated.
Maximum Allowable Post Signal Confirmation 2 Cross Bars Back: Sets the maximum number of bars that can elapse after a signal generated by a GKD-C Confirmation 1 indicator triggers. If the GKD-C Confirmation 1 indicator generates a long/short signal that doesn't yet agree with the trend position of the Confirmation 2, then should the Confirmation 2 "catch-up" to the long/short trend of the GKD-C Confirmation 1 indicator within the number of bars specified by this setting, then a signal is generated.
🔹 Signal Settings
Signal Options: These settings allow users to toggle the visibility of different types of entries based on the strategy criteria, such as standard entries, baseline entries, and continuation entries.
Standard Entry Rules Settings: Detailed criteria for standard entries can be customized here, including conditions on baseline agreement, price within specific zones, and agreement with other confirmation indicators.
1-Candle Rule Standard Entry Rules Settings: Similar to standard entries, but with a focus on conditions that must be met within a one-candle timeframe.
Baseline Entry Rules Settings: Specifies rules for entries based on the baseline, including conditions on confirmation agreement and price zones.
Volatility/Volume Entry Rules Settings: This includes settings for entries based on volatility or volume conditions, with specific rules on confirmation agreement and baseline agreement.
Confirmation 2 Entry Rules Settings: Settings here define the rules for entries based on a second confirmation indicator, detailing the required agreements and conditions.
Continuation Entry Rules Settings: This group outlines the conditions for continuation entries, focusing on agreement with baseline and confirmation indicators since the entry signal trigger.
🔹 Volatility Settings
Volatility PnL Settings: Parameters for defining the type of volatility measure to use, its period, and multipliers for profit and stop levels.
Volatility Types Included
Standard Deviation of Logarithmic Returns: Quantifies asset volatility using the standard deviation applied to logarithmic returns, capturing symmetric price movements and financial returns' compound nature.
Exponential Weighted Moving Average (EWMA) for Volatility: Focuses on recent market information by applying exponentially decreasing weights to squared logarithmic returns, offering a dynamic view of market volatility.
Roger-Satchell Volatility Measure: Estimates asset volatility by analyzing the high, low, open, and close prices, providing a nuanced view of intraday volatility and market dynamics.
Close-to-Close Volatility Measure: Calculates volatility based on the closing prices of stocks, offering a streamlined but limited perspective on market behavior.
Parkinson Volatility Measure: Enhances volatility estimation by including high and low prices of the trading day, capturing a more accurate reflection of intraday market movements.
Garman-Klass Volatility Measure: Incorporates open, high, low, and close prices for a comprehensive daily volatility measure, capturing significant price movements and market activity.
Yang-Zhang Volatility Measure: Offers an efficient estimation of stock market volatility by combining overnight and intraday price movements, capturing opening jumps and overall market dynamics.
Garman-Klass-Yang-Zhang Volatility Measure: Merges the benefits of Garman-Klass and Yang-Zhang measures, providing a fuller picture of market volatility including opening market reactions.
Pseudo GARCH(2,2) Volatility Model: Mimics a GARCH(2,2) process using exponential moving averages of squared returns, highlighting volatility shocks and their future impact.
ER-Adaptive Average True Range (ATR): Adjusts the ATR period length based on market efficiency, offering a volatility measure that adapts to changing market conditions.
Adaptive Deviation: Dynamically adjusts its calculation period to offer a nuanced measure of volatility that responds to the market's intrinsic rhythms.
Median Absolute Deviation (MAD): Provides a robust measure of statistical variability, focusing on deviations from the median price, offering resilience against outliers.
Mean Absolute Deviation (MAD): Measures the average magnitude of deviations from the mean price, facilitating a straightforward understanding of volatility.
ATR (Average True Range): Finds the average of true ranges over a specified period, indicating the expected price movement and market volatility.
True Range Double (TRD): Offers a nuanced view of volatility by considering a broader range of price movements, identifying significant market sentiment shifts.
🔹 Other Settings
Backtest Dates: Users can specify the timeframe for the backtest, including start and end dates, as well as the acceptable entry time window.
Volatility Inputs: Additional settings related to volatility calculations, such as static percent, internal filter period for median absolute deviation, and parameters for specific volatility models.
UI Options: Settings to customize the user interface, including table activation, date panel visibility, and aesthetics like color and text size.
Export Options: Allows users to select the type of data to export from the backtest, focusing on metrics like net profit, total closed trades, and average profit per trade.
█ Giga Kaleidoscope (GKD) Modularized Trading System
The GKD Trading System is a comprehensive, algorithmic trading framework from AlgxTrading, designed to optimize trading strategies across various market conditions. It employs a modular approach, incorporating elements such as volatility assessment, trend identification through a baseline, multiple confirmation strategies for signal accuracy, and volume analysis. Key components also include specialized strategies for entry and exit, enabling precise trade execution. The system allows for extensive backtesting, providing traders with the ability to evaluate the effectiveness of their strategies using historical data. Aimed at reducing setup time, the GKD system empowers traders to focus more on strategy refinement and execution, leveraging a wide array of technical indicators for informed decision-making.
🔶 Core components of a GKD Algorithmic Trading System
Each GKD indicator is denoted with a module identifier of either: GKD-BT, GKD-B, GKD-C, GKD-V, GKD-M, or GKD-E. This allows traders to understand to which module each indicator belongs and where each indicator fits into the GKD system. The GKD algorithm is built on the principles of trend, momentum, and volatility. There are eight core components in the GKD trading algorithm:
🔹 Volatility - In the GKD trading system, volatility is used as a part of the system to help determine the appropriate stop loss and take profit levels for a trade. There are 17+ different types of volatility available in the GKD system including Average True Range (ATR), True Range Double (TRD), Close-to-Close, Garman-Klass, and more.
🔹 Baseline (GKD-B) - The baseline is essentially a moving average and is used to determine the overall direction of the market. The baseline in the GKD trading system is used to filter out trades that are not in line with the long-term trend of the market. The baseline is plotted on the chart along with other GKD indicators.
Trades are only taken when the price is in the same direction as the baseline. For example, if the baseline is sloping upwards or price is above the baseline, then only long trades are taken, and if the baseline is sloping downwards or price is below the baseline, then only short trades are taken. This approach helps to ensure that trades are in line with the overall trend of the market, and reduces the risk of entering trades that are likely to fail.
🔹 Confirmation 1, Confirmation 2, Continuation (GKD-C) - The GKD trading system incorporates technical confirmation indicators for the generation of its primary long and short signals, essential for its operation.
The GKD trading system distinguishes three specific categories. The first category, Confirmation 1 , encompasses technical indicators designed to identify trends and generate explicit trading signals. The second category, Confirmation 2 , a technical indicator used to identify trends; this type of indicator is primarily used to filter the Confirmation 1 indicator signals; however, this type of confirmation indicator also generates signals*. Lastly, the Continuation category includes technical indicators used in conjunction with Confirmation 1 and Confirmation 2 to generate a special type of trading signal called a "Continuation"
In a full GKD trading system all three categories generate signals. (see the section “GKD Trading System Signals” below)
🔹 Volatility/Volume (GKD-V) - Volatility/Volume indicators are used to measure the amount of buying and selling activity in a market. They are based on the trading Volatility/Volume of the market, and can provide information about the strength of the trend. In the GKD trading system, Volatility/Volume indicators are used to confirm trading signals generated by the various other GKD indicators. In the GKD trading system, Volatility is a proxy for Volume and vice versa.
Volatility/Volume indicators reduce the risk of false signals and improve the overall profitability of trades. These indicators can provide additional information about the market that is not captured by GKD-C confirmation and GKD-B baseline indicators.
🔹 Exit (GKD-E) - The exit indicator in the GKD system is an indicator that is deemed effective at identifying optimal exit points. The purpose of the exit indicator is to identify when a trend is likely to reverse or when the market conditions have changed, signaling the need to exit a trade. By using an exit indicator, traders can manage their risk and prevent significant losses.
🔹 Backtest (GKD-BT) - The GKD-BT backtest indicators link all other GKD-C, GKD-B, GKD-E, GKD-V, and GKD-M components together to create a GKD trading system. GKD-BT backtests generate signals (see the section “GKD Trading System Signals” below) from the confluence of various GKD indicators that are imported into the GKD-BT backtest. Backtest types include: GKD-BT solo and full GKD backtest strategies used for a single ticker; GKD-BT optimizers used to optimize a single indicator or the full GKD trading system; GKD-BT Multi-ticker used to backtest a single indicator or the full GKD trading system across up to ten tickers; GKD-BT exotic backtests like CC, Baseline, and Giga Stacks used to test confluence between GKD components to then be injected into a core GKD-BT Multi-ticker backtest or single ticker strategy.
🔹 Metamorphosis (GKD-M) ** - The concept of a metamorphosis indicator involves the integration of two or more GKD indicators to generate a compound signal. This is achieved by evaluating the accuracy of each indicator and selecting the signal from the indicator with the highest accuracy. As an illustration, let's consider a scenario where we calculate the accuracy of 10 indicators and choose the signal from the indicator that demonstrates the highest accuracy.
The resulting output from the metamorphosis indicator can then be utilized in a GKD-BT backtest by occupying a slot that aligns with the purpose of the metamorphosis indicator. The slot can be a GKD-B, GKD-C, GKD-E, or GKD-V slot, depending on the specific requirements and objectives of the indicator. This allows for seamless integration and utilization of the compound signal within the GKD-BT framework.
*see the section “GKD Trading System Signals” below
**not a required component of the GKD algorithm
🔶 What does the application of the GKD trading system look like?
Example trading system:
Volatility: Average True Range (ATR) (selectable in all backtests and other related GKD indicators)
GKD-B Baseline: GKD-B Multi-Ticker Baseline using Hull Moving Average
GKD-C Confirmation 1 : GKD-C Advance Trend Pressure
GKD-C Confirmation 2: GKD-C Dorsey Inertia
GKD-C Continuation: GKD-C Stochastic of RSX
GKD-V Volatility/Volume: GKD-V Damiani Volatmeter
GKD-E Exit: GKD-E MFI
GKD-BT Backtest: GKD-BT Multi-Ticker Full GKD Backtest
GKD-M Metamorphosis: GKD-M Baseline Optimizer
**all indicators mentioned above are included in the same AlgxTrading package**
Each module is passed to a GKD-BT backtest module. In the backtest module, all components are combined to formulate trading signals and statistical output. This chaining of indicators requires that each module conform to AlgxTrading's GKD protocol, therefore allowing for the testing of every possible combination of technical indicators that make up the various indictor types in the GKD algorithm.
🔶 GKD Trading System Signals
Standard Entry requires a sequence of conditions including a confirmation signal from GKD-C, baseline agreement, price criteria related to the Goldie Locks Zone, and concurrence from a second confirmation and volatility/volume indicators.
1-Candle Standard Entry introduces a two-phase process where initial conditions must be met, followed by a retraction in price and additional confirmations in the subsequent candle, including baseline, confirmations 1 and 2, and volatility/volume criteria.
Baseline Entry focuses on signals generated by the GKD-B Baseline, requiring agreement from confirmation signals, specific price conditions within the Goldie Locks Zone, and a timing condition related to the confirmation 1 signal.
1-Candle Baseline Entry mirrors the baseline entry but adds a requirement for a price retraction and subsequent confirmations in the following candle, maintaining the focus on the baseline's guidance.
Volatility/Volume Entry is predicated on signals from volatility/volume indicators, requiring support from confirmations, price criteria within the Goldie Locks Zone, baseline agreement, and a timing condition for the confirmation 1 signal.
1-Candle Volatility/Volume Entry adapts the volatility/volume entry to include a phase of initial signal and agreement, followed by a retracement phase that seeks further agreement from the system's components in the subsequent candle.
Confirmation 2 Entry is based on the second confirmation signal, requiring the first confirmation's agreement, specific price criteria, agreement from volatility/volume indicators, and baseline, with a timing condition for the confirmation 1 signal.
1-Candle Confirmation 2 Entry adds a retracement requirement to the confirmation 2 entry, necessitating additional agreements from the system's components in the candle following the signal.
PullBack Entry initiates with a baseline signal and agreement from the first confirmation, with a price condition related to volatility. It then looks for price to return within the Goldie Locks Zone and seeks further agreement from the system's components in the subsequent candle.
Continuation Entry allows for the continuation of an active position, based on a previously triggered entry strategy. It requires that the baseline hasn't crossed since the initial trigger, alongside ongoing agreements from confirmations and the baseline.
█ Conclusion
The GKD-BT Optimizer Full GKD Backtest is a critical tool within the Giga Kaleidoscope Modularized Trading System, designed for precise strategy refinement and evaluation within the GKD framework. It enables the optimization and testing of various trading indicators and strategies under different market conditions. The module's design facilitates detailed analysis of individual trading components' performance, allowing for the optimization of indicators like Baseline, Volatility/Volume, Confirmation, and Continuation. This optimization process aids traders in identifying the most effective configurations, thereby enhancing trading outcomes and strategy efficiency within the GKD ecosystem.
█ How to Access
You can see the Author's Instructions below to learn how to get access.

GKD-BT Multi-Ticker Baseline Backtest [Loxx]The Giga Kaleidoscope GKD-BT Multi-Ticker Baseline Backtest is a backtesting module included in Loxx's "Giga Kaleidoscope Modularized Trading System."
█ Giga Kaleidoscope GKD-BT Multi-Ticker Baseline Backtest
The Multi-Ticker SCSC Backtest is a Solo Confirmation Super Complex backtest that allows traders to test GKD-B Multi-Ticker Baseline series baselines indicators filtered. The purpose of this backtest is to enable traders to quickly evaluate the viability of a Baseline across hundreds of tickers within 30-60 minutes.
The backtest module supports testing with 1 take profit and 1 stop loss. It also offers the option to limit testing to a specific date range, allowing simulated forward testing using historical data. This backtest module only includes standard long and short signals. Additionally, users can choose to display or hide a trading panel that provides relevant information about the backtest, statistics, and the current trade. Traders can also select a highlighting threshold for Total Percent Wins and Percent Profitable, and Profit Factor.
To use this indicator:
1. Import 1-10 tickers into the GKD-B Multi-Ticker Baseline indicator
2. Import the value "Input into NEW GKD-BT Multi-ticker Backtest" from the GKD-B Multi-Ticker Baseline indicator (Volatility-Adaptive, Stepped, etc.) into the GKD-BT Multi-Ticker Baseline Backtest.
3. Import the same 1-10 tickers from number step 1 above into the GKD-BT Multi-Ticker Baseline Backtest indicator into the text area field "Input Tickers separated by commas".
3. When importing tickers, ensure that you import the same type of tickers for all 1-10 tickers. For example, test only FX or Cryptocurrency or Stocks. Do not combine different tradable asset types.
4. Make sure that your chart is set to a ticker that corresponds to the tradable asset type. For cryptocurrency testing, set the chart to BTCUSDT. For Forex testing, set the chart to EURUSD.
This backtest includes the following metrics:
1. Net profit: Overall profit or loss achieved.
2. Total Closed Trades: Total number of closed trades, both winning and losing.
3. Total Percent Wins: Total wins, whether long or short, for the selected time interval regardless of commissions and other profit-modifying add-ons.
4. Percent Profitable: Total wins, whether long or short, that are also profitable, taking commissions into account.
5. Profit Factor: The ratio of gross profits to gross losses, indicating how much money the strategy made for every unit of money it lost.
6. Average Profit per Trade: The average gain or loss per trade, calculated by dividing the net profit by the total number of closed trades.
7. Average Number of Bars in Trade: The average number of bars that elapsed during trades for all closed trades.
Summary of notable settings:
Input Tickers separated by commas: Allows the user to input tickers separated by commas, specifying the symbols or tickers of financial instruments used in the backtest. The tickers should follow the format "EXCHANGE:TICKER" (e.g., "NASDAQ:AAPL, NYSE:MSFT").
Import GKD-B Baseline: Imports the "GKD-B Multi-Ticker Baseline" indicator.
Initial Capital: Represents the starting account balance for the backtest, denominated in the base currency of the trading account.
Order Size: Determines the quantity of contracts traded in each trade.
Order Type: Specifies the type of order used in the backtest, either "Contracts" or "% Equity."
Commission: Represents the commission per order or transaction cost incurred in each trade.
**the backtest data rendered to the chart above uses $5 commission per trade and 10% equity per trade with $1 million initial capital. Each backtest result for each ticker assumes these same inputs. The results are NOT cumulative, they are separate and isolated per ticker and trading side, long or short**
█ Volatility Types included
The GKD system utilizes volatility-based take profits and stop losses. Each take profit and stop loss is calculated as a multiple of volatility. You can change the values of the multipliers in the settings as well.
This module includes 17 types of volatility:
Close-to-Close
Parkinson
Garman-Klass
Rogers-Satchell
Yang-Zhang
Garman-Klass-Yang-Zhang
Exponential Weighted Moving Average
Standard Deviation of Log Returns
Pseudo GARCH(2,2)
Average True Range
True Range Double
Standard Deviation
Adaptive Deviation
Median Absolute Deviation
Efficiency-Ratio Adaptive ATR
Mean Absolute Deviation
Static Percent
Various volatility estimators and indicators that investors and traders can use to measure the dispersion or volatility of a financial instrument's price. Each estimator has its strengths and weaknesses, and the choice of estimator should depend on the specific needs and circumstances of the user.
Close-to-Close
Close-to-Close volatility is a classic and widely used volatility measure, sometimes referred to as historical volatility.
Volatility is an indicator of the speed of a stock price change. A stock with high volatility is one where the price changes rapidly and with a larger amplitude. The more volatile a stock is, the riskier it is.
Close-to-close historical volatility is calculated using only a stock's closing prices. It is the simplest volatility estimator. However, in many cases, it is not precise enough. Stock prices could jump significantly during a trading session and return to the opening value at the end. That means that a considerable amount of price information is not taken into account by close-to-close volatility.
Despite its drawbacks, Close-to-Close volatility is still useful in cases where the instrument doesn't have intraday prices. For example, mutual funds calculate their net asset values daily or weekly, and thus their prices are not suitable for more sophisticated volatility estimators.
Parkinson
Parkinson volatility is a volatility measure that uses the stock’s high and low price of the day.
The main difference between regular volatility and Parkinson volatility is that the latter uses high and low prices for a day, rather than only the closing price. This is useful as close-to-close prices could show little difference while large price movements could have occurred during the day. Thus, Parkinson's volatility is considered more precise and requires less data for calculation than close-to-close volatility.
One drawback of this estimator is that it doesn't take into account price movements after the market closes. Hence, it systematically undervalues volatility. This drawback is addressed in the Garman-Klass volatility estimator.
Garman-Klass
Garman-Klass is a volatility estimator that incorporates open, low, high, and close prices of a security.
Garman-Klass volatility extends Parkinson's volatility by taking into account the opening and closing prices. As markets are most active during the opening and closing of a trading session, it makes volatility estimation more accurate.
Garman and Klass also assumed that the process of price change follows a continuous diffusion process (Geometric Brownian motion). However, this assumption has several drawbacks. The method is not robust for opening jumps in price and trend movements.
Despite its drawbacks, the Garman-Klass estimator is still more effective than the basic formula since it takes into account not only the price at the beginning and end of the time interval but also intraday price extremes.
Researchers Rogers and Satchell have proposed a more efficient method for assessing historical volatility that takes into account price trends. See Rogers-Satchell Volatility for more detail.
Rogers-Satchell
Rogers-Satchell is an estimator for measuring the volatility of securities with an average return not equal to zero.
Unlike Parkinson and Garman-Klass estimators, Rogers-Satchell incorporates a drift term (mean return not equal to zero). As a result, it provides better volatility estimation when the underlying is trending.
The main disadvantage of this method is that it does not take into account price movements between trading sessions. This leads to an underestimation of volatility since price jumps periodically occur in the market precisely at the moments between sessions.
A more comprehensive estimator that also considers the gaps between sessions was developed based on the Rogers-Satchel formula in the 2000s by Yang-Zhang. See Yang Zhang Volatility for more detail.
Yang-Zhang
Yang Zhang is a historical volatility estimator that handles both opening jumps and the drift and has a minimum estimation error.
Yang-Zhang volatility can be thought of as a combination of the overnight (close-to-open volatility) and a weighted average of the Rogers-Satchell volatility and the day’s open-to-close volatility. It is considered to be 14 times more efficient than the close-to-close estimator.
Garman-Klass-Yang-Zhang
Garman-Klass-Yang-Zhang (GKYZ) volatility estimator incorporates the returns of open, high, low, and closing prices in its calculation.
GKYZ volatility estimator takes into account overnight jumps but not the trend, i.e., it assumes that the underlying asset follows a Geometric Brownian Motion (GBM) process with zero drift. Therefore, the GKYZ volatility estimator tends to overestimate the volatility when the drift is different from zero. However, for a GBM process, this estimator is eight times more efficient than the close-to-close volatility estimator.
Exponential Weighted Moving Average
The Exponentially Weighted Moving Average (EWMA) is a quantitative or statistical measure used to model or describe a time series. The EWMA is widely used in finance, with the main applications being technical analysis and volatility modeling.
The moving average is designed such that older observations are given lower weights. The weights decrease exponentially as the data point gets older – hence the name exponentially weighted.
The only decision a user of the EWMA must make is the parameter lambda. The parameter decides how important the current observation is in the calculation of the EWMA. The higher the value of lambda, the more closely the EWMA tracks the original time series.
Standard Deviation of Log Returns
This is the simplest calculation of volatility. It's the standard deviation of ln(close/close(1)).
Pseudo GARCH(2,2)
This is calculated using a short- and long-run mean of variance multiplied by ?.
avg(var;M) + (1 ? ?) avg(var;N) = 2?var/(M+1-(M-1)L) + 2(1-?)var/(M+1-(M-1)L)
Solving for ? can be done by minimizing the mean squared error of estimation; that is, regressing L^-1var - avg(var; N) against avg(var; M) - avg(var; N) and using the resulting beta estimate as ?.
Average True Range
The average true range (ATR) is a technical analysis indicator, introduced by market technician J. Welles Wilder Jr. in his book New Concepts in Technical Trading Systems, that measures market volatility by decomposing the entire range of an asset price for that period.
The true range indicator is taken as the greatest of the following: current high less the current low; the absolute value of the current high less the previous close; and the absolute value of the current low less the previous close. The ATR is then a moving average, generally using 14 days, of the true ranges.
True Range Double
A special case of ATR that attempts to correct for volatility skew.
Standard Deviation
Standard deviation is a statistic that measures the dispersion of a dataset relative to its mean and is calculated as the square root of the variance. The standard deviation is calculated as the square root of variance by determining each data point's deviation relative to the mean. If the data points are further from the mean, there is a higher deviation within the data set; thus, the more spread out the data, the higher the standard deviation.
Adaptive Deviation
By definition, the Standard Deviation (STD, also represented by the Greek letter sigma ? or the Latin letter s) is a measure that is used to quantify the amount of variation or dispersion of a set of data values. In technical analysis, we usually use it to measure the level of current volatility.
Standard Deviation is based on Simple Moving Average calculation for mean value. This version of standard deviation uses the properties of EMA to calculate what can be called a new type of deviation, and since it is based on EMA, we can call it EMA deviation. Additionally, Perry Kaufman's efficiency ratio is used to make it adaptive (since all EMA type calculations are nearly perfect for adapting).
The difference when compared to the standard is significant--not just because of EMA usage, but the efficiency ratio makes it a "bit more logical" in very volatile market conditions.
Median Absolute Deviation
The median absolute deviation is a measure of statistical dispersion. Moreover, the MAD is a robust statistic, being more resilient to outliers in a data set than the standard deviation. In the standard deviation, the distances from the mean are squared, so large deviations are weighted more heavily, and thus outliers can heavily influence it. In the MAD, the deviations of a small number of outliers are irrelevant.
Because the MAD is a more robust estimator of scale than the sample variance or standard deviation, it works better with distributions without a mean or variance, such as the Cauchy distribution.
For this indicator, a manual recreation of the quantile function in Pine Script is used. This is so users have a full inside view into how this is calculated.
Efficiency-Ratio Adaptive ATR
Average True Range (ATR) is a widely used indicator for many occasions in technical analysis. It is calculated as the RMA of the true range. This version adds a "twist": it uses Perry Kaufman's Efficiency Ratio to calculate adaptive true range.
Mean Absolute Deviation
The mean absolute deviation (MAD) is a measure of variability that indicates the average distance between observations and their mean. MAD uses the original units of the data, which simplifies interpretation. Larger values signify that the data points spread out further from the average. Conversely, lower values correspond to data points bunching closer to it. The mean absolute deviation is also known as the mean deviation and average absolute deviation.
This definition of the mean absolute deviation sounds similar to the standard deviation (SD). While both measure variability, they have different calculations. In recent years, some proponents of MAD have suggested that it replace the SD as the primary measure because it is a simpler concept that better fits real life.
█ Giga Kaleidoscope Modularized Trading System
Core components of an NNFX algorithmic trading strategy
The NNFX algorithm is built on the principles of trend, momentum, and volatility. There are six core components in the NNFX trading algorithm:
1. Volatility - price volatility; e.g., Average True Range, True Range Double, Close-to-Close, etc.
2. Baseline - a moving average to identify price trend
3. Confirmation 1 - a technical indicator used to identify trends
4. Confirmation 2 - a technical indicator used to identify trends
5. Continuation - a technical indicator used to identify trends
6. Volatility/Volume - a technical indicator used to identify volatility/volume breakouts/breakdown
7. Exit - a technical indicator used to determine when a trend is exhausted
8. Metamorphosis - a technical indicator that produces a compound signal from the combination of other GKD indicators*
*(not part of the NNFX algorithm)
What is Volatility in the NNFX trading system?
In the NNFX (No Nonsense Forex) trading system, ATR (Average True Range) is typically used to measure the volatility of an asset. It is used as a part of the system to help determine the appropriate stop loss and take profit levels for a trade. ATR is calculated by taking the average of the true range values over a specified period.
True range is calculated as the maximum of the following values:
-Current high minus the current low
-Absolute value of the current high minus the previous close
-Absolute value of the current low minus the previous close
ATR is a dynamic indicator that changes with changes in volatility. As volatility increases, the value of ATR increases, and as volatility decreases, the value of ATR decreases. By using ATR in NNFX system, traders can adjust their stop loss and take profit levels according to the volatility of the asset being traded. This helps to ensure that the trade is given enough room to move, while also minimizing potential losses.
Other types of volatility include True Range Double (TRD), Close-to-Close, and Garman-Klass
What is a Baseline indicator?
The baseline is essentially a moving average, and is used to determine the overall direction of the market.
The baseline in the NNFX system is used to filter out trades that are not in line with the long-term trend of the market. The baseline is plotted on the chart along with other indicators, such as the Moving Average (MA), the Relative Strength Index (RSI), and the Average True Range (ATR).
Trades are only taken when the price is in the same direction as the baseline. For example, if the baseline is sloping upwards, only long trades are taken, and if the baseline is sloping downwards, only short trades are taken. This approach helps to ensure that trades are in line with the overall trend of the market, and reduces the risk of entering trades that are likely to fail.
By using a baseline in the NNFX system, traders can have a clear reference point for determining the overall trend of the market, and can make more informed trading decisions. The baseline helps to filter out noise and false signals, and ensures that trades are taken in the direction of the long-term trend.
What is a Confirmation indicator?
Confirmation indicators are technical indicators that are used to confirm the signals generated by primary indicators. Primary indicators are the core indicators used in the NNFX system, such as the Average True Range (ATR), the Moving Average (MA), and the Relative Strength Index (RSI).
The purpose of the confirmation indicators is to reduce false signals and improve the accuracy of the trading system. They are designed to confirm the signals generated by the primary indicators by providing additional information about the strength and direction of the trend.
Some examples of confirmation indicators that may be used in the NNFX system include the Bollinger Bands, the MACD (Moving Average Convergence Divergence), and the MACD Oscillator. These indicators can provide information about the volatility, momentum, and trend strength of the market, and can be used to confirm the signals generated by the primary indicators.
In the NNFX system, confirmation indicators are used in combination with primary indicators and other filters to create a trading system that is robust and reliable. By using multiple indicators to confirm trading signals, the system aims to reduce the risk of false signals and improve the overall profitability of the trades.
What is a Continuation indicator?
In the NNFX (No Nonsense Forex) trading system, a continuation indicator is a technical indicator that is used to confirm a current trend and predict that the trend is likely to continue in the same direction. A continuation indicator is typically used in conjunction with other indicators in the system, such as a baseline indicator, to provide a comprehensive trading strategy.
What is a Volatility/Volume indicator?
Volume indicators, such as the On Balance Volume (OBV), the Chaikin Money Flow (CMF), or the Volume Price Trend (VPT), are used to measure the amount of buying and selling activity in a market. They are based on the trading volume of the market, and can provide information about the strength of the trend. In the NNFX system, volume indicators are used to confirm trading signals generated by the Moving Average and the Relative Strength Index. Volatility indicators include Average Direction Index, Waddah Attar, and Volatility Ratio. In the NNFX trading system, volatility is a proxy for volume and vice versa.
By using volume indicators as confirmation tools, the NNFX trading system aims to reduce the risk of false signals and improve the overall profitability of trades. These indicators can provide additional information about the market that is not captured by the primary indicators, and can help traders to make more informed trading decisions. In addition, volume indicators can be used to identify potential changes in market trends and to confirm the strength of price movements.
What is an Exit indicator?
The exit indicator is used in conjunction with other indicators in the system, such as the Moving Average (MA), the Relative Strength Index (RSI), and the Average True Range (ATR), to provide a comprehensive trading strategy.
The exit indicator in the NNFX system can be any technical indicator that is deemed effective at identifying optimal exit points. Examples of exit indicators that are commonly used include the Parabolic SAR, and the Average Directional Index (ADX).
The purpose of the exit indicator is to identify when a trend is likely to reverse or when the market conditions have changed, signaling the need to exit a trade. By using an exit indicator, traders can manage their risk and prevent significant losses.
In the NNFX system, the exit indicator is used in conjunction with a stop loss and a take profit order to maximize profits and minimize losses. The stop loss order is used to limit the amount of loss that can be incurred if the trade goes against the trader, while the take profit order is used to lock in profits when the trade is moving in the trader's favor.
Overall, the use of an exit indicator in the NNFX trading system is an important component of a comprehensive trading strategy. It allows traders to manage their risk effectively and improve the profitability of their trades by exiting at the right time.
What is an Metamorphosis indicator?
The concept of a metamorphosis indicator involves the integration of two or more GKD indicators to generate a compound signal. This is achieved by evaluating the accuracy of each indicator and selecting the signal from the indicator with the highest accuracy. As an illustration, let's consider a scenario where we calculate the accuracy of 10 indicators and choose the signal from the indicator that demonstrates the highest accuracy.
The resulting output from the metamorphosis indicator can then be utilized in a GKD-BT backtest by occupying a slot that aligns with the purpose of the metamorphosis indicator. The slot can be a GKD-B, GKD-C, or GKD-E slot, depending on the specific requirements and objectives of the indicator. This allows for seamless integration and utilization of the compound signal within the GKD-BT framework.
How does Loxx's GKD (Giga Kaleidoscope Modularized Trading System) implement the NNFX algorithm outlined above?
Loxx's GKD v2.0 system has five types of modules (indicators/strategies). These modules are:
1. GKD-BT - Backtesting module (Volatility, Number 1 in the NNFX algorithm)
2. GKD-B - Baseline module (Baseline and Volatility/Volume, Numbers 1 and 2 in the NNFX algorithm)
3. GKD-C - Confirmation 1/2 and Continuation module (Confirmation 1/2 and Continuation, Numbers 3, 4, and 5 in the NNFX algorithm)
4. GKD-V - Volatility/Volume module (Confirmation 1/2, Number 6 in the NNFX algorithm)
5. GKD-E - Exit module (Exit, Number 7 in the NNFX algorithm)
6. GKD-M - Metamorphosis module (Metamorphosis, Number 8 in the NNFX algorithm, but not part of the NNFX algorithm)
(additional module types will added in future releases)
Each module interacts with every module by passing data to A backtest module wherein the various components of the GKD system are combined to create a trading signal.
That is, the Baseline indicator passes its data to Volatility/Volume. The Volatility/Volume indicator passes its values to the Confirmation 1 indicator. The Confirmation 1 indicator passes its values to the Confirmation 2 indicator. The Confirmation 2 indicator passes its values to the Continuation indicator. The Continuation indicator passes its values to the Exit indicator, and finally, the Exit indicator passes its values to the Backtest strategy.
This chaining of indicators requires that each module conform to Loxx's GKD protocol, therefore allowing for the testing of every possible combination of technical indicators that make up the six components of the NNFX algorithm.
What does the application of the GKD trading system look like?
Example trading system:
Backtest: Multi-Ticker CC Backtest
Baseline: Hull Moving Average
Volatility/Volume: Hurst Exponent
Confirmation 1: Advance Trend Pressure as shown on the chart above
Confirmation 2: uf2018
Continuation: Coppock Curve
Exit: Rex Oscillator
Metamorphosis: Baseline Optimizer
Each GKD indicator is denoted with a module identifier of either: GKD-BT, GKD-B, GKD-C, GKD-V, GKD-M, or GKD-E. This allows traders to understand to which module each indicator belongs and where each indicator fits into the GKD system.
█ Giga Kaleidoscope Modularized Trading System Signals
Standard Entry
1. GKD-C Confirmation gives signal
2. Baseline agrees
3. Price inside Goldie Locks Zone Minimum
4. Price inside Goldie Locks Zone Maximum
5. Confirmation 2 agrees
6. Volatility/Volume agrees
1-Candle Standard Entry
1a. GKD-C Confirmation gives signal
2a. Baseline agrees
3a. Price inside Goldie Locks Zone Minimum
4a. Price inside Goldie Locks Zone Maximum
Next Candle
1b. Price retraced
2b. Baseline agrees
3b. Confirmation 1 agrees
4b. Confirmation 2 agrees
5b. Volatility/Volume agrees
Baseline Entry
1. GKD-B Baseline gives signal
2. Confirmation 1 agrees
3. Price inside Goldie Locks Zone Minimum
4. Price inside Goldie Locks Zone Maximum
5. Confirmation 2 agrees
6. Volatility/Volume agrees
7. Confirmation 1 signal was less than 'Maximum Allowable PSBC Bars Back' prior
1-Candle Baseline Entry
1a. GKD-B Baseline gives signal
2a. Confirmation 1 agrees
3a. Price inside Goldie Locks Zone Minimum
4a. Price inside Goldie Locks Zone Maximum
5a. Confirmation 1 signal was less than 'Maximum Allowable PSBC Bars Back' prior
Next Candle
1b. Price retraced
2b. Baseline agrees
3b. Confirmation 1 agrees
4b. Confirmation 2 agrees
5b. Volatility/Volume agrees
Volatility/Volume Entry
1. GKD-V Volatility/Volume gives signal
2. Confirmation 1 agrees
3. Price inside Goldie Locks Zone Minimum
4. Price inside Goldie Locks Zone Maximum
5. Confirmation 2 agrees
6. Baseline agrees
7. Confirmation 1 signal was less than 7 candles prior
1-Candle Volatility/Volume Entry
1a. GKD-V Volatility/Volume gives signal
2a. Confirmation 1 agrees
3a. Price inside Goldie Locks Zone Minimum
4a. Price inside Goldie Locks Zone Maximum
5a. Confirmation 1 signal was less than 'Maximum Allowable PSVVC Bars Back' prior
Next Candle
1b. Price retraced
2b. Volatility/Volume agrees
3b. Confirmation 1 agrees
4b. Confirmation 2 agrees
5b. Baseline agrees
Confirmation 2 Entry
1. GKD-C Confirmation 2 gives signal
2. Confirmation 1 agrees
3. Price inside Goldie Locks Zone Minimum
4. Price inside Goldie Locks Zone Maximum
5. Volatility/Volume agrees
6. Baseline agrees
7. Confirmation 1 signal was less than 7 candles prior
1-Candle Confirmation 2 Entry
1a. GKD-C Confirmation 2 gives signal
2a. Confirmation 1 agrees
3a. Price inside Goldie Locks Zone Minimum
4a. Price inside Goldie Locks Zone Maximum
5a. Confirmation 1 signal was less than 'Maximum Allowable PSC2C Bars Back' prior
Next Candle
1b. Price retraced
2b. Confirmation 2 agrees
3b. Confirmation 1 agrees
4b. Volatility/Volume agrees
5b. Baseline agrees
PullBack Entry
1a. GKD-B Baseline gives signal
2a. Confirmation 1 agrees
3a. Price is beyond 1.0x Volatility of Baseline
Next Candle
1b. Price inside Goldie Locks Zone Minimum
2b. Price inside Goldie Locks Zone Maximum
3b. Confirmation 1 agrees
4b. Confirmation 2 agrees
5b. Volatility/Volume agrees
Continuation Entry
1. Standard Entry, 1-Candle Standard Entry, Baseline Entry, 1-Candle Baseline Entry, Volatility/Volume Entry, 1-Candle Volatility/Volume Entry, Confirmation 2 Entry, 1-Candle Confirmation 2 Entry, or Pullback entry triggered previously
2. Baseline hasn't crossed since entry signal trigger
4. Confirmation 1 agrees
5. Baseline agrees
6. Confirmation 2 agrees

FreedX Grid Backtest█ FreedX Grid Backtest is an open-source tool that offers accurate GRID calculations for GRID trading strategies. This advanced tool allows users to backtest GRID trading parameters with precision, accurately reflecting exchange functionalities. We are committed to enhancing trading strategies through precise backtesting solutions and address the issue of unreliable backtesting practices observed on GRID trading strategies. FreedX Grid Backtest is designed for optimal calculation speed and plotting efficiency, ensuring users to achieve fastest calculations during their analysis.
█ GRID TRADING STRATEGY SETTINGS
The core of the FreedX Grid Backtest tool lies in its ability to simulate grid trading strategies. Grid trading involves placing orders at regular intervals within a predefined price range, creating a grid of orders that capitalize on market volatility.
Features:
⚙️ Backtest Range:
→ Purpose: Allows users to specify the backtesting range of GRID strategy. Closes all positions at the end of this range.
→ How to Use: Drag the dates to fit the desired backtesting range.
⚙️ Investment & Compounding:
→ Purpose: Allows users to specify the total investment amount and select between fixed and compound investment strategies. Compounding adjusts trade quantities based on performance, enhancing the grid strategy's adaptability to market changes.
→ How to Use: Set the desired investment amount and choose between "Fixed" or "Compound" for the investment method.
⚙️ Leverage & Grid Levels:
→ Purpose: Leverage amplifies the investment amount, increasing potential returns (and risks). Users can define the number of grid levels, which determines how the investment is distributed across the grid.
→ How to Use: Input the desired leverage and number of grids. The tool automatically calculates the distribution of funds across each grid level.
⚙️ Distribution Type & Mode:
→ Purpose: Users can select the distribution type (Arithmetic or Geometric) to set how grid levels are determined. The mode (Neutral, Long, Short) dictates the direction of trades within the grid.
→ How to Use: Choose the distribution type and mode based on the desired trading strategy and market outlook.
⚙️ Enable LONG/SHORT Grids exclusively:
█ MANUAL LEVELS AND STOP TRIGGERS
Beyond automated settings, the tool offers manual adjustments for traders seeking finer control over their grid strategies.
Features:
⚙️ Manual Level Adjustment:
→ Purpose: Enables traders to manually set the top, reference, and bottom levels of the grid, offering precision control over the trading range.
→ How to Use: Activate manual levels and adjust the top, reference, and bottom levels as needed to define the grid's scope.
⚙️ Stop Triggers:
→ Purpose: Provides an option to set upper and lower price limits, acting as stop triggers to close or terminate trades. This feature safeguards investments against significant market movements outside the anticipated range.
→ How to Use: Enable stop triggers and specify the upper and lower limits. The tool will automatically manage positions based on these parameters.
---
This guide gives you a quick and clear overview of the FreedX Grid Backtest tool, explaining how you can use this cutting-edge tool to improve your trading strategies.

FreedX Backtest Plus█ Our new FreedX Backtest PLUS template enhances TradingView backtesting with smart features like Mean Reversion, Flexible Volatility, Liquidation Filter, and Better Trend Filtering, making strategies more effective. It lets users set up automated alerts easily. This guide explains how to make the most of these improved features.
The Trading Date Settings feature in our TradingView script allows you to refine their backtesting parameters by specifying trading dates and hours. This feature enhances the accuracy of the backtest by aligning it with specific time frames and days, ensuring that the strategy is tested under relevant market conditions.
Features:
⚙️ Enable Trading Between Specific Dates:
🎯 Purpose:
→ Allows you to limit the backtesting of their strategy to a specific date range.
💡 How to Use:
→ Input the Start Date and End Date for the backtest period.
→ The script will execute the strategy only within this specified date range.
⚙️ Enable Trading Between Specific Hours:
🎯 Purpose:
→ Allows you to limit the backtesting of their strategy to a specific hour range.
💡 How to Use:
→ Input the start and end hour for in Trading Session section.
→ The script will execute the strategy only within this specified hour range.
⚙️ Enable Trading on Specified Days of the Week:
🎯 Purpose:
→ Gives you the option to conduct backtesting on selected days of the week, tailoring the strategy to particular market behaviours that may occur on these days.
💡 How to Use:
→ Select the days of the week for the backtest.
→ The script will activate the trading strategy only on these chosen days.
█ BUY/SELL TRIGGER SETTINGS
The Buy/Sell Trigger Settings feature is designed to provide users with flexibility in defining the conditions for 'LONG' and 'SHORT' signals based on various indicator types. This customization is crucial for tailoring strategies to different trading styles and market conditions.
Features:
⚙️ Single-Line Plotted Indicators :
🎯 Purpose:
→ Enables you to select a single-line plotted indicator as a source for backtesting. You can define specific levels to trigger 'LONG' or 'SHORT' signals.
💡 How to Use:
→ Choose a Single-Line Plotted indicator as the source.
→ Set the top and bottom levels for the indicator.
→ The script triggers 'LONG' signals at the bottom level and 'SHORT' signals at the top level.
⚙️ Two-Line Plotted Indicators :
🎯 Purpose:
→ Allows backtesting with two-line cross plot sources. Signals are generated based on the crossover of these lines.
💡 How to Use:
→ Select two lines as 'Source 1' and 'Source 2' for the indicator.
→ The script triggers a 'LONG' signal when 'Source 1' crosses above 'Source 2'.
→ Conversely, a 'SHORT' signal is triggered when 'Source 2' crosses above 'Source 1'.
⚙️ Custom Signals :
🎯 Purpose:
→ This setting enables users to define their own criteria for LONG, SHORT, and CLOSE signals based on custom indicator outputs.
💡 How to Use:
→ Select the custom source for your signals.
→ Define the output values that correspond to each signal type (e.g., “1” for 'LONG', “-1” for SHORT, and “0” for CLOSE).
→ The script will trigger signals according to these custom-defined values.
█ TP/SL SETTINGS
The TP/SL (Take Profit/Stop Loss) Settings feature is designed to give users control over their profit securing and risk mitigation strategies. This feature allows for setting custom TP and SL levels, which can be critical in managing trades effectively.
Features:
Custom TP/SL Levels for Long/Short Signals:
🎯 Purpose:
→ Enables users to set specific percentage levels for Take Profit and Stop Loss on long and short signals.
💡 How to Use:
→ In the TP/SL Settings, input the desired percentage for Take Profit (TP) and Stop Loss (SL).
→ For example, to secure a profit at a 10% price increase on LONG signals, set the “Long TP Percentage” to “10”.
█ STRATEGY SETTINGS
Strategy Settings provide a range of options to customize the trading strategy. These settings include leverage, position direction changes, and more, allowing users to tailor their strategy to their risk tolerance and market view.
Features:
⚙️ Enable Reverse Position:
🎯 Purpose:
→ Automatically closes a current position and opens a new one in the opposite direction upon detecting a signal for a market trend change.
🎯 Example:
→ If a LONG signal is received while in a SHORT position, the script will close the SHORT position and open a LONG position.
💡 How to Use:
→ Activate this feature in the Strategy Settings.
⚙️ Enable Spot Mode:
🎯 Purpose:
→ Disables short orders, using short signals only for closing long positions.
💡 How to Use:
→ Select the 'Spot Mode' option in the Strategy Settings.
⚙️ Enable Invert Signals:
🎯 Purpose:
→ Inverts all indicator signals, changing LONG signals to SHORT and vice versa.
💡 How to Use:
→ Opt for the 'Invert Signals' feature in the Strategy Settings.
⚙️ Enable Trailing Stop:
🎯 Purpose:
→ Triggers a trailing stop order on the exchange instead of a standard stop market order.
☢️ Caution:
→ The backtesting of this feature on TradingView may not accurately reflect actual strategy performance due to discrepancies between TradingView and exchange mechanisms.
💡 How to Use:
→ Select 'Trailing Stop' in the Strategy Settings.
⚙️ Enable Realistic TP & SL:
🎯 Purpose:
→ Goal is protect the user from unrealistic stop loss and take profit prices in live exchange trading conditions.
→ That feature continuously checks the take profit, stop loss and move stop loss prices to prevent unrealistic values. It changes their values according to (minimum realistic percent %)
💡 How to Use:
→ Select 'Enable Realistic TP & SL' in the Strategy Settings. Write min allowed percents.
█ LIMITER SETTINGS
Limiter Settings provide a range of options to customize the trading strategy. These settings include drawdown limits,contract limit, tradable ratio, for allowing users to tailor their strategy to their risk tolerance and market view.
⚙️ Leverage :
🎯 Purpose:
→ Allows users to apply leverage to their trades.
☢️ Caution:
→ High leverage can significantly increase the risk of liquidation.
→ High leverage and a high stop-loss price may override your fixed stoploss percentage, adjusting the stop-loss to the liquidation price.
💡 How to Use:
→ Set the desired leverage ratio in the Strategy Settings.
⚙️ Drawdown Limit:
🎯 Purpose:
→ Sets a maximum drawdown limit, automatically halting the strategy if this limit is reached, thereby controlling risk.
💡 How to Use:
→ Input the maximum drawdown limit (default: 100, min: 0, max: 100).
⚙️ Contract Limit:
🎯 Purpose:
→ Sets a maximum contract limit, beyond which the compound effect cannot be used. This is important to prevent market manipulation through large-volume orders.
💡 How to Use:
→ Input the maximum contract limit (min: 0).
⚙️ Tradable Ratio:
🎯 Purpose:
→ Sets a tradable ratio, it uses that ratio calculating entry cost for position. Main purpose is cash-out and cash-in according to balance change.
💡 How to Use:
→ Input the tradable ratio percent (default: 98, min: 0.1, max: 100).
█ CASH-OUT SETTINGS
Cash-Out Settings offer a money-saving mechanism that prevents entering positions with the entire balance due to cashed-out funds. It functions with a webhook alerts, but the 'Override Allocation %' option must be enabled.
⚙️ Cash-out Threshold %:
🎯 Purpose:
→ It is cash-out mechanism, it saves money with a target threshold.
💡 How to Use:
→ Input the threshold (min: 0).
⚙️ Cash-out Per Profitable Trades %:
🎯 Purpose:
→ It is cash-out mechanism, it saves money from every trade with a percent like commission.
💡 How to Use:
→ Input save percent% (min: 0).
█ ADAPTIVE VOLATILITY STRATEGY SETTINGS
Advanced Strategy Settings offer sophisticated methods for managing Stop Loss (SL) and Take Profit (TP) using the Average True Range (ATR). These settings are ideal for traders who want to incorporate volatility into their exit strategies.
Features:
⚙️ Enable ATR Stop Loss:
🎯 Purpose:
→ Automatically sets the Stop Loss price using the Average True Range at the time of entry.
💡 How to Use:
→ Activate 'ATR Stop Loss' to have the SL price calculated based on the current ATR.
⛓ Enable ATR Trailing Stop:
→ Dynamically updates the Stop Loss price with each new bar, according to the Average True Range.
→ Activate 'ATR Trailing Stop'.
→ Set the ATR Period to define the number of bars for ATR calculation.
→ Adjust the ATR SL Multiplier to determine the stop loss distance.
→ Modify the ATR TP Multiplier for setting the take profit distance.
⚙️ Enable ATR Take Profit:
🎯 Purpose:
→ Sets the Take Profit price based on the Average True Range at the time of entry.
💡 How to Use:
→ Choose 'ATR Take Profit' for TP price determination using ATR.
⚙️ Enable ATR Limit Entry:
🎯 Purpose:
→ Trade can not open in candle close price. Price should hit target price that based on average true range value.
💡 How to Use:
→ Choose 'ATR Limit Entry' for entry price determination using ATR.
⛓ Enable ATR Limit Entry Trailing Price:
→ Dynamically updates the entry price with each new bar, according to the Average True Range.
→ Activate 'ATR Limit Entry Trailing Price'.
→ Set the ATR Period to define the number of bars for ATR calculation.
→ Adjust the ATR SL Multiplier to determine the stop loss distance.
→ Modify the ATR TP Multiplier for setting the take profit distance.
█ TREND FILTERING SETTINGS
Trend Filtering Settings are designed to align trading strategies with the prevailing market trend, enhancing the precision of trade entries and exits. These settings utilize moving averages for trend analysis and decision-making.
Features:
⚙️ Enable Moving Average Filtering:
🎯 Purpose:
→ Limits trades based on moving average trends, blocking short trades in an uptrend and vice versa.
💡 How to Use:
→ Enable 'Trend Filtering'.
→ Set Fast and Slow MA Lengths for trend analysis.
→ Select the Timeframe for moving averages.
→ Choose the Moving Average Type for trend filtering.
🎯 Note:
→ Be cautious with timeframe selections; lower timeframes than the base may cause inconsistencies.
⛓ Exit on Trend Reversal:
→ Automatically closes a position when a market trend reversal is detected.
→ Turn on 'Exit on Trend Reversal' in the settings.
⛓ Ignore Counter Signals:
→ Ignores counter signals during trending market way.
→ If the trend way is long. All short signals will ignore and vice versa.
⛓ Enable Drawing On Chart:
→ Visually represents the trend filter directly on the chart for easy reference.
→ Activate 'Drawing On Chart' to see the trend filter overlaid on the trading chart.
⚙️ Enable Adx Filtering:
🎯 Purpose:
→ Limits trades based on adx value, blocking trades if trend strength is not enough or vice versa for invert mode.
💡 How to Use:
→ Enable 'Adx Filtering'.
→ Set Smoothing and Lengths for adx trend analysis.
→ Select level barrier for trend strength.
⚙️ Enable Custom Filtering:
🎯 Purpose:
→ Limits trades based on custom sources, blocking trades according to custom trades.
💡 How to Use:
→ Enable 'Custom Filtering'.
→ Select fast source.
→ Select slow source.
→ Enable lag mode.
█ MEAN REVERSION FILTERING SETTINGS
Mean Reversion Filtering Settings are designed to align trading strategies during accumulation market conditions. They set a distance from a line to permit trading. The purpose is to ensure that when the price strays too far from the mean line, it should revert back. In accumulation markets, price movements are generally horizontal. In such situations, mean reversion will operate like a grid, enabling profitable trades with low drawdown. However, when the market structure begins to trend, mean reversion filters may not be as profitable as in accumulation markets. For instance, let's say the price is rising and we are shorting the market until it reaches the mean price line. As the price goes up and the mean also rises, we will end up closing the position at a higher price, rendering the mean reversion system non-profitable. Therefore, consider this filter wisely; greater distances might work better in trending markets.
Features:
⚙️ Enable Kairi Filter:
🎯 Purpose:
→ Blocks trades based on distance percent between price and moving average.
💡 How to Use:
→ Enable 'Kairi Filter'.
→ Set Length and Distance Percent.
⛓ Enable Trend Drawing On Chart:
→ Visually represents the trend filter directly on the chart for easy reference.
→ Enable 'Drawing On Chart' to see the allowed regions overlaid on the trading chart with arrows.
⚙️ Enable VWAP Filter:
🎯 Purpose:
→ Blocks trades based on distance percent between price and volume weighted average price.
💡 How to Use:
→ Enable 'VWAP Filter'.
→ Set Timeframe as minutes and distance as percent.
⛓ Exit on Crossing with VWAP:
→ Automatically closes a position when the closing price of a candle crosses the VWAP.
→ Choose "Enable", 'Exit on Crossing with VWAP' in the settings.
⛓ Enable Drawing On Chart:
→ Visually represents the trend filter directly on the chart for easy reference.
→ Enable 'Drawing On Chart' to see the allowed regions overlaid on the trading chart with arrows.
█ LIQUIDATION FILTER SETTINGS
Liquidation filter compares the volume data of futures and spot markets.
Large differences in volume indicate unexpected market conditions, such as massive trading activities, which may signal liquidations.
Features:
⚙️ Enable Liquidation Filter:
🎯 Purpose:
→ Blocks trades based on extra ordinary volume differences in spot and futures market.
💡 How to Use:
→ Enable 'Liquidation Filter'.
→ Set behavior to react during that market conditions.
→ Set base amount to filter volume. This amount changes according to timeframe, you should find right amounts.
→ Liquidation candle count means, it is sum of liquidated candle count in last 20 bars.If you set 0, it means feature is disabled.
→ Detection, try to select the spot and perpetual symbols automatically, symbol names varies, it do not support all symbols, you should choose manually in that situation.
█ AUTOMATED ALERT SETTINGS
Automated Alert Settings are designed to integrate your TradingView script with webhook alerts. These settings allow for enhanced strategy execution and management.
Features:
Enable Webhook Alerts:
🎯 Purpose:
→ Trigger BUY, SELL, CHANGE_DIRECTION or MOVE_STOP_LOSS .
💡 How to Use:
→ Enable 'Webhook Alerts' in the settings.
→ Enter your Strategy Key.
→ Optionally, activate 'Override Allocation Percentage' to bypass the preset allocation percentage.
☢️ Caution:
→ Overriding the allocation percentage may result in trade entry errors due to misalignment between entry cost and available balance.
Enable Custom Alerts:
🎯 Purpose:
→ User can produce unique messages for different purposes.
💡 How to Use:
→ Enable 'Custom Alerts' in the settings.
→ Enter your message format type.
█ DEBUGGING SETTINGS
Debugging Settings are crucial for users who want to analyze and optimize their strategies. These settings provide tools for visualizing alerts on charts and accessing detailed data outputs.
Features:
⚙️ Enable Alert Plotting:
🎯 Purpose:
→ Allows users to visualize trading alerts directly on the chart, aiding in strategy analysis and refinement.
💡 How to Use:
→ Activate 'Alert Plotting' to draw alerts on the chart.
☢️ Caution:
→ It is recommended to disable this feature when creating actual trading alerts, as it can cause latency in signal processing.
⚙️ Enable Debugger Mode:
🎯 Purpose:
→ Facilitates strategy debugging by providing detailed data output in the TradingView Data Window.
💡 How to Use:
→ Turn on 'Debugger Mode' to access real-time data and metrics relevant to your strategy.
⚙️ Enable Table:
🎯 Purpose:
→ Facilitates strategy debugging by providing detailed data output in the TradingView Table on chart.
💡 How to Use:
→ Turn on 'Table' to access last closed candle data and metrics relevant to your strategy.
█ ADDITIONAL SETTINGS
⚙️ Enable Bar Magnifier
⚙️ Enable Using standard OHLC

Grid Bot BacktestingBinance, Bybit, Bitget, and other cross-exchange (grid) trading bot backtesting.
Auto bound: Automatically setting upper and lower price bounds.
Manual: Setting upper and lower price bounds manually.
The graph below represents the overall asset changes (initial investment amount + current position profit + grid profit).
Try using backtesting when setting up a grid bot on the exchange!
바이낸스, 바이비트, 비트겟 등 교차거래(그리드) 봇 백테스팅
Auto bound : 자동으로 상,하단 가격 설정
Manual : 직접 상,하단 가격 설정
아래 그래프는 총 자산 변화입니다.(초기투자금액 + 현재 포지션 수익 + 그리드 수익)
거래소에서 그리드 봇 설정할 때 백테스팅 유용하게 써보세요!

FreedX Backtest█ Our strategy template empowers TradingView users to effortlessly backtest any indicator, enhancing their trading strategy's effectiveness. In addition, users can create automated webhook alerts from the template. This document details our template's features and how to utilize them effectively.
█ TRADE DATE SETTINGS
The Trading Date Settings feature in our TradingView script allows you to refine their backtesting parameters by specifying trading dates and hours. This feature enhances the accuracy of the backtest by aligning it with specific time frames and days, ensuring that the strategy is tested under relevant market conditions.
Features:
⚙️ Enable Trading Between Specific Dates:
🎯 Purpose:
→ Allows you to limit the backtesting of their strategy to a specific date range.
💡 How to Use:
→ Input the Start Date and End Date for the backtest period.
→ The script will execute the strategy only within this specified date range.
⚙️ Enable Trading Between Specific Hours:
🎯 Purpose:
→ Allows you to limit the backtesting of their strategy to a specific hour range.
💡 How to Use:
→ Input the start and end hour for in Trading Session section.
→ The script will execute the strategy only within this specified hour range.
⚙️ Enable Trading on Specified Days of the Week:
🎯 Purpose:
→ Gives you the option to conduct backtesting on selected days of the week, tailoring the strategy to particular market behaviours that may occur on these days.
💡 How to Use:
→ Select the days of the week for the backtest.
→ The script will activate the trading strategy only on these chosen days.
█ BUY/SELL TRIGGER SETTINGS
The Buy/Sell Trigger Settings feature is designed to provide users with flexibility in defining the conditions for 'LONG' and 'SHORT' signals based on various indicator types. This customization is crucial for tailoring strategies to different trading styles and market conditions.
Features:
⚙️ Single-Line Plotted Indicators :
🎯 Purpose:
→ Enables you to select a single-line plotted indicator as a source for backtesting. You can define specific levels to trigger 'LONG' or 'SHORT' signals.
💡 How to Use:
→ Choose a Single-Line Plotted indicator as the source.
→ Set the top and bottom levels for the indicator.
→ The script triggers 'LONG' signals at the bottom level and 'SHORT' signals at the top level.
⚙️ Two-Line Plotted Indicators :
🎯 Purpose:
→ Allows backtesting with two-line cross plot sources. Signals are generated based on the crossover of these lines.
💡 How to Use:
→ Select two lines as 'Source 1' and 'Source 2' for the indicator.
→ The script triggers a 'LONG' signal when 'Source 1' crosses above 'Source 2'.
→ Conversely, a 'SHORT' signal is triggered when 'Source 2' crosses above 'Source 1'.
⚙️ Custom Signals :
🎯 Purpose:
→ This setting enables users to define their own criteria for LONG, SHORT, and CLOSE signals based on custom indicator outputs.
💡 How to Use:
→ Select the custom source for your signals.
→ Define the output values that correspond to each signal type (e.g., “1” for 'LONG', “-1” for SHORT, and “0” for CLOSE).
→ The script will trigger signals according to these custom-defined values.
█ TP/SL SETTINGS
The TP/SL (Take Profit/Stop Loss) Settings feature is designed to give users control over their profit securing and risk mitigation strategies. This feature allows for setting custom TP and SL levels, which can be critical in managing trades effectively.
Features:
Custom TP/SL Levels for Long/Short Signals:
🎯 Purpose:
→ Enables users to set specific percentage levels for Take Profit and Stop Loss on long and short signals.
💡 How to Use:
→ In the TP/SL Settings, input the desired percentage for Take Profit (TP) and Stop Loss (SL).
→ For example, to secure a profit at a 10% price increase on LONG signals, set the “Long TP Percentage” to “10”.
█ STRATEGY SETTINGS
Strategy Settings provide a range of options to customize the trading strategy. These settings include leverage, drawdown limits, position direction changes, and more, allowing users to tailor their strategy to their risk tolerance and market view.
Features:
⚙️ Enable Leverage :
🎯 Purpose:
→ Allows users to apply leverage to their trades.
☢️ Caution:
→ High leverage can significantly increase the risk of liquidation.
→ High leverage and a high stop-loss price may override your fixed stoploss percentage, adjusting the stop-loss to the liquidation price.
💡 How to Use:
→ Set the desired leverage ratio in the Strategy Settings.
⚙️ Enable Drawdown Limit:
🎯 Purpose:
→ Sets a maximum drawdown limit, automatically halting the strategy if this limit is reached, thereby controlling risk.
💡 How to Use:
→ Input the maximum drawdown limit (default: 100, min: 0, max: 100).
⚙️ Enable Reverse Position:
🎯 Purpose:
→ Automatically closes a current position and opens a new one in the opposite direction upon detecting a signal for a market trend change.
🎯 Example:
→ If a LONG signal is received while in a SHORT position, the script will close the SHORT position and open a LONG position.
💡 How to Use:
→ Activate this feature in the Strategy Settings.
⚙️ Enable Spot Mode:
🎯 Purpose:
→ Disables short orders, using short signals only for closing long positions.
💡 How to Use:
→ Select the 'Spot Mode' option in the Strategy Settings.
⚙️ Enable Invert Signals:
🎯 Purpose:
→ Inverts all indicator signals, changing LONG signals to SHORT and vice versa.
💡 How to Use:
→ Opt for the 'Invert Signals' feature in the Strategy Settings.
⚙️ Enable Trailing Stop:
🎯 Purpose:
→ Triggers a trailing stop order on the exchange instead of a standard stop market order.
☢️ Caution:
→ The backtesting of this feature on TradingView may not accurately reflect actual strategy performance due to discrepancies between TradingView and exchange mechanisms.
💡 How to Use:
→ Select 'Trailing Stop' in the Strategy Settings.
█ ADVANCED STRATEGY SETTINGS
Advanced Strategy Settings offer sophisticated methods for managing Stop Loss (SL) and Take Profit (TP) using the Average True Range (ATR). These settings are ideal for traders who want to incorporate volatility into their exit strategies.
Features:
⚙️ Enable ATR Stop Loss:
🎯 Purpose:
→ Automatically sets the Stop Loss price using the Average True Range at the time of entry.
💡 How to Use:
→ Activate 'ATR Stop Loss' to have the SL price calculated based on the current ATR.
⚙️ Enable ATR Take Profit:
🎯 Purpose:
→ Sets the Take Profit price based on the Average True Range at the time of entry.
💡 How to Use:
→ Choose 'ATR Take Profit' for TP price determination using ATR.
⚙️ Enable ATR Trailing Stop:
🎯 Purpose:
→ Dynamically updates the Stop Loss price with each new bar, according to the Average True Range.
💡 How to Use:
→ Activate 'ATR Trailing Stop'.
→ Set the ATR Period to define the number of bars for ATR calculation.
→ Adjust the ATR SL Multiplier to determine the stop loss distance.
→ Modify the ATR TP Multiplier for setting the take profit distance.
█ TREND FILTERING SETTINGS
Trend Filtering Settings are designed to align trading strategies with the prevailing market trend, enhancing the precision of trade entries and exits. These settings utilize moving averages for trend analysis and decision-making.
Features:
⚙️ Enable Trend Filtering:
🎯 Purpose:
→ Limits trades based on moving average trends, blocking short trades in an uptrend and vice versa.
💡 How to Use:
→ Enable 'Trend Filtering'.
→ Set Fast and Slow MA Lengths for trend analysis.
→ Select the Timeframe for moving averages.
→ Choose the Moving Average Type for trend filtering.
🎯 Note:
→ Be cautious with timeframe selections; lower timeframes than the base may cause inconsistencies.
⚙️ Enable Exit on Trend Reversal:
🎯 Purpose:
→ Automatically closes a position when a market trend reversal is detected.
💡 How to Use:
→ Turn on 'Exit on Trend Reversal' in the settings.
⚙️ Enable Trend Drawing On Chart:
🎯 Purpose:
→ Visually represents the trend filter directly on the chart for easy reference.
💡 How to Use:
→ Activate 'Trend Drawing On Chart' to see the trend filter overlaid on the trading chart.
█ AUTOMATED ALERT SETTINGS
Automated Alert Settings are designed to integrate your TradingView script with webhook alerts. These settings allow for enhanced strategy execution and management.
Features:
Enable Webhook Alerts:
🎯 Purpose:
→ Trigger BUY, SELL, CHANGE_DIRECTION or MOVE_STOP_LOSS .
💡 How to Use:
→ Enable 'Webhook Alerts' in the settings.
→ Enter your Strategy ID.
→ Optionally, activate 'Override Allocation Percentage' to bypass the preset allocation percentage.
☢️ Caution:
→ Overriding the allocation percentage may result in trade entry errors due to misalignment between entry cost and available balance.
█ DEBUGGING SETTINGS
Debugging Settings are crucial for users who want to analyze and optimize their strategies. These settings provide tools for visualizing alerts on charts and accessing detailed data outputs.
Features:
⚙️ Enable Alert Plotting:
🎯 Purpose:
→ Allows users to visualize trading alerts directly on the chart, aiding in strategy analysis and refinement.
💡 How to Use:
→ Activate 'Alert Plotting' to draw alerts on the chart.
☢️ Caution:
→ It is recommended to disable this feature when creating actual trading alerts, as it can cause latency in signal processing.
⚙️ Enable Debugger Mode:
🎯 Purpose:
→ Facilitates strategy debugging by providing detailed data output in the TradingView Data Window.
💡 How to Use:
→ Turn on 'Debugger Mode' to access real-time data and metrics relevant to your strategy.
█ ADDITIONAL SETTINGS
⚙️ Enable Bar Magnifier
⚙️ Enable Using standard OHLC

Ehlers Combo Strategy🚀 Presenting the Enhanced Ehlers Combo Strategy 🚀
Hello Traders! 👋 I'm thrilled to share the latest version of the Ehlers Combo Strategy v2.0. This powerful algorithm combines Ehlers Elegant Oscillator, Decycler, Instantaneous Trendline, Spearman Rank, and introduces the Signal to Noise Ratio for even more precise trading signals.
📊 Strategy Highlights:
Ehlers Elegant Oscillator: Captures market momentum and turning points.
Ehlers Decycler: Filters out market noise for clearer trend signals.
Instantaneous Trendline: Offers a dynamic view of the market trend.
Spearman Rank: Analyzes market rank correlations for enhanced insights.
Signal to Noise Ratio (SNR): Filters out noise for more accurate signals.
💡 Key Features & Customizations:
Adaptive Length: Enable adaptive length based on the market's current conditions.
SNR Threshold: Set your desired SNR threshold for filtering signals.
Exit Length: Define the length for exit signals.
📈 Trading Signals:
Long Entry: Elegant Oscillator and Decycler cross above 0, source crosses above Decycler, source is greater than an increasing Instantaneous Trendline, Spearman Rank is positive, and SNR exceeds the threshold.
Long Exit: Source crosses below the Instantaneous Trendline after entering a long position.
Short Entry: Elegant Oscillator and Decycler cross below 0, source crosses below Decycler, source is less than a decreasing Instantaneous Trendline, Spearman Rank is negative, and SNR exceeds the threshold.
Short Exit: Source crosses above the Instantaneous Trendline after entering a short position.
📊 Insights & Enhancements:
Dynamic Length: The strategy adapts its length dynamically based on market conditions.
Improved SNR: Signal to Noise Ratio ensures better filtering of signals.
Enhanced Visualization: The Elegant Oscillator now features improved color coding for a clearer interpretation.
🚨 Disclaimer:
Trading involves risk, and this script should be used judiciously. It's not a guaranteed profit machine, but with careful use, it can be a valuable addition to your toolkit.
Feel free to backtest, tweak, and make it your own! Let's conquer the markets together! 💪📈
🚀✨ Happy Trading! ✨🚀
---
🙌 Credits:
A big shoutout to the original contributors:
@blackcat1402
@cheatcountry
@DasanC

Back Week For BacktestIt is Backtest Calculator For Essential and Plus plan holders, the length of available intraday data is calculated as follows: from now to 6 weeks back multiplied by timeframe(in minutes), i.e. you can go 6 weeks back on the 1-minute chart, 12 weeks back on the 2-minute chart, 30 weeks back on the 5-minute chart, 90 weeks back on the 15-minute chart and so on. The higher timeframe is selected, the more intraday data is available.
This show creates a weekday label based on the data in the plans allowed by TradingView. This show creates a weekday label based on the data in the plans allowed by TradingView. How much data is available for Bar Replay? According to the article, we can replay 6 weeks backwards for a 1-minute chart. This indicator is a label that shows how far we can go back, consisting of multiplying each minute by 6 between 1 minute and 60 minutes.
1 minute => 6 week backtest
2 minutes => 12 week backtest
.....
15 minutes => 90 week backtest
...
59 minutes => 354 week backtest

Backtesting ModuleDo you often find yourself creating new 'strategy()' scripts for each trading system? Are you unable to focus on generating new systems due to fatigue and time loss incurred in the process? Here's a potential solution: the 'Backtesting Module' :)
INTRODUCTION
Every trading system is based on four basic conditions: long entry, long exit, short entry and short exit (which are typically defined as boolean series in Pine Script).
If you can define the conditions generated by your trading system as a series of integers, it becomes possible to use these variables in different scripts in efficient ways. (Pine Script is a convenient language that allows you to use the integer output of one indicator as a source in another.)
The 'Backtesting Module' is a dynamic strategy script designed to adapt to your signals. It boasts two notable features:
⮞ It produces a backtest report using the entry and exit variables you define.
⮞ It not only serves for system testing but also to combine independent signals into a single system. (This functionality enables to create complex strategies and report on their success!)
The module tests Golden and Death cross signals by default, when you enter your own conditions the default signals will be neutralized. The methodology is described below.
PREPARATION
There are three simple steps to connect your own indicator to the Module.
STEP 1
Firstly, you must define entry and exit variables in your own script. Let's elucidate it with a straightforward example. Consider a system generating long and short signals based on the intersections of two moving averages. Consequently, our conditions would be as follows:
// Signals
long = ta.crossover(ta.sma(close, 14), ta.sma(close, 28))
short = ta.crossunder(ta.sma(close, 14), ta.sma(close, 28))
Now, the question is: How can we convert boolean variables into integer variables? The answer is conditional ternary block, defined as follows:
// Entry & Exit
long_entry = long ? 1 : 0
long_exit = short ? 1 : 0
short_entry = short ? 1 : 0
short_exit = long ? 1 : 0
The mechanics of the Entry & Exit variables are simple. The variable takes on a value of 1 when your trading system generates the signal and if your system does not produce any signal, variable returns 0. In this example, you see how exit signals can be generated in a trading system that only contains entry signals. If you have a system with original exit signals, you can also use them directly. (Please mind the NOTES section below).
STEP 2
To utilize the Entry & Exit variables as source in another script, they must be plotted on the chart. Therefore, the final detail to include in the script containing your trading system would be as follows:
// Plot The Output
plot(long_entry, "Long Entry", display=display.data_window, editable=false)
plot(long_exit, "Long Exit", display=display.data_window, editable=false)
plot(short_entry, "Short Entry", display=display.data_window, editable=false)
plot(short_exit, "Short Exit", display=display.data_window, editable=false)
STEP 3
Now, we are ready to test the system! Load the Backtesting Module indicator onto the chart along with your trading system/indicator. Then set the outputs of your system (Long Entry, Long Exit, Short Entry, Short Exit) as source in the module. That's it.
FEATURES & ORIGINALITY
⮞ Primarily, this script has been created to provide you with an easy and practical method when testing your trading system.
⮞ I thought it might be nice to visualize a few useful results. The Backtesting Module provides insights into the outcomes of both long and short trades by computing the number of trades and the success percentage.
⮞ Through the 'Trade' parameter, users can specify the market direction in which the indicator is permitted to initiate positions.
⮞ Users have the flexibility to define the date range for the test.
⮞ There are optional features allowing users to plot entry prices on the chart and customize bar colors.
⮞ The report and the test date range are presented in a table on the chart screen. The entry price can be monitored in the data window.
⮞ Note that results are based on realized returns, and the open trade is not included in the displayed results. (The only exception is the 'Unrealized PNL' result in the table.)
STRATEGY SETTINGS
The default parameters are as follows:
⮞ Initial Balance : 10000 (in units of currency)
⮞ Quantity : 10% of equity
⮞ Commission : 0.04%
⮞ Slippage : 0
⮞ Dataset : All bars in the chart
For a realistic backtest result, you should size trades to only risk sustainable amounts of equity. Do not risk more than 5-10% on a trade. And ALWAYS configure your commission and slippage parameters according to pessimistic scenarios!
NOTES
⮞ This script is intended solely for development purposes. And it'll will be available for all the indicators I publish.
⮞ In this version of the module, all order types are designed as market orders. The exit size is the sum of the entry size.
⮞ As your trading conditions grow more intricate, you might need to define the outputs of your system in alternative ways. The method outlined in this description is tailored for straightforward signal structures.
⮞ Additionally, depending on the structure of your trading system, the backtest module may require further development. This encompasses stop-loss, take-profit, specific exit orders, quantity, margin and risk management calculations. I am considering releasing improvements that consider these options in future versions.
⮞ An example of how complex trading signals can be generated is the OTT Collection. If you're interested in seeing how the signals are constructed, you can use the link below.
THANKS
Special thanks to PineCoders for their valuable moderation efforts.
I hope this will be a useful example for the TradingView community...
DISCLAIMER
This is just an indicator, nothing more. It is provided for informational and educational purposes exclusively. The utilization of this script does not constitute professional or financial advice. The user solely bears the responsibility for risks associated with script usage. Do not forget to manage your risk. And trade as safely as possible. Best of luck!
