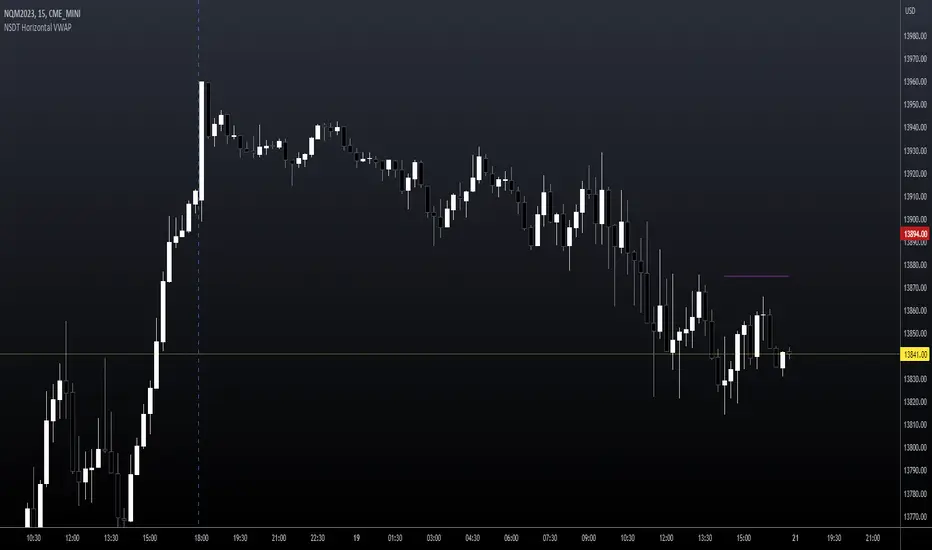
NSDT Horizontal VWAPThis script plots VWAP as a horizontal line starting at the most recent candle and extending backwards for a period of 10 to make it easier to see. (default is 10 but can be changed to fit your needs)
You may only want to see where VWAP is currently and not need to see the entire day. Helps keep the chart clean.
Colors and line settings can all be modified.
You can show the original VWAP plot as well for reference.
What Is the Volume-Weighted Average Price (VWAP)?
The volume-weighted average price (VWAP) is a technical analysis indicator used on intraday charts that resets at the start of every new trading session.
It's a trading benchmark that represents the average price a security has traded at throughout the day, based on both volume and price.
VWAP is important because it provides traders with pricing insight into both the trend and value of a security.
Averages
Consensio Allocation ToolOriginally created and taught by Taylor Jenks, this indicator provides portfolio allocation suggestions based on the behaviour of price and 3 simple moving averages (4/10/40 by default)
(ie. when short & medium term SMAs are above the long term then allocation is to be 100%).
This percentage allocated to the stock/commodity is to be reduced as it passes below the SMA's, particularly as each moving average crosses.
Consensio is useful for scaling in and out of a position as the portfolio allocation will change according to the momentum of the asset.
The rules below are my own based on understanding of the trading system developed by Jenks and his online content.
This script has the following rules:
if fastAboveSlowMA and not mediumAboveSlowMA
allocation := 30.0
else if longAboveFastMA
allocation := 0.0
else if fastAboveMediumMA and fastAboveSlowMA
allocation := 100.0
else if not fastAboveMediumMA and fastAboveSlowMA
allocation := 80.0
else if not fastAboveMediumMA and not fastAboveSlowMA
allocation := 50.0
else if not mediumAboveSlowMA and fastAboveSlowMA
allocation := 50.0
// Calculate adjusted allocation percentage based on crossing moving averages
allocation := allocation + (priceAboveFastMA ? 10.0 : -10.0)
allocation := allocation + (priceAboveMediumMA ? 10.0 : -10.0)

Multi-Symbol Cross Indicator Template - Unleash Your Potential!Unlock your full trading potential with this powerful and versatile Multi-Symbol Cross Indicator Template! This script is designed to make you stand out from the crowd by enabling you to monitor multiple symbols on a single chart for specific events, such as a Golden Cross or Death Cross. With its high adaptability to include various technical indicators, you're in complete control of your trading decisions and market analysis.
By using the built-in request.security function, this template fetches data for your chosen symbols from the selected exchange and calculates the conditions (e.g., moving average crossovers) for each symbol. Although the current implementation focuses on Golden Crosses and Death Crosses, the sky is the limit when it comes to modifying the script to incorporate other technical indicators such as RSI, MACD, or Bollinger Bands.
You, as a discerning trader, can easily customize the script by selecting your preferred exchange and symbols through input options. This flexibility allows you to monitor your favorite markets without the need for any direct code modification, giving you the ultimate adaptability for various trading strategies and market analysis purposes.
Remember, this script is more than just an example or template; it's the key to unleashing your inner trading genius. While it's not intended to be a standalone trading strategy, it serves as the foundation for you to build upon and create your own customized multi-symbol indicators or strategies. You are awesome, and with this Multi-Symbol Cross Indicator Template, there's no doubt that you're on the path to achieving great success in your trading journey!

[MAD] Moving Average RibbonsThis is a Ribbon builder tool that allows customization and display of multiple moving averages (MAs) on a chart.
The available MAs include simple, exponential, linear, weighted and many more.
You can set a range for the length of each MA and adjust the multiplicator of the range for the second MA.
A mixer for combining the two MAs is also available, and you can specify a range for the mixing.
Choose the number of Ribbons to display and toggle dynamic coloring on or off.
Enable single plots and one average plot as needed.
If more than 20 LMA's are calculated, especially when using bigger lengths, a timeout error may occur as the maximum runtime is limited to 20s/40s.
have fun

MTFT EMA CloudsMulti Time Frame Tools
Multi Time Frame Tools (MTFT) is a suite of scripts aimed to establish a standard timeframe-based color scheme. This can be utilized to overlay different timeframes calculations/values over a single timeframe. As one example, this would allow to observe the 5-month moving average, 5-week moving average, and 5-day moving average overlaid over each other. This would allow to study a chart, get accustomed to the color scheme and study all these at the same time much easier.
All indicators calculated using the below specific timeframes as input, will always use the color scheme outlined below. This is to get you in habit of recognizing the different timeframes overlaid in top of each other. These can be personalized.
Longer TF analysis.
Yearly - Black
Semi-Annual - Yellow
Quarterly - White
Monthly - Maroon
Weekly - Royal Blue
Daily - Lime
Shorter TF analysis.
4 hour - Fuchsia
1 hour - Orange
30 min - Red
15 min - Brown
10 min - Purple
5 min - Lilac
All color coordination is able to be modified in either the “Inputs” or “Style” section. If you need to make changes, make sure to select “Save as Default” on the bottom right of the settings menu.
Recommended Chart Color Layout
I played around with color coordination a lot. The final product was what worked best for me. I personally use the following chart settings to accent all available TF colors.
-> Click on the settings wheel on your chart. -> Click on “Appearance”.
Background - Solid -> On the top row pick the 6th color from the left.
Vert Grid Lines and Horz Grid Lines -> On the top row pick the 7th color from the left.
You may of course change these and the indicator line colors as you like.
Adding indicator to Chart
-> Open the TradingView “Indicators & Strategies” library, the icon has “ƒx”. -> All premium scripts will be located under “Invite-Only Scripts” -> Click indicator to add to your chart.
*** MTFT EMA Clouds ***
The Exponential Moving Average Clouds, EMA Clouds, is a commonly discussed FinTwit tool. I personally found it through Ripster47 and PatternProfits on Twitter. I have seen big FinTwit accounts solely focus on this strategy alone and have seen other big FinTwit accounts mix with their other indicators. I will be providing very basic info to utilize this script; it is up to you to dive deep into learning this strategy. I am not an expert with the tool or a financial advisor. As with all aspects of life, I recommend you research, learn, discern and practice extensively in order to become a master.
The script has the following features.
1. Two user selected timeframes(TF) per script instance. Timeframes include: Quarter, Month, Weekly, Daily, 4 hour, 1 hour, 30 min, 15 min, 10 min, and 5 min candlestick data.
2. Five Unique Clouds per selected timeframe can each be individually enabled/disabled. Cloud pairs include: 5&13, 8&9, 34&50, 72&89, and 180&200.
Below are some examples of how switching between multiple TF’s could assist you in identifying patterns and resistance/support easier. Below are 4 different timeframe EMA Clouds plotted over similar areas. What supports/resistances do you see?
Weekly timeframe selected with Quarterly Clouds
Weekly timeframe selected with Monthly Clouds
Daily timeframe selected with Weekly Clouds
1-hour timeframe selected with Daily Clouds.
This is meant to show you that the EMA Clouds often serve as resistance/support on multiple timeframes.
3. Force a specific cloud on both selected timeframes. Maybe you want to see how one cloud on several TFs looks over the same chart. Here I added two instances of the script in order to show 4 different TF clouds (Q, M, W, and D). Then I selected the “8_9” on “Force single cloud” for each instance, which will force only the selected cloud to be forced on all the selected time frames.
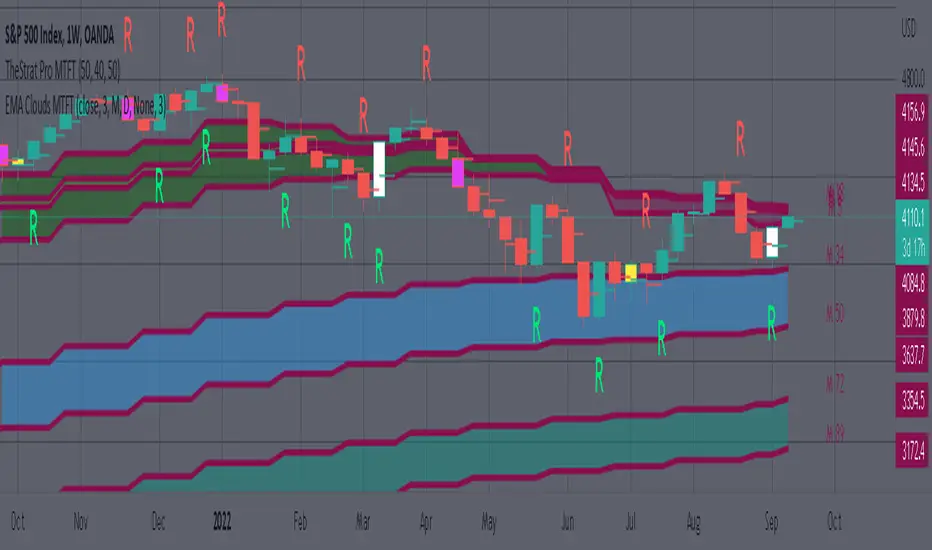
IMPORTANT NOTE: One of the lessons I would consider most important in attaining clarity regarding trading, is “TheStrat” by Rob Smith. His lesson on “actionable signals” is something that can be applied to any strategy. For this reason, I am including “MTFT TheStrat Patterns Pro” script in all images that will depict confluence for a better trade selection.
Example using TheStrat Pro MTFT with this indicator.
Look for a “TheStrat actionable signal” or a “TheStrat Reversal signal” on a smaller timeframe that has an instance of this indicator on a larger timeframe calculation that is in range of the candlestick that formed your actionable signal. This means that the indicators plot you are observing must be above the low and below the high of the candlestick that is the actionable signal/reversal signal. Image below shows what this would look like with this indicator.
The Image below shows what this would look like with this indicator. The selected candlestick is the Weekly, it shows a hammer actionable signal and the Monthly 34 EMA in range. This actionable signal is meant to be played in a long position. If the high is breached, you would enter a long position from the high of the hammer candlestick. For targets you would look at the previous pivots, for this example all targets were hit. Note that the “Entry” and “Targets” line were added manually and are not part of the script. Setups won’t always play out so nice and clean, but given that there is so many stocks and so many signals this is just a thought to improve the quality of the signal as it has extra confluence. If you are interested in learning further, research ‘TheStrat’ by Rob Smith.
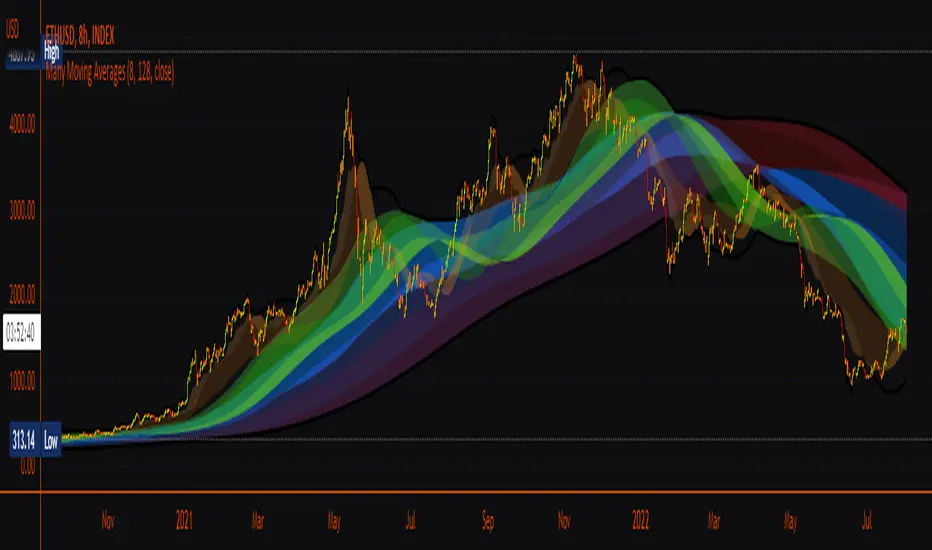
Many Moving AveragesA smooth looking indicator created from a mix of ALMA and LRC curves. Includes alternative calculation for both which I came up with through trial and error so a variety of combinations work to varying degrees. Just something I was playing around with that looked pretty nice in the end.
Rramires->5_EMAs 9, 21, 50, 100, 200The five EMA averages I use in my analysis in a single indicator.

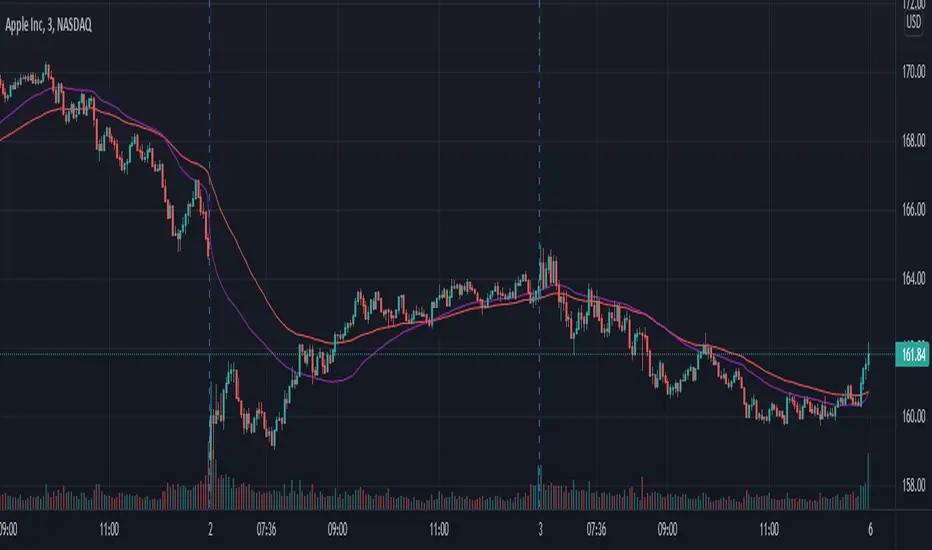
VWAP/EMA50/EMA200We script this one for combining VWAP , EMA50 and EMA200. The tool is fantastic if traders know how VWAP , EMA work? Just adding this script in your favorite and work like charm:
VWAP: How to trade with that
- One of the simplest uses of the VWAP is gauging support and/or resistance.
- A trader who is long a stock can use the VWAP as a target exit if its trading below.
- A stock trading over intraday VWAP may be bullish , while a stock trading under may be bearish .
EMA 50/EMA200: How to trade with that timeframe 50-day or 200-day period
- Identify the trend of market in longterm
- Golden-cross (short term EMA cross above longterm EMA ) is call golden-cross signals. It is opportunity for buying.
- Deal-cross ( short term EMA cross below longterm EMA ) is call dead-cross signals. It is opportunity for selling.
- Identify support levels
- Identify resistance levels
Let me know if you see anything else that should be added/changed.

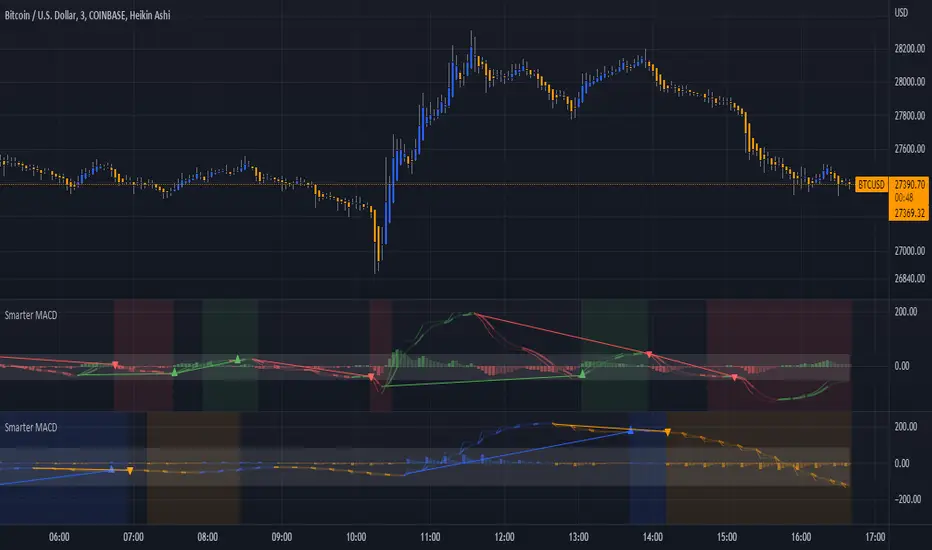
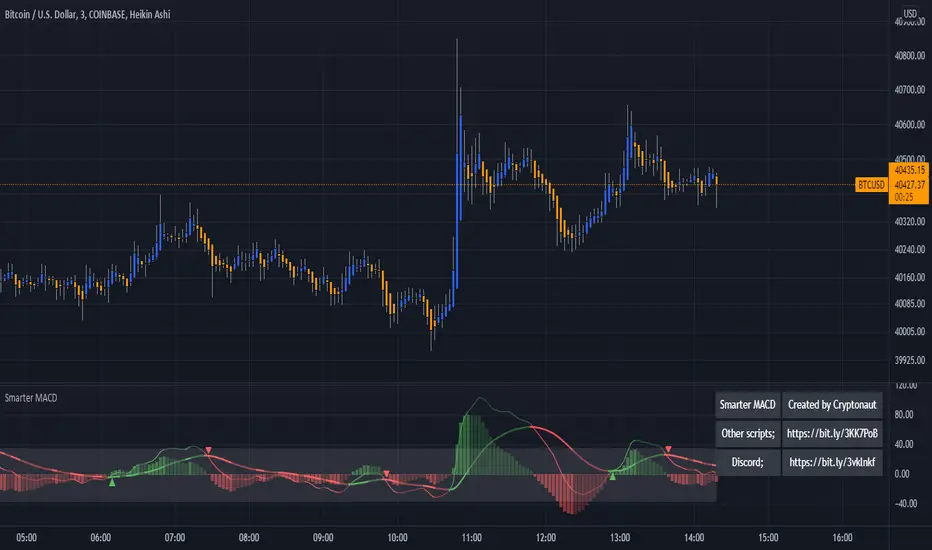
Smarter MACDA classic MACD with average peak and dip lines. The lighter green and red horizontal lines are the average peak and dip of the entire span, respectively. The second, bolder of the two lines are the averages of the peaks and dips above and below the overall peak and dip averages. The filled in color is to help visualize these averages and possible trade setups. Rework of the MACD + Averages script.
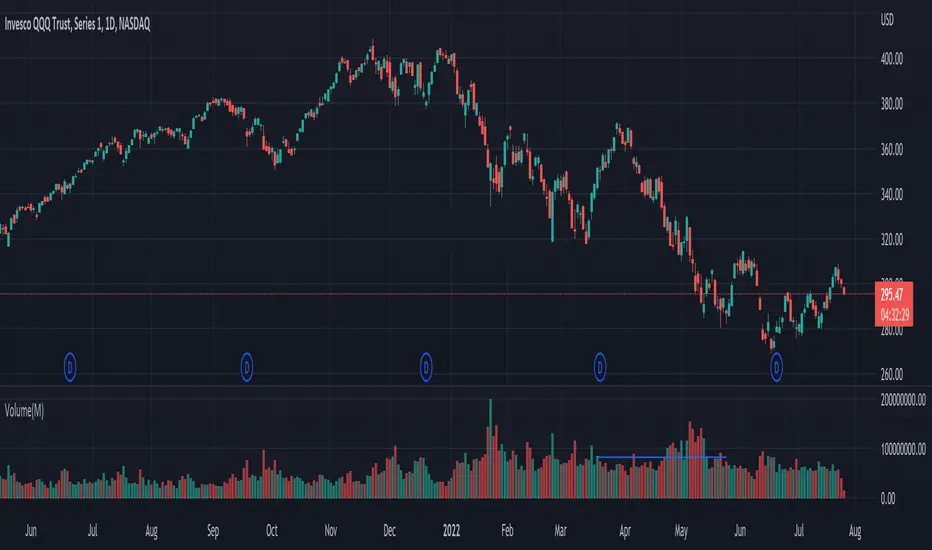
PClose Levels 2.0This script plots the levels generated via a combination of SPX 2Y Quartiles for everyday, red days, and green days. It is intended for use solely with SPX.
These quartiles are also sorted by VIX averages into bands that expand and contract with VIX.
It gives us an idea of what levels to potentially expect resistance/support fairly well, but is designed to be used in conjunction with other indicators and macroeconomic information.
Green Dashed is your Expected Max Range (EMR+) based on Green Day averages.
Green Dotted is your Expected Range (ER+) based on full dataset averages.
Green solid lines are POS2 and POS1, based on Green Day averages.
White Dotted is your Expected Move (EM), based on full dataset averages.
Red solid lines are NEG1 and NEG2, based on Red Day averages.
Red Dotted is your Expected Range (ER-) based on full dataset averages.
Red Dashed is your Expected Max Range (EMR-) based on Red Day averages.

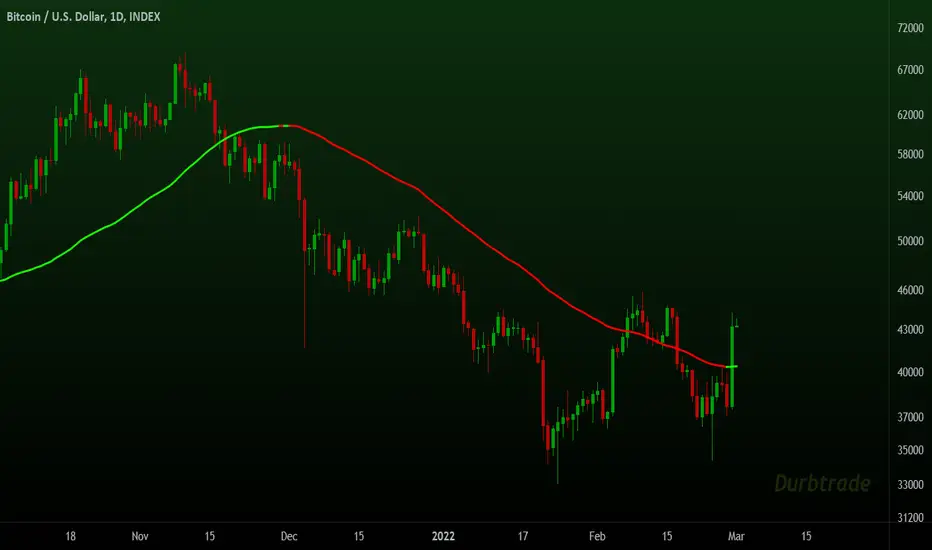
Moving Averages System - DurbtradeMoving Averages System - Durbtrade
1 indicator... customizable.
Displays up to 4 independent Moving Averages (MA's) at once.
Each MA can be 1 of 6 "MA Types" : SMA, EMA, WMA, VWMA, HMA, or DEMA.
There are 7 individual fills...
4 "MA/Source Fills" and 3 "MA/MA Fills".
The "Source" is selectable,
and there is a "Source Plot" option
to display a plot of the source.
No max value for MA "Length".
Each MA has what I call a "Length Multiplier",
and each MA has its own "Offset".
The colors of each MA,
as well as the Source Plot,
can be up/down "Color-Changing", or solid.
"Line Thickness" is unlimited.
Each of the 3 "MA/MA Fills" allow you to select which 2 of the 4 MA's to fill between!
All 7 fills are customizable by above/below colors, and opacity.
All 7 fills include a "Color Swap" option,
in the case that you need to switch the display of the above-color to the below-color,
and the below-color to the above-color!
All plots are scripted to be drawn visually in front of all fills!
Lastly, you can turn off the display of the MA plots and the Source Plot...
allowing the display of only fills!
--------------------------------------------
--------------------------------------------
Let's take a more detailed look!
First, let's go through the settings, and how to use the Moving Averages System.
You can divide the Inputs tab of the indicator settings into 3 main sections...
1 - Moving Averages
2 - Source Plot, and MA/Source Fills
3 - MA/MA fills
Let's discuss the first section, which is where we set up our MA's.
Here, we see the parameters for our 4 Moving Averages :
All 4 MA's can be customized here in the following ways...
- Toggle ON/OFF by checking the checkbox
- Length
- Length Multiplier
- Type (SMA, EMA, WMA, VWMA, HMA, or DEMA)
- Up/Down Color Change ON/OFF
- Line Thickness
- Offset
(The Plot Styles, Up/Down/Solid Colors, and Opacities of all 4 MA's
are customizable under the Style tab of the indicator settings)
There are no maximum value limitations for Length, Line Thickness, and Offset.
Of note, the "Length Multiplier" multiplies the "Length" value by a chosen integer.
This can be used to incrementally scan a wide spectrum of lengths very quickly.
Or it can be used to maintain ratios while increasing the MA display lengths...
just multiply all lengths by the same number.
It can also be used to easily create a moving average ribbon
by using multiple Moving Average Systems all at once.
Or, it can be another method to set up higher-timeframe MA's on a lower-timeframe chart...
for example, if both the chart and indicator are on the 1Hour timeframe,
you can multiply all of your set lengths by 24
to see the 1Day MA's of those same lengths on the 1Hour chart.
Next, lets look at the second section of the Inputs tab of the indicator settings,
where we edit the "Source Plot" and "MA/Source Fills".
We can turn ON/OFF the "Source Plot" -
which plots a line of the "Source" that you have selected -
and edit the parameters :
Checking the "Source Plot" box turns the "Source Plot" ON/OFF.
You can turn Up/Down Color Change ON/OFF,
and adjust Line Thickness and Offset.
(The Plot Style, Up/Down/Solid Colors, and all Opacities of the Source Plot
are customizable under the Style tab of the indicator settings.)
Next is where you can turn ON/OFF and edit each "MA/Source Fill".
Checking the "MA#1/Source Fill" box turns on the fill between MA#1 and the source.
You can choose the color and opacity for the above-color and the below-color.
Need to switch the display of the two colors?... turn on "Color Swap" to easily do just that.
The remaining 3 MA/Source Fills work in the same exact way...
turning on a fill between the associated MA#, and the source.
In total, there are 4 MA/Source Fills... 1 for each MA.
Note that neither the Source Plot, nor any of the MA's, need to be turned on
in order to use the MA/Source Fills.
Finally, lets look at the third section of the Inputs tab of the indicator settings.
This is where we can edit the 3 "MA/MA Fills".
An MA/MA Fill allows you to select any 2 of the 4 MA's that you have set,
and fill the space between them with color :
Checking the MA/MA Fill box turns ON/OFF the associated MA/MA Fill.
Below each ON/OFF switch are 2 boxes where you can select the 2 MA's that you want to fill between.
Select the 2 MA's that you want to use according to their MA#'s.
Next, you have the Above/Below Color/Opacity for the associated MA/MA Fill,
and lastly, the Color Swap option.
The numerical order of the MA#'s that you select here is of no concern,
because each MA/MA Fill has that "Color Swap" option...
and, as before, this swaps the display of the above-color and the below-color.
Note that the MA's do not need to be turned on
in order to use the MA/MA Fills.
--------------------------------------------
Additional Notes :
All colors and opacities of this indicator can be customized.
All fills can have above/below colors, and all plots can have up/down colors.
All fills and plots can be one static color, too.
All plots can be 1 of 10 plot styles:
Line, Line with Breaks, Step Line, Step Line with Diamonds, Histogram,
Cross, Area, Area with Breaks, Columns, or Circles.
All plots use the same single "Source", which is selectable.
And don't forget... you can try applying this indicator to other indicators!
--------------------------------------------
Now, let's take a look at some examples of the Durbtrade Moving Averages System in action!
All 4 MA's plots on, MA Type is SMA, color-changing on, lengths 50, 100, 150, and 200 :
Add the Source Plot, and all 4 MA/Source Fills :
Add the 3 MA/MA fills :
Turn off candles visibility, and turn off MA color-change :
Turn off the MA plots :
Turn off the Source Plot :
...
Here are some other images using the Multi Moving Average Tool :
Here it is on the 1Second :
Here it is on the 3Day :
Here is your 1Day SMA DeathCross :
Use 3 Moving Average Systems at once to build your own EMA Ribbon :
Compare 4 different MA types, all with the same length :
--------------------------------------------
Script Stats :
Pinescript Version : 5
Code Length : 149 Lines
Total Plots : 16
- Visible Plots : 5 (4 MA Plots, 1 Source Plot)
- Invisible Plots : 11 (4 MA Plots, 1 Source Plot, 6 MA/MA Fill Plots)
Total Fills : 7 (4 MA/Source Fills, 3 MA/MA Fills)
Total Colors/Opacities : 29
Total Unique Variables : 92
- Input Variables : 69
- Unique Output Variables : 23
--------------------------------------------
Final Thoughts :
I'm excited to share the Durbtrade Moving Averages System!
I think that this indicator has a wide range of MA-related applications,
an easy-to-use interface with maximum customization, and unique fill features...
all in one indicator.
I feel that it is a quick and useful tool
whether you are just plotting a few moving averages...
or you are creating intense kaleidoscopic tidal waves of colored data!
Either way, I think it is pretty awesome,
and so, I wanted to share it with you...
I hope that you enjoy it and find it useful!
- Please feel free to comment your thoughts, critiques, or suggestions. They are all very helpful!
- Also, please feel free to comment any positive feedback, or awesome screencaps/ideas of the indicator in action!
- Check out my other Pinescript indicators if you like this one... they work well together.
- I hope that you find this script useful.
- Enjoy!
--------------------------------------------
// Durbtrade
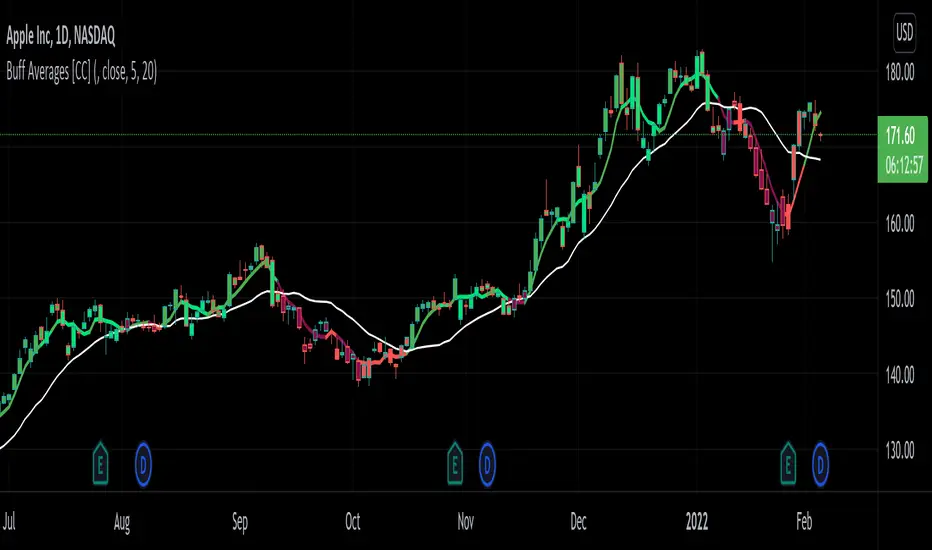
Buff Averages [CC]The Buff Averages were created by Buff Dormeier (Stocks and Commodities Feb 2001) and this is another hidden gem that is a combo of a volume weighted indicator and a moving average crossover system. It uses a special method to calculate the weighting based on volume. The colored line (fast buff) will follow the price closely and you use the other line to act as a trend confirmation. I have included strong buy and sell signals in addition to normal ones so strong signals are darker in color and normal signals are lighter in color. Buy when the line turns green and sell when it turns red.
Let me know if there are any other indicators or scripts you would like to see me publish!
MACD + AveragesA classic MACD with average peak and dip lines. The lighter green and red horizontal lines are the average peak and dip of the entire span, respectively. The second, bolder of the two lines are the averages of the peaks and dips above and below the overall peak and dip averages. The filled in color is to help visualize these averages and possible trade setups.
AveragesLibrary "Averages"
Contains utilities for generating averages from arrays. Useful for manipulated or cleaned data.
triangular(src, startingWeight) Calculates the triangular weighted average of a set of values where the last value has the highest weight.
Parameters:
src : The array to derive the average from.
startingWeight : The weight to begin with when calculating the average. Higher numbers will decrease the bias.
weighted(src, weights, weightDefault) Calculates the weighted average of a set of values.
Parameters:
src : The array to derive the average from.
weights : The array containing the weights for the source.
weightDefault : The default value to use when a weight is NA.
triangularWeighted(src, weights, startingWeight) Calculates the weighted average of a set of values where the last value has the highest triangular multiple.
Parameters:
src : The array to derive the average from.
weights : The array containing the weights for the source.
startingWeight : The multiple to begin with when calculating the average. Higher numbers will decrease the bias.
exponential(src) Calculates the exponential average of a set of values where the last value has the highest weight.
Parameters:
src : The array to derive the average from.
arrayFrom(src, len, omitNA) Creates an array from the provided series (oldest to newest).
Parameters:
src : The array to derive from.
len : The target length of the array.
omitNA : If true, NA values will not be added to the array and the resultant array may be shorter than the target length.
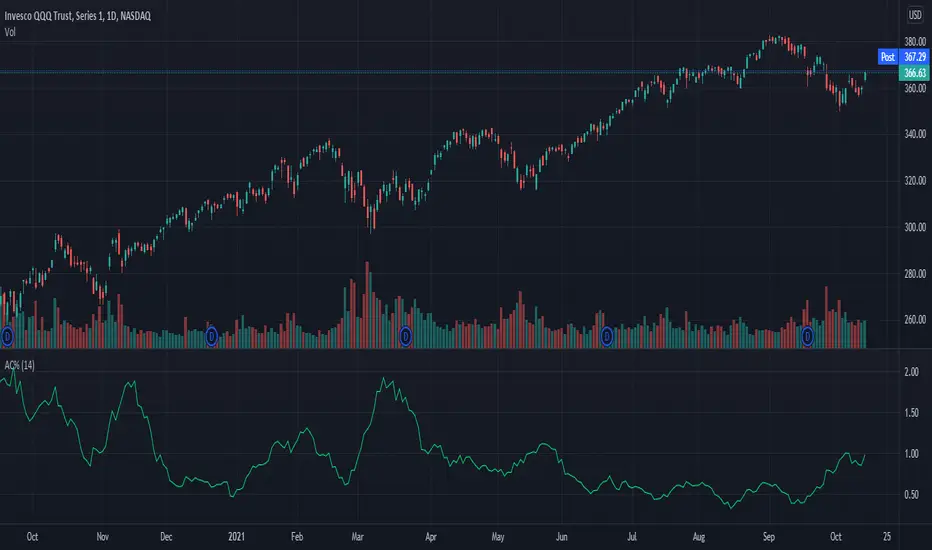
Average Change % (14-day)Simple script which calculates and shows the average change in a percentage format over a 14-day period.
Created due to the fact I couldn't find a percentage measure of average change when searching for it.
I have very little coding experience in Pine or otherwise so feel free to take and edit the script to make it a bit more user friendly.
Moving Average Ribbon [TheBearFighter]
This code was written using:
•Pine Script Coding Conventions.
This script provides a very useful tool for new community users and professionals. It puts at your disposal a Moving Average Ribbon by hand to graph and easily find the ones with the highest performance. The creation of this script was motivated because in free TradingView accounts there is a limit of 3 indicators by chart, and with this tool you can draw up to 32 MA's at the same time!
Choose one of 10 types of MA´s:
•KAMA Kaufman's moving average.
•HULL Hull moving average.
•TEMA Triple exponencial moving average.
•LSMA Least square moving average.
•DEMA Double exponencial moving average.
•ALMA Arnaud Legoux moving average.
•WMA Weighted moving average
•EMA Exponencial moving average.
•VWMA Volume Weighted moving average.
•SMA Simple moving average.
Use the tooltips to know the lengths of MA´s.
A main characteristic of the script is that the lengths are in days but when changing the lowest timeframes, the same daily resolution is maintained. This gives us extreme precision in intraday timeframes, e.g 30 minutes.
Once this is understood, we can turning the MA´s on/off, and changing the timeframe to our liking.
Available timeframes: M, W, D, 4H, 1H, 30m, 15m, 5m.
Also the MA´s are colored for easy visualization and know if they grow or decrease.
Thank´s to @midtownsk8rguy to let me know more about HEX colors.
Thank´s to @HPotter for his KAMA.

Average EnvelopeA script to calculate a support / resistance level which acts as either a bounce level or a flip level. This is rather a macro play guide than a day trade tool.
The average is calculated by taking into account monthly/weekly/daily highs and average them out.
The script also paints fib levels based on the values of the upper and the lower band.
While this was designed with a cryptocurrency market in mind (no 'close' values per-se) it holds with traditional markets as well.


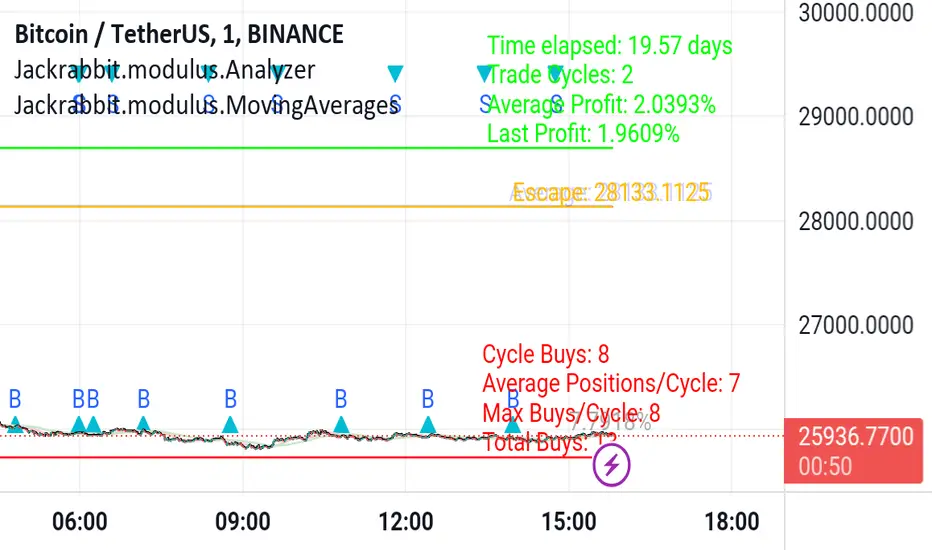
Jackrabbit.modulus.AnalyzerThis is the module Analyzer for the Jackrabbit suite and modulus framework.
As the modulus framework has grown both in size and complexity, it has become ever increasingly difficult to evaluate the profitability a very complex multi-layered modules combined.
The Jackrabbit Analyzer module allows you to do just that. Connect this module to the end of your IoI chain and it will tell you the profitability of your current combination, using TradingView's strategy backtesting capabilities.
With this module connected to your IoI chain, you can literally watch in real time as the analyzer evaluates your current settings and updates each time you make a change in those settings, giving you a better and more realistic approach to what is possible with your current strategy.
While this module is not a substitute for paper trading, it significantly increases the construction and analysis of a multi-layered trading paradigm that can then be taken to a paper trader with a high level of confidence of success.
Only the signal line is displayed.
The Jackrabbit modulus framework is a plug in play paradigm built to operate through TradingView's indicator on indicatior (IoI) functionality. As such, this script receives a signal line from the previous script in the IoI chain, and evaluates the buy/sell signals appropriate to the current analysis.
This script is by invitation only. To learn more about accessing this script, please see my signature or send me a PM. Thank you.
TS - Trend Moving AveragesOverview
Simple trend indentification indicator based on a mix of SMA & WMA components.
Default settings built for the 1D chart with an optional 3rd fast MA that can be toggled.
Can be used alongside more advanced Tradespot indicators
Access
PM me, our indicators come as a wider package.

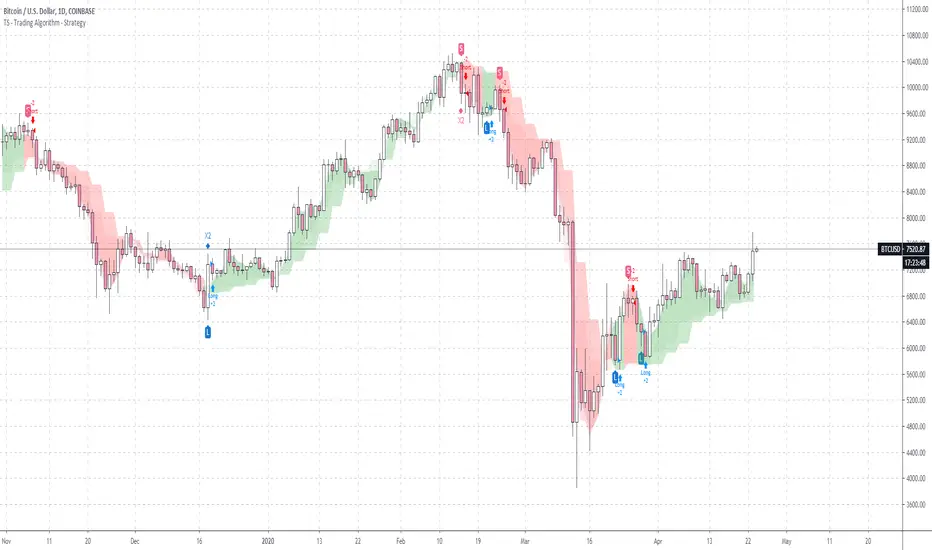
TS - Long Term Trading Algorithm - StrategyStrategy to the bespoke TS - Trading Algorithm. Highly profitable cryptocurrency trading model.
This script is long only profitable strategy- there is a script coming in the next few days for shorter timeframe long & short trading.
- Backtesting is from 2017.
- 0.05% commission
- 100% capital allocation per trade.
Access to both the backtesting strategy & indicator is paid - PM me for details.

TS - Trading Algorithm - StrategyStrategy to the bespoke TS - Trading Algorithm . Highly profitable cryptocurrency trading model.
Access to both the backtesting strategy & indicator is paid - PM me for details.
Indicator does not repaint and has no discretionary approach - you can follow blindly and take advantage of the performance.