ADX + RSI Strat// This is a strategy that uses the 7 Period RSI to buy when the indicator is shown as oversold (OS) and sells when
// the index marks overbought (OB). It also uses the ADX to determine whether the trend is ranging or trending
// and filters out the trending trades. Seems to work better for automated trading when the logic is inversed (buying OB
// and selling the OS) wihout stop loss.
Average Directional Index (ADX)

VWMA with kNN Machine Learning: MFI/ADXThis is an experimental strategy that uses a Volume-weighted MA (VWMA) crossing together with Machine Learning kNN filter that uses ADX and MFI to predict, whether the signal is useful. k-nearest neighbours (kNN) is one of the simplest Machine Learning classification algorithms: it puts input parameters in a multidimensional space, and then when a new set of parameters are given, it makes a prediction based on plurality vote of its k neighbours.
Money Flow Index (MFI) is an oscillator similar to RSI, but with volume taken into account. Average Directional Index (ADX) is an indicator of trend strength. By putting them together on two-dimensional space and checking, whether nearby values have indicated a strong uptrend or downtrend, we hope to filter out bad signals from the MA crossing strategy.
This is an experiment, so any feedback would be appreciated. It was tested on BTC/USDT pair on 5 minute timeframe. I am planning to expand this strategy in the future to include more moving averages and filters.

SADX+DI - Smoothed Average Directional Index by CrypTauxThis script is based on ADX/DI and I use it to enter when trend is in early stage, then ride it & exit at the right time (that's the theory)
ADX is shown as histogram :
- light silver bars = price is under thresold but still no trend, be patient.
- strong gray bars = prepare to enter the trade soon
- blue bars = price momentum so ride the trend
- yellow bars = do not trade (price reverts or consolidates)
Background color/bottom area based on DI+/DI- :
- green = uptrend
- red = downtrend
Top pink triangles appears when ADX is relatively low based on "lookback" history (not based on previous static threshold) so a new trend may happens so stay alerts.
- Prepare for enter when bars turn dark gray and/or pink triangles appears.
- Enter position as soon as you see blue bar (Long or Short as indicated by the area color)
- and Exit on first yellow bar.
Quite simple, works on multiple HTF/LTF and might be used with graphical analysis to find best opportunities.
Enjoy :)
--
Version 35.
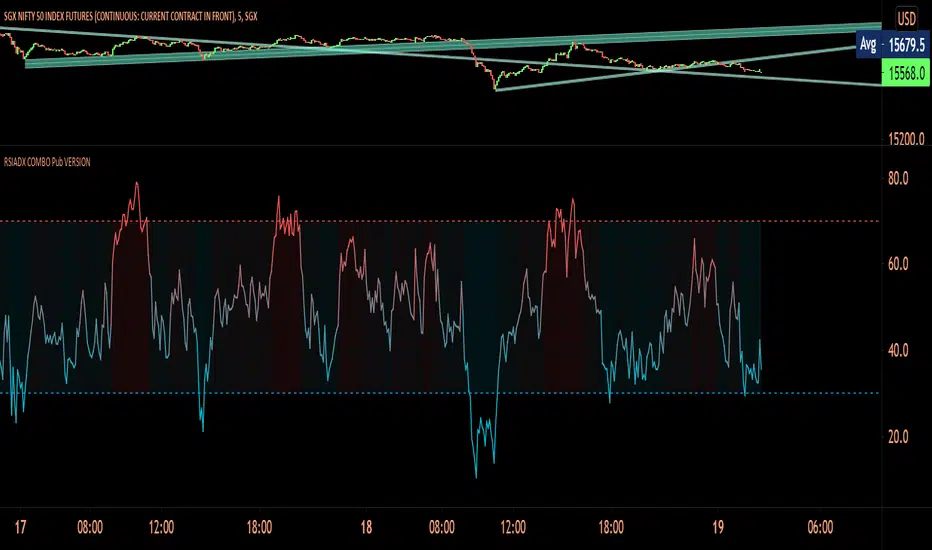
RSIADX COMBO Pub VERSIONIts a combination of RSI and ADX for better trend direction . Along with Atr is included as 2nd confirmation of trend , RSiADX with bullish and bearish zones along with HMA and EMA and Divergence for trend trading. Support and Resistance is too added which you can hide according to your need .
Entry rules :
Look for OB(+10) and OS (-10)area along with hma crossover or crossunder of support and resistance .. !
----------------
Disclaimer
Copyright by FaizanNawazz.
The information contained in my scripts/indicators/strategies/ideas does not constitute financial advice or a solicitation to buy or sell any securities of any type. I will not accept liability for any loss or damage, including without limitation any loss of profit, which may arise directly or indirectly from the use of or reliance on such information.
All investments involve risk, and the past performance of a security, industry, sector, market, financial product, trading strategy, or individual’s trading does not guarantee future results or returns. Investors are fully responsible for any investment decisions they make. Such decisions should be based solely on an evaluation of their financial circumstances, investment objectives, risk tolerance, and liquidity needs.
My scripts/indicators are only for educational purposes!
Happy Trading!
ADX Triple - Average Directional Movement Index - TradingEDThis case study is based on a previous ADX + DM study, but with three different counts to compare different trends. The use of this indicator is restricted to private use, and it can be used only by invitation. Different functionalities have been added to the original code, such as alerts and signals that seek to make trading much easier to interpret by any type of trading operator of any experience level, from beginner to intermediate and advanced.
Key components of the original indicator:
• The DIRECTIONAL MOVEMENT INDEX (DMI) is a technical indicator that measures both the strength and direction of a price movement and is intended to reduce false signals.
• The DMI uses two standard indicators, one negative (-DI) and one positive (+DI), in conjunction with a third, the AVERAGE DIRECTIONAL INDEX (ADX), which is non-directional but shows momentum.
• The larger the spread between the two primary lines, the stronger the price trend. If +DI is way above -DI the price trend is strongly up. If -DI is way above +DI then the price trend is strongly down.
• ADX measures the strength of the trend, either up or down; a reading above 20 indicates a strong trend.
ADX is plotted as a single line with values ranging from a low of zero to a high of 100. ADX is non-directional; it registers trend strength whether price is trending up or down. The indicator is usually plotted in the same window as the two DMI lines, from which ADX is derived. When +DI is above -DI , there is more upward pressure than downward pressure in the price. Conversely, if -DI is above +DI , then there is more downward pressure on the price. This indicator may help traders assess the trend direction. Crossovers between the lines are also sometimes used as trade signals to buy or sell, theay are the main trade signals. A long trade is taken when the +DI crosses above the -DI and an uptrend could be underway. Meanwhile, a sell signal occurs when the +DI instead crosses below the -DI .
Main functions of this modified indicator:
1) You can select the type of MOVING AVERAGE , among many available options (SMA, EMA, DEMA, HMA, etc.)
2) The SOURCE for the counts can be determined by the trader (close, open, etc).
3) The MEASURE can be based on a CANDLES count if you are trading OHLC Charts from 1D onwards , or if your trading is intraday, you can also select counts by MINUTES , HOURS or DAYS , depending on your trading style.
4) LENGTH , by default it will be loaded as in the STRATEGY , but considering the previous point, you can modify it according to your convenience.
5) You have the option to hide or show a LABEL at the top of the chart, with respect to the signals: BULLISH green, BEARISH red.
Main performance functions of this modified indicator:
I) In the case of the PERFORMANCE that appears at the right of the chart, you have the option to adjust the WIDTH of each box.
II) The TEXT of the PERFORMANCE is not modifiable, but you can customize the default color. *
III) The BACKGROUND of the PERFORMANCE , you can customize the default color. *
IV) You have the option to hide or show a PERFORMANCE that appears at the right of the chart.
Main functions to customize the style of this indicator:
a) You can select the color for ADX and for DMI , with the colors that best suit you.
b) The CROSSOVER/CROSSUNDER signal between DI+ and DI- can also be customized. *
c) For any type of SIGNAL , it is painted as a VERTICAL LINE in the graph, you can change the color that comes by default. *
d) In the case of the LABELS that appear at the top, the text is not modifiable, but you can customize both the type of label and change the default color. *
e) You can select the colors for the BACKGROUND of the indicator according to the trend, whether it is BEARISH or BULLISH , with the colors that best suit you. *
* By default, they are marked as red for downtrends and green for uptrends.

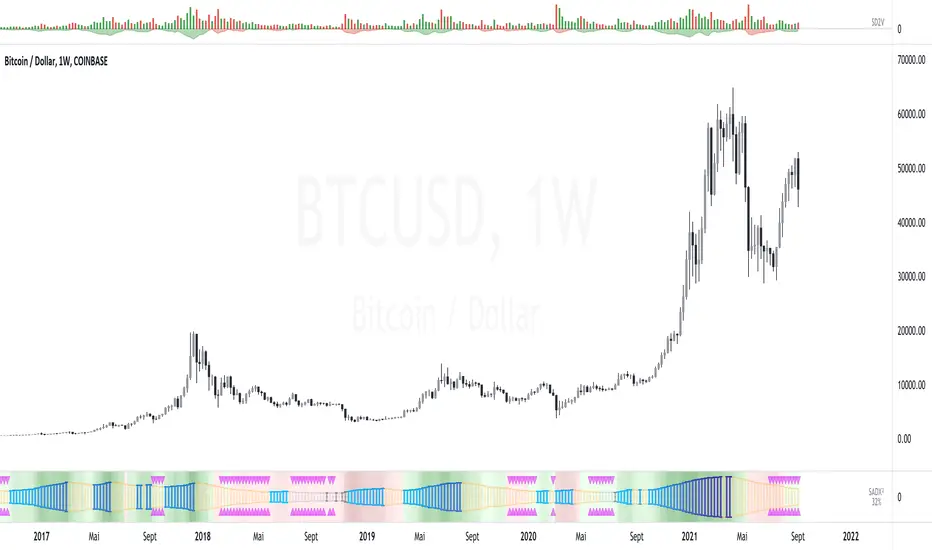
KINSKI ADXThis ADX indicator (Average Directional Index) tries to estimate the strength of a trend. The Average Directional Index is derived from the positive (+DI) and the negative directional indicator (-DI). The direction of movement is determined by comparing the highs and lows of the current and past periods.
As soon as the indicator determines a trend strength for upward or downward trend, a label is displayed. An upward trend is labelled "Bullish Trend". The downward trend bears the label "Bearish Trend".
The clouds in the background represent the movements of the Average Directional Index High/Low:
Color orange: neutral, uncertain in which direction it is going.
Color green: upward trend
Color red: downward trend
The line represents the average value of the ADX signal:
Color orange: neutral: still uncertain in which direction it is going
Color green / outgoing line: upward trend
Color green / descending line: weakening upward trend
Color red / exiting line: downward trend
Color red / descending line: weakening downward trend
The following configurable options are possible:
"ADX Smoothing
Directional Index Length
Level Range
Level Trend

Bollinger Band + RSI + ADX + MACD + HeikinashiThis script takes into picture Bollinger Bands, RSI with a comparator value, ADX with a comparator value, and MACD with Heikinashi Direction
THIS IS A LONG-ONLY STRATEGY. SHORT TRADES ARE NOT INCLUDED
Strategy:
The Strategy takes a trade only after ALL the following conditions are met.
Candle low is lower than the Bollinger Lower band
RSI is higher than the comparator value
ADX is higher than the comparator value
MACD value is higher than the Signal value
Stop Loss : Max of (Low of the candle - 0.22% and Close of the candle - 0.32%) - FYI, because its max, it's lower of the 2 and your risk is lesser
Target : Max of (Bollinger Band Upper band and 0.75% of the value of underlying) - FYI, it takes the maximum available

Tradelivio's Ranging vs Trending Indicator ADXThis indicator is based on ADX and helps identify if a market is ranging/consolidating or trending.
Default setting are as follows:
0-15 Absent Trend
15-25 Weak Trend
25+ Strong Trend
FYI:
50-75 Very Strong Trend
75-100 Extremely Strong Trend
You can configure 3 levels of strength (Absent, Weak & Strong)
Please keep in mind that a falling ADX line only means that the trend strength is weakening, and it usually does not mean the trend is reversing, unless there has been a price climax.

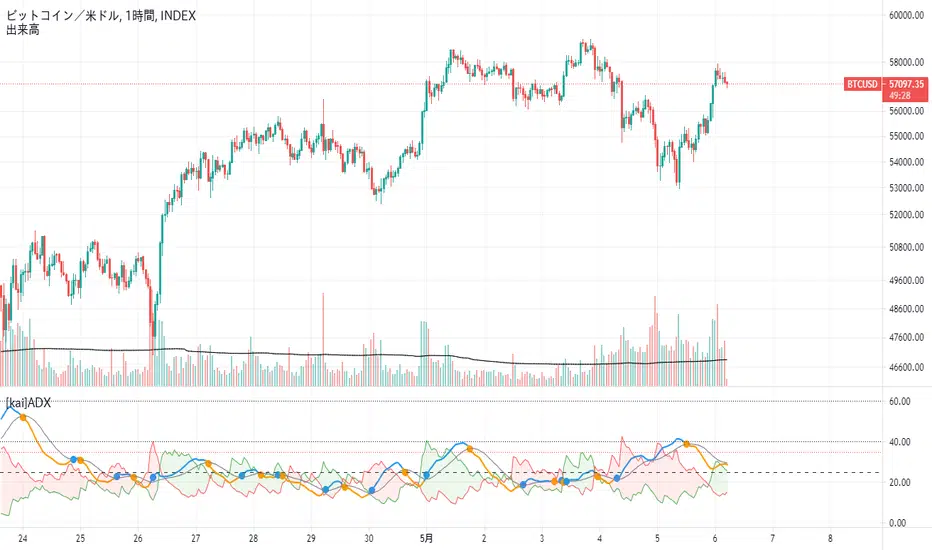
[kai]ADXIt is an indicator that makes it easy to understand the change of ADX by adding a moving average to the famous indicator ADX.
Since ADX and DI have a part where the calculation formula of DI + and DI- is fixed to one bar, there was a problem that it does not make much sense to increase the length.
The biggest feature of this indicator is that it allows you to calculate multiple bars by increasing the multipler option.
For example, by setting multipler = 4 in the 1-hour time frame, it is possible to resemble the calculation result of the 4-hour bar in a multi-time frame.
How to use this Inge is the same as how to use ADX and DI
When ADX (orange) GX (blue circle), take a position in the direction of DI (green zone, red zone),
I think the payment is good when ADX (blue) is DX (orange circle)
when DI +(green), DI-(red) is 35 or more, contrarian is dangerous.
有名なインジケーターのADXに移動平均を付けてADXの変化をわかりやすくしたインジケーターです
ADXとDIはDI+,DI-の計算式がバー一本固定の部分があるので、lengthを増やしてもあまり意味がない問題がありました
このインジではmultiplerオプションを増やすことによって、複数のバーを計算できるようにしたのが最大の特徴になります
例えば1時間足でmultipler=4にすることでかなりマルチタイムフレームの4時間足の計算結果に似せることができます
このインジの使い方は、ADX、DIの使い方と同じです
ADX(オレンジ)がGX(青丸)した時にDI(緑塗り、赤塗り)の方向にポジションを取って、
ADX(青)がDX(オレンジ丸)した時に、決済がよいと思います
DI+(緑),DI-(赤)が35以上の時に逆張りは危険です
fDMI Binance Leveraged Tokensthis scans 20 tickers for my low dm indication. Telegram alerting included, and It is configured with all Binance leveraged tokens by default. For my shitcoining moonbros on CZ ;)

[CADCHF] DinhChienFX's Predict signaltrend: crossing 2 times upper 2/lower 2 - stop/profit: 1/1 - Entry: Upper/lower 1, Entry 2: 0.66 (66%)
HH-HL/LL-LH: 15:15; ADX: 38, smooth: 9, DI: 9.
Order 1: 92 trades - 65.22% - R/R: 1/1
Order 2: 64 trades - 54.02% - R/R - 1/1.94 (fibonacci 66%)
Total 2 order: 156 trades - 59.62% - Net Profit: 201.46% - Max drawdown: 9.02%.
Commission: 4usd/trade
slippage: 2
1. Identify the trend
* On the chart:
a. Part of Dow theory: multi-trades active at the impulse waves.
Uptrend trend:
- HH / Higher High: The following peak is higher than the previous one .
- HL / Higher Low: The back bottom is higher than the previous one .
Downtrend:
- LL / Lower Low: The back bottom is lower than the previous one .
- LH / Lower High: The posterior peak is lower than the previous one
Pivot left: 15
Pivot right: 15
b. Keltner price channel:
- Uptrend: Go above Upper 2 two times
- Downtrend: Down to Lower 2 two times
* Under Chart:
ADX indicator: Used to identify a strong trend
- ADX smooth: 9
- DI: 9
- ADX = 38
2. Entry point:
- Buy: Buy limit at the Upper Keltner channel.
- Sell: Sell limit at the Lower Keltner channel.
3. Take profit, stoploss
ATR indicator (20) ( Average true range ) * 2

MA Crossover Strategy with MA Turning Point Exits + ADX filterThis strategy is based upon @rthomson's MA Crossover Strategy with MA Turning Point Exits.
I just added an ability to filter out entries when ADX < 20. In fact you have a choice to set this ADX threshold value.
In a sideways market, the MA crossovers end up in yielding entry trades with losses. ADX value around 20 to 25 indicates a sideway market. By introducing ADX threshold, we are trying to prevent potential loss making entries.

MA Crossover Strategy with MA Turning Point Exits + ADX filterThis strategy uses @rthomson's "MA Crossover Strategy with MA Turning point Exits" and combines it with ADX.
This strategy filters out any entries where ADX < 20. In fact you can set the value for ADX threshold. (Generally value under 20 for ADX is considered as non trend zone)

Directional Movement Index and ADXDMI (ADX) consists of three indicators that measure a trend’s strength and direction. Three lines compose the Direction Movement Index (DMI): ADX (white/gray line), DI+ (green line), and DI- (orange line). The Average Directional Index (ADX) line shows the strength of the trend. The higher the ADX value, the stronger the trend. The ADX line is white when it has a positive slope, otherwise it is gray.
The Plus Direction Indicator (DI+) and Minus Direction Indicator (DI-) show the current price direction. When the DI+ is above DI-, the current price momentum is up. When the DI- is above DI+, the current price momentum is down.
Trend detection: When the background has a bluish color there is an upward trend, and when the background has a reddish color there is a downward trend.
Includes an information panel that shows the current value and trend of some well-known indicators.

FUERSTUses Normalized Price Oscillator and Stochastics and combines them as an ADX weighted measure.
During low trend intensity Stochastics gets higher weighted than Price Oscillator, and vice-versa in times of high trend-intensity.

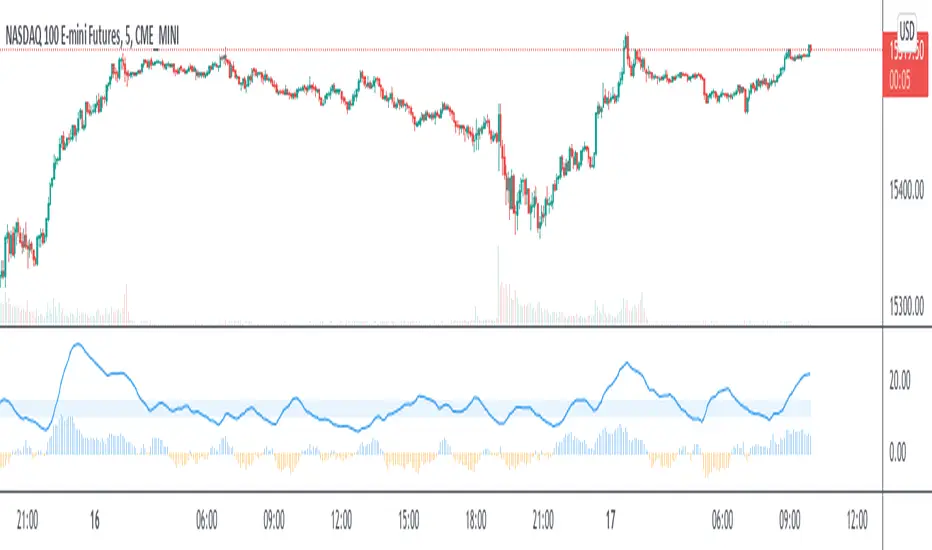
RedK Trader Pressure Index (TPX v1.0) Quick Summary
---------------------
The RedK Trader Pressure Index (REDK_TPX) analyzes the changes in price bars to give the trader a clear visual insight that represents the ongoing fight between the bulls (buyers) and bears (sellers) in the market - to determine who is in control of the price action, which in turn can be helpful in a trader’s decision about how the price action may be unfolding, what type of trade and positions to take (or to close) and when is the ideal time to action.
How the TPX calculation works
---------------------------------------
The TPX uses a simple logic and that’s one of the things I like about it – there is no complex calculation or magic stuff - and the core idea makes sense to me, as well as being one of the ways I needed to analyze my price charts.
The underlying assumption is that the buyers and sellers are competing for control of the market at all time.
- if there’s more buyers than sellers in the market, and if the buyers’ (or bull) pressure is stronger (than the sellers’), they will be able pull the “price range” up – and that means that on the price chart we can expect to see an increase in value in both the “high” and the “low” of the next price bar.
- Similarly, if there’s more sellers than buyers in the market, and if the sellers’ (or bear) pressure is stronger (than the buyers’), they will be able push the “price range” down – on the price chart we can expect to see a decrease in value in both the “high” and the “low” of the next price bar.
So, we will use the change in high and low price, between 2 consecutive price bars, as a proxy for the bull and bear “pressures” – a (weighted) moving average of these “pressure” values are then calculated along with the “Net Pressure” – the final results are plotted.
The importance of the "Control Level"
-----------------------------------------------
As in similar price-action based indicators, there’s a certain threshold or “control level”, above which, the pressure becomes “dominant”
when the bull or bear pressure is above that threshold, they will dominate and control the price move – this level can be found around the 25 or 30. I have included the ability to plot and adjust that control level in the TPX’s settings – and I also show some examples in the chart above (weekly chart for MSFT)
The code is commented and the chart is annotated to explain how to “read” the TPX – and how to interpret the values on the price chart
Using the Trader Pressure Index (TPX) in trading
------------------------------------------------------------
TPX can be valuable in showing well-supported (up or down) price moves that may lead to a strong trend that we can ride (when the pressure value is above the control level) - see exampled above
TPX is also valuable in showing when there’s “lack of interest” from the buyers or the sellers (or both) – which is great in exploring chub or no-trade zones - so basically when to avoid trading.
As usual, it's always recommended to use these types of "price action insight" indicators in conjunction with other trend and momentum indicators (moving averages, MACD..etc), so the insight we gain from them can be properly placed within the broader "context" - and to receive additional confimtion signals to support the trading decision.
I will come back later to post something about how the TPX differs from my recently-posted Strength of Movement (SoM) because they wok completely differently but can be used together with great synergy – and also how the TPX compares to the classic DMI/ADX which uses a similar concept.
Please feel free to integrate in your trading – hope you find this useful - comments and feedback are always welcome

ADX Momentum cross + MacD + HH LL + Buy/Sell Signals and alerts Hello, This is the first indicator I have made and would like to contribute to the community.
This strategy came from trying to replicate a previous ADX Cross Indicator that I loved on MT4 which I used successfully on EUR/USD on high and low time frames. Through the process of trying to replicate it I failed, I decided to take what I had written so far and create my own ADX cross strategy using the combination of 3 ADX's, their lag. Then also using Higher highs and lower lows with the MacD to further filter the signals.
There are two buy and two sell conditions , the difference between these are just the order in which the ADX crossing determines the entry. The MacD and higher highs and lower lows are the same for filtering the signal.
You can change the look back for HH and LL look back range, along with the DI Length & ADX Smoothing for all ADX's. The lag used for either the buy or sell strategy with the Lag_Buy/Lag_Sell inputs. Lag_mid setting will affect all 4 conditions.
From testing and based on the ADX cross logic you should follow this structure when changing the inputs for:
DI Length: Lowest DI value (I.E. 1)
DI Lengtha: Middle DI value (I.E. 2)
DI Lengthb: Highest DI value (I.E. 3)
ADX Smoothing: Lowest Smoothing value (I.E. 1)
ADX Smoothinga: Middle Smoothing value (I.E. 2)
ADX Smoothingb: Highest Smoothing value (I.E. 3)
I tested this on the EUR/USD, but mainly I have been using it on BTC/USDT(binance) and BTC/USDT Perpetual futures(binance) with the 5 minute chart. I suggest playing around with the settings depending on the Symbol and timeframe you use because the default settings are what I last found to be optimal for my self on the 5min BTC/USDT Perpetual futures(binance) chart.
A good starting point I found when using the indicator on other charts is to use the below values:
DI Length: 7
DI Lengtha: 14
DI Lengthb: 21
ADX Smoothing: 7
ADX Smoothinga: 14
ADX Smoothingb: 21
If you have any questions, suggestions, or requests for this indicator feel free contact me. You can either comment on here or Message me
If you like this indicator please like and comment where you found it useful.

Stoch DMIStochastics applied to adjusted ADX to represent the trend direction. DM based sub-indicators added to hint the momentum and changes in the ADX.

asw Stochastic + DIStochastic and ADX (not plotted) DI positive and negative combined.
This is done to remove the lines of DI +/- and make chart cleaner with just single point plot showing DI crossing.
DI + above DI - = Green dot shown (bullish signal)
DI + below DI - = Red X-cross shown (bearish signal)
Enjoy!

MAX SAHAM ADX with DI Max Saham's ADX line with D+ & D-
ADX is used to quantify trend strength.
When the D+ (+DMI) is dominant and rising, price direction is up.
When the D- (-DMI) is dominant and rising, price direction is down. But the strength of price must also be considered.
Uses Wilder's MA to get a more accurate ADX reading as compared to SMA.
Also added the green background to indicate the trend and also dots to indicate bull and bear crossing of the DMI's

ADX of VortexHow to Trade
> Rising ADX of Vortex from 10 to 15 is trend building area to be noticed.
> If ADX of Vortex is falling but above 10 and below 15 avoid trade in such case because even if signal is generated by cross over of Vi-Plus and VI-Minus it may not give good profit.
> Once the position is taken and Price is steady but ADX of Vortex is falling then keep eye on cross over of Vi-Plus and VI-Minus to exit from trade.
> ADX rising above 15 is strong trending signal.
Sentinel Program - A Bollinger Band Strategy, with alertsThis script plots the Bollinger Bands and confirms entry and exits by using RSI values, Stoch, and ADX Curve. Works on any time-frame.
The scope of the script is to reduce the number of fake breakouts to prevent further declines when entering positions. Often times when using Bollinger bands, a close below the lower band presents a buying opportunity but there is further movent to the downside and vise versa when taking profits.
Entry Conditions
Prior candle low below lower band
RSI above 30
Stochastic crossover above 20
ADX curve greater than 25
Exit Conditions
Prior candle highw above upper band
RSI crosses below 70
Stochastic crossunder above 80
Each of the above values can be adjusted in the inputs menu to fine-tune your entry and exit positions.
Using COINBASE:ETHUSD we can see that the conditions have been met before plotting buy and sell signals.
I have added alerts to help identify possible entry and exits and from there I manually enter or exit / adjust stop-loss. For example, sometimes it will print a sell signal because stochastic crossed over but RSI is still rising so I will adjust a tighter stop-loss to capture further gain if they are there.
Test it out, adjust the settings to see if you can find better results, and let me know!

MrBS:Directional Movement Index [Trend Friend Strategy]This goes with my MrBS:DMI+ indicator. I originally combined them into one, but then you cannot set alerts based on what the ADX and DMI is doing, only strategy alerts, so separate ones have more flexibility and uses.
Indicator Version is found under "MrBS:Directional Movement Index " ()
//// THE IDEA
The majority of profits made in the market come from trending markets. Of course there are strategies that would say otherwise but for the majority of people, THE TREND IS YOUR FRIEND (until the end). The idea is to follow the trend, entering once it has established its self and exiting positions when the trend weakens. This strategy gives a rough idea of the returns produced from following purely the ADX signals. At first Heikin Ashi values were used for the calculation but the results show it's not that effective. The functionality to switch between calculation types has been left in, so we can uses HA candle data to generate signals from while looking at an OHLC chart, if we want to experiment. Due to the way strategies work, we are unable to get reliable results when running the strategy on the HA chart even if we are calculating the signals from the real OHLC values. It is best to always run strategies on standard charts.
When using this strategy, I look for confirmation of the signal based on stochastic (14:3:6) direction, reversal level of stochastic, and divergance, to add confidence and adjust position size accordingly. I am going to try and code some version of that in future updates, if anyone can help or has suggestions please drop me a message.
//// INDICATOR DETAILS
- The default settings are for optimized Daily charts, for 4 hour I would suggest a smoothing of 2.
- The default values used for calculation are the Real OHLC, we can change this to Heikin Ashi in the menu.
- The strategy enters a position when ADX crosses the threshold level, and closes the position when ADX starts to fall.
- There is a signal filter in the form of a 377 period Hull Moving Average, which the price must be above or bellow for long and short positions respectively.
- The strategy closes the position when a cross-under of the ADX and its 4 period EMA. This is an attempt to stay into positions longer as sometimes the ADX will fall for 1 bar and then keep rising, while the overall trend is strong. The downside to this is that we exit trades later and this affects our max drawdown.
