Supertrend BandsSupertrend Bands
What is the Supertrend indicator?
"The Supertrend indicator is a trend following overlay on your trading chart, much like a moving average, that shows you the current trend direction.
The indicator works well in a trending market but can give false signals when a market is trading in a range.
It uses the ATR (average true range) as part of its calculation which takes into account the volatility of the market. The ATR is adjusted using the multiplier setting which determines how sensitive the indicator is."
"For the basic Supertrend settings, you can adjust period and factor:
- The period setting is the lookback for the ATR calculation
- Factor is the what the ATR is multiplied by to offset the bands from price"
How to use this indicator
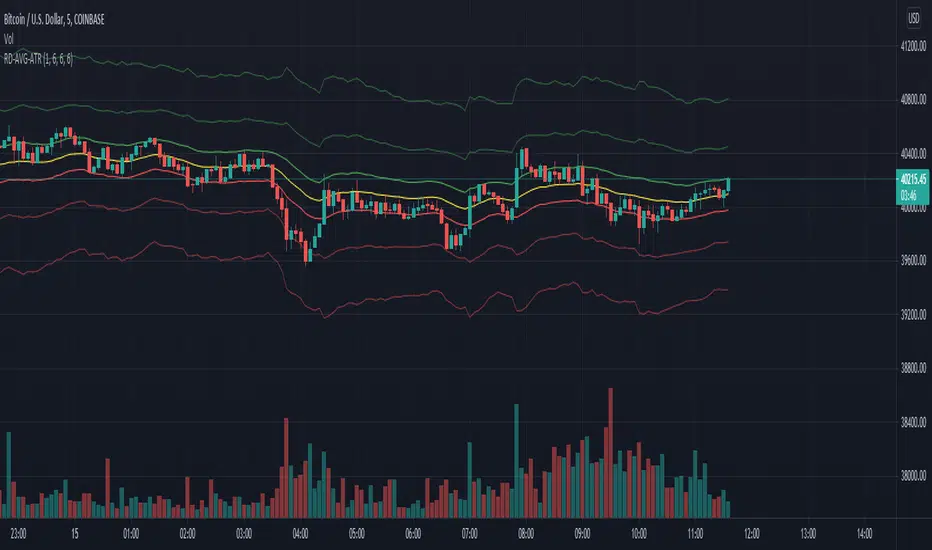
This indicator is inspired by a strategy I found. It includes four Supertrend indicators, each with different settings that displays trend strength and support/resistance zones. The default settings are optimal for cryptocurrency but do work quite well for traditional also. I highly recommend you try experimenting with different settings, increasing them to suit the instrument.
The bands are set from low to high, Band 1 being the fastest and Band 4 being the slowest. Band 4 is the one that sets the overall trend so when price is above Band 4, the trend is bullish and vice versa. Trend is strongest when price is above/below Band 1 and gets weaker as it filters through each band. Band 4 provides the strongest support/resistance and if that breaks the trend flips.
In the menu, you will see an option called "Remove Anti Trend?". It is enabled by default and it removes any bearish/resistance bands when the trend is up and any bullish/support bands when the trend is down. When turned off, it will show all Supertrend Bands as they are by default.
Bar Colors
Bar colors are optional and they reflect the current trend strength based on the Supertrend bands.
Alternate ways of using this indicator
You could leave everything as default or you can display individual bands. For instance, because I use many overlay indicators, most of the time I turn off all the bands and only show bar colors:
You can also turn off Bands 1 and 2 and only show the two slowest lengths:
This removes the noise of the two faster Supertrends.
Or just show the two fastest bands:
Any suggestions to improve this indicator are most welcome :)
ATR

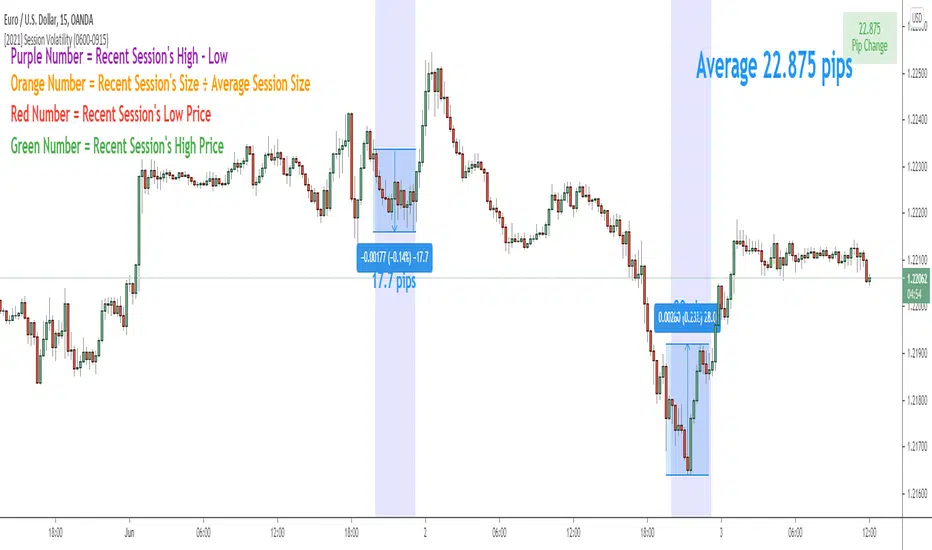
Session Volatility CalculatorHey traders!
This script calculates the average volatility of trading sessions.
You specify a start date, an end date, and a session time (eg. market open, Asian session etc)
The script then scans through all the price action on your chart and calculates the average price movement during that specified period.
What Is It For?
I created this script for my own purposes when developing certain strategies and testing certain ideas.
The purpose of this script is to give you an idea of how much price tends to move during certain times of day for certain markets.
You could think of it as a "session's average true range".
In crypto and forex this might be how much price tends to move on certain pairs during the Australian/Asian session, or the European session, or the overnight U.S. session etc.
In stocks this might be how much a symbol tends to move during the first hour of the day or the last hour of the day.
The point of calculating this information is for better understanding how markets move during certain times of day.
It's not a perfect science obviously since some days can be wilder than others depending on what fundamental events are developing, but it's useful information to have for times when there are no expected volatility-inducing events.
This info can help with optimizing targets and stop loss placement for certain day-trading strategies, and just generally getting an idea of what kinds of moves you might reasonably expect out of overnight positions or certain times of day etc - or at least that's what I use it for.
Settings
Hover your mouse over the "i" symbol to get more information on the script's settings, but here's a brief description:
Start Date: The date to begin calculating from (set to 1000 by default so it scans the entire chart).
End Date: The date to stop calculating (set to 2099 by default so it scans the entire chart)
Time Session: This is the time session during the day that you want to analyze.
Color Background: If turned on, this setting changes the background color to highlight the session.
Indicator Values
The indicator outputs a handful of values onto your chart. This is what the colors correspond to:
Top-Right Box: The average price range during the given time of day over historical price action.
Green Number: The recent session's highest price.
Red Number: The recent session's lowest price.
Purple Number: The recent session's price range (high - low).
Orange Number: The recent session's range ÷ the average (outputs a relative % of the average).
HMA_ATR StrategyATR with HMA experimental minimalist bot for ETHBTC .
A strategy for use by Automated Algorithm systems.
Different from normal ATR as it uses HMA for smoothing.
Example settings result shown here on chart include commission 0.5%

MTF atr_channelThis is the Multi TimeFrame Version of previous atr channel, which uses the ATR percent(atr%) instead of the 2% fixed deviation for calclation of bollinger bands.

Trex [MrD3v]To appreciate dear Mr.Khakestar efforts i have converted his mt4 ATR formula to pine script. All credits goes to him.
Special Thanks To shayankm
Long Step $ Short Step added
DR added
Standard SL added
Eng.SL and Hunter.SL added.
Incompatible default colors with dark theme now are fixed.
Colors can be changed from settings.
All drawing sizes can be modified from settings. (Change the sizes for your mobile device)
Now crypto and fx markets are automatically detected.
Added APR only working on Crypto and FX.
Outputs on "BTCUSD(T), FX, Main metals" are now rounded to pips.

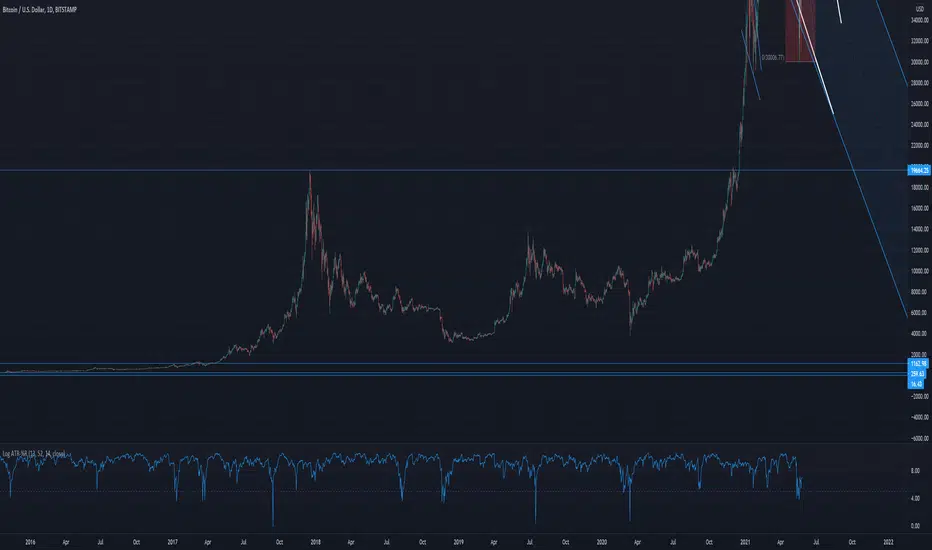
Log ATR-%RThis indicator uses a combines the "Williams %R" and "ATR_Normalized" indicators to find potential price bottoms, as suggested by simultaneous extreme values on both of the aforementioned indicators. This is represented by near zero values one this indicator. A log transform is used to make the dips easier to spot.
ATR-%RThis indicator uses a combines the "Williams %R" and "ATR_Normalized" indicators to find potential price tops and bottoms, as suggested by simultaneous extreme values on both of the aforementioned indicators.

RexDog Average with ATRBam-- look what Rex did. A RexDog Average with ATR bands-- he's going insane. Simple but powerful.
This indicator includes the RexDog average but provides you with the ability to plot (and customize) both above and below ATR calculated bands.
With this indicator you can display all 3 or any combination of the bands: the RexDog Avg, Adding ATR Upper or the Subtracting ATR Below.
To remove a plot or customize color and line size go to the style options.
Before we get detailed with this version you can customize the default average factor of the RexDog Avg (default is 6). More tips on this below.
How This Works
Just as with the RexDog Average we take the 6 ATR data points (200, 100, 50, 24, 9, 5). We then create an average by dividing by 6. But wait there's more...
With this indicator you can customize independently the above and below bands via a float value for precision. 6 is the default (you can customize by increments at 0.25 or input value you like 1-20).
Now this works opposite how you might think but you'll get it once you start changing the numbers. For instance, editing the above band lowering the ATR factor will raise the band.
RexDog Avg Factor
With this release you are able to change the default average factor (6) to anything you want. You'll find though going too high or low from the default won't get the best results. The default increment change is 0.1 but you can enter any float value you like between 1-20.
The Original RexDog Average Overview
Yes, simple—the RexDog Average is a bias moving average indicator. The purpose is to provide the overall momentum bias you should have when trading an instrument. It works across all markets and all timeframes.
Usage:
Price above the RexDog AVG = long momentum bias
Price below the RexDog AVG = short momentum bias
With the ATR addition most likely your usage will be similar to Bollinger Bands. While not the same as in deviations much of the same principles might apply, especially with customization.
*Note: we have banned the word “trend” in the RexDog Trading Method.
Additional Usage Advice:
If price rips through the average your momentum bias should probably change. 80% of the time when price moves through the RexDog Average it will come back and test the area around average within 1-2 bars. 20% of the time it does not. The momentum is so strong in that direction so look for a 50-70% tests of the bar that impulse through the RexDog Average.
If you are using the RexDog Trading Method by default if the price is above the average and you are short you are in a fade trade. The momentum trade would be long. Of course reverse if price is below.
On multiple time frames. Of course, one timeframe can be long bias and a lower timeframe can be short bias. Which one do you use? Both—if your in a short trade using lower timeframe and with the bias of the average your in a momentum trade—but on the higher timeframe your aware you are essential fading the overall momentum.
Background:
Rex and I searched high and low for one simple thing. A moving average (or combination of some) that we could use to form our momentum bias that worked for all timeframes and all markets we trade.
We tried and tested them all. Even went down the path of ribbons and various other types of hybrid EMA /MA derivatives. Nothing had a high enough accuracy or mathematically was reliable that we could say with a high probability that it was on the right side of the momentum.
We almost stopped and landed on using the true and tested 200 MA—but we found through extensive tests that using the 200MA or EMA you’re often late to the party. Look you don’t need to be the first one in the trade but having a heads up sure helps.
To quote one of the best financial movies of the modern era—Margin Call:
“There are three ways to make a living in this business: be first, be smarter, or cheat… it sure is a hell of a lot easier to be first”. The RexDog Average used properly enables you to be first or damn near close.
Under the Hood:
This is so simple most reading this will discount it. You might even scoff and berate Rex for wasting your time. But you would be wrong. The RexDog Average has been tested across all markets—FOREX, Crypto, Equities, Futures (even tick charts), and even the Penguin population in Antarctica.
The RexDog Average is an average of 6 simple moving averages: 200, 100, 50, 24, 9, 5.
Yes, that’s it.
FibFans on Previous HTF HL [FaizanNawaz] by DGTFibonacci Fans application on top of Previous Higher TimeFrame High and Low. Idea owner is @faizannawaz1, special thanks to him for both the idea and tesing the application
WARNING : Study includes plottings in the future, and due to temporal gaps in non 7/24 markets such as weekends, holidays etc plotting of the fans will move to the open session (the effect will be observed on Friday and Monday). With crypto no any side affect will be observed.
More about Fibonacci Fans, how to apply fibonacci fans and automated fibonacci speed and resistance fans study
Adiitonally the study includes some addons, such as
Central Pivot Range and Traditional Pivot Points
Volume Weighted Colored Bars
Price Range Meter - Horizontal HTF Candle
Disclaimer :
Trading success is all about following your trading strategy and the indicators should fit within your trading strategy, and not to be traded upon solely
The script is for informational and educational purposes only. Use of the script does not constitute professional and/or financial advice. You alone have the sole responsibility of evaluating the script output and risks associated with the use of the script. In exchange for using the script, you agree not to hold dgtrd TradingView user liable for any possible claim for damages arising from any decision you make based on use of the script

Position Sizing w/ ADR&ATR TrackingScript to use for position sizing based on portfolio size, max position, and max loss inputs. The option to use custom entry and stop are available, but default to last price for entry, and Low of Day (LoD) for stop. The ATR % is a measure of the low of day to current price as a percentage move.
Credit to LonesomeTheBlue for the base code on position sizing and TheScrutiniser/GlinckEastwoot for ADR formula
-Nelgoth, best of luck

MATR 4H Strategy - UpTradingEN // MATR 4H Strategy - UpTradin
Use 1:
This script is effective for all assets. Find out how to get the best performance. This indicator offers several possibilities:
- Only in TimeFrame 4H.
- The gray curve shows you the trend. You should not trade against it.
- Once the trend is established you can buy or sell according to the Buy and Sell sign.
- When the orange point (warning) appears you must remain attentive to a continuation of the movement or a reversal.
Use 2:
You can program limit orders using the green or red stripe. These are two bands that anticipate the high or low point of the price.
Legend:
- The gray line is an Ema 20 based on a Daily TimeFrame.
- The orange point means a continuation or a reversal.
- Buy means a buy zone.
- Sell means a sales area.
- The green curve allows you to program a limit order to buy.
- The red curve allows you to program a limited order to sell.
Operation:
This script works from an ATR programmable according to your needs and correlated according to an Ema. It also shows you the trend in a single one thanks to an Ema 20 based on Daily data.
FR // MATR 4H Strategy - UpTrading
Utilisation 1 :
Ce script est efficace pour la totalité des actifs. Découvrez comment obtenir le fonctionnement idéal. Cet indicateur offre plusieurs possibilités :
- Uniquement en TimeFrame 4H.
- La courbe grise vous indique la tendance. Il ne faut pas trader contre celle-ci.
- Une fois la tendance établie vous pouvez acheter ou vendre selon le signe Buy et Sell.
- Lorsque le point orange (warning) apparaît vous devez rester attentif à une continuation du mouvement ou d’un retournement.
Utilisation 2 :
Vous pouvez programmer des ordres limites grâce à la bande verte ou rouge. Il s’agit de deux bandes qui anticipent le point haut ou bas du prix.
Légende:
- La courbe grisée est une Ema 20 basée sur un TimeFrame Daily.
- Le point orange signifie une continuation ou un retournement.
- Buy signifie une zone d’achat.
- Sell signifie une zone de vente.
- La courbe verte vous permet de programmer un ordre limite à l’achat.
- La courbe rouge vous permet de programmer un ordre limité à la vente.
Fonctionnement:
Ce script fonctionne à partir d’un ATR programmable suivant vos besoins et corrélé suivant une Ema. Il vous indique également en une seule la tendance grâce à une Ema 20 basée sur des données en Daily.

NVME TP & SL systemNVME TP and SL system is an ATR based risk management tool that is designed to identify possible stop loss and take profit points for you to follow depending on the volume generated by the average true range. Sometimes, they zones may be really close together and this often occurs during a ranging period of the market where there is little movement and this can be fixed if you increase the values on the settings. Moreover, you can input your entry price and what position you are looking for such as a short or a long and then the indicator will generate some zones for you to follow too. The zones will not update after every bar close but instead follow the main setting of bar reset period where the indicator will generate new zones if x bars has passed, default is 20.
Features:
3 Take profit zones ( all customisable: colour, atr multiplier, display toggle on and off )
1 Stop Loss Zone ( all customisable: colour, atr multiplier, display toggle on and off )
Custom Position (Long or Short)
Custom Entry Point (Up to 9 decimal places)

Comprehensive Market AnalyzerVERSION 2.0:
Notice to users: To better reflect its extensive features, this indicator has been renamed from "Tsūrubokkusu (Toolbox) 🧰" to "Comprehensive Market Analyzer". Thank you for your understanding and adaptation to this change.
Purpose and Usage:
The Comprehensive Market Analyzer is designed to provide traders with a holistic view of market conditions by integrating various technical indicators into a single,
cohesive tool. Each indicator has been carefully selected and improved to work together, offering enhanced customization and advanced market insights.
This combination allows for more comprehensive market analysis, improved decision-making, and efficient trading strategies.
📘 Machine Learning Integration
Purpose : Utilizes machine learning algorithms to analyze past market data and provides predictive insights based on historical data.
Usage : Activate machine learning features, set lookback windows, influence weighting, and start bar for improved trend predictions.
Activate Machine Learning :
Description : Enables advanced machine learning features that analyze past market data.
Details : This feature allows the algorithm to use historical data to forecast market movements, providing traders with enhanced predictive insights on historical data.
Kernel Lookback Window :
Description : Sets the number of previous bars that the algorithm will analyze.
Details : A higher number provides a broader view of market trends, while a lower number makes the model more sensitive to recent changes.
Kernel Influence Weighting :
Description : Adjusts the emphasis on recent versus older data.
Details : Increasing this value gives more importance to recent data, potentially making predictions more responsive to new trends.
Kernel Calculation Start Bar :
Description : Specifies the bar number from which to start the machine learning calculations.
Details : Avoids early data which may contain excessive noise and less reliable market signals.
Kernel Functions :
Gaussian Kernel :
Description : Uses a Gaussian distribution to weight historical data, focusing on more recent data points for trend analysis.
Details : Calculates weights based on the Gaussian distribution, emphasizing data points closer to the present.
Laplacian Kernel :
Description : Applies Laplacian distribution, emphasizing data points closer to the current time more heavily.
Details : Uses the Laplacian function to provide a different perspective on data weighting.
RBF Kernel :
Description : Utilizes a Radial Basis Function for smoothing and analyzing data, providing a different approach to trend prediction.
Details : Applies the RBF function to smooth data and enhance the accuracy of trend predictions.
Wavelet Kernel :
Description : Applies wavelet transform for analyzing frequency components, helping to detect patterns in the price movements.
Details : Uses wavelet-based calculations to focus on specific frequency components within the data, aiding in pattern recognition.
📘 Enhanced Ichimoku Kinkō Hyō Integration
Purpose : Provides a comprehensive overview of market trends and momentum using the Ichimoku Kinkō Hyō indicator.
Usage : Display various components of the Ichimoku Kinkō Hyō, customize their appearance, provides additional calculations for trend analysis.
Display Ichimoku Kinkō Hyō :
Description : Toggle to show or hide the Ichimoku Kinkō hyō indicator.
Details : This indicator helps traders see support and resistance levels, trend direction, and potential future movements.
Activate Heikin-Ashi Source :
Description : Switches between regular price data and Heikin-Ashi candles for analysis.
Details : Heikin-Ashi candles smooth price data, making trends easier to spot.
Display Tenkan-Sen Line :
Description : Shows the Tenkan-Sen line, a key short-term trend indicator.
Color Customization : Set the color of the Tenkan-Sen line for better visibility.
Minimum Length : Determine the shortest period for calculating the Tenkan-Sen line.
Maximum Length : Determine the longest period for calculating the Tenkan-Sen line.
Dynamic Length Adjustment : Automatically adjusts the length of the Tenkan-Sen based on market conditions.
Display Kijun-Sen Line :
Description : Shows the Kijun-Sen line, a key medium-term trend indicator.
Color Customization : Set the color of the Kijun-Sen line for better visibility.
Minimum Length : Determine the shortest period for calculating the Kijun-Sen line.
Maximum Length : Determine the longest period for calculating the Kijun-Sen line.
Dynamic Length Adjustment : Automatically adjusts the length of the Kijun-Sen based on market conditions.
Kijun-Sen Divider Tool : Adjust the sensitivity of the Kijun-Sen calculation.
Display Chikou Span :
Description : Shows the Chikou Span, which lags behind the current price to help confirm trends.
Bear Phase Color : Set the color for bearish periods.
Bull Phase Color : Set the color for bullish periods.
Consolidation Color : Set the color for consolidation periods.
Minimum Length : Determine the shortest lag period for the Chikou Span.
Maximum Length : Determine the longest lag period for the Chikou Span.
Dynamic Length Adjustment : Automatically adjusts the length of the Chikou Span based on market conditions.
Display Senkou Span A and B :
Description : Shows the Senkou Span A and B, which form the Ichimoku Cloud indicating future support and resistance levels.
Bear Color : Set the color for bearish clouds.
Bull Color : Set the color for bullish clouds.
Neutral Color : Set the color for neutral periods.
Minimum Length : Determine the shortest period for calculating the Senkou Span.
Maximum Length : Determine the longest period for calculating the Senkou Span.
Dynamic Length Adjustment : Automatically adjusts the length of the Senkou Span based on market conditions.
Projection Offset : Set how far ahead the Senkou Span is projected.
Kumo Cloud Settings :
Enable Kumo Cloud Fill : Toggle to fill the space between Senkou Span A and B with color.
Cloud Fill Transparency : Adjust the transparency of the cloud fill.
Apply WMA Smoothing :
Description : Smooths the indicator lines using a Weighted Moving Average to clarify trends.
Bar Coloring Based on Ichimoku Signals :
Description : Colors the bars based on Ichimoku signals to provide a quick visual indication of market sentiment.
Bearish Signal Bar Color : Set the color for bars during bearish signals.
Bullish Signal Bar Color : Set the color for bars during bullish signals.
Consolidation Signal Bar Color : Set the color for bars during consolidation periods.
Neutral Bar Color : Set the color for bars during neutral conditions.
Enhanced Calculations :
Heikin Ashi Values : Smooths price movements to make trends more visible.
Alternative Source Calculation : Uses a different method for calculating the indicator based on user settings.
Volume Calculations : Enhanced functions for calculating volume based on different candlestick patterns.
Dynamic Length Adjustment : Automatically adjusts the length of Ichimoku components based on market volatility.
Gaussian Kernel Calculations : Uses advanced calculations for smoother and more accurate trend analysis.
Chikou Span Adaptation : Improved calculation for the Chikou Span using dynamic lengths and advanced methods.
Visual Enhancements : Adds color gradients to the Senkou Span and dynamic coloring for the Chikou Span to improve trend visibility.
Plotting Ichimoku Components :
Tenkan-Sen : Plots the Tenkan-Sen line with dynamic adjustments.
Kijun-Sen : Plots the Kijun-Sen line with dynamic adjustments.
Senkou Span A and B : Plots these lines with dynamic projections and advanced smoothing.
Chikou Span : Plots the Chikou Span with dynamic offsets and coloring.
📘 Enhanced Candlestick Patterns Integration
Purpose : Identifies and displays various candlestick patterns to help traders spot key market movements and potential reversals.
Usage : Toggle the display of patterns, select specific pattern types, and customize pattern labels for improved visual analysis.
Display Patterns :
Description : Toggle to enable or disable the display of all candlestick patterns.
Details : When enabled, all selected candlestick patterns will be displayed on the chart, aiding traders in identifying key market movements and potential reversals.
Select Pattern Type :
Description : Select the type of candlestick patterns to detect.
Details : Options include Bullish (indicating potential upward trends), Bearish (indicating potential downward trends), or Both.
Trend Filter Method :
Description : Select the method to filter trends.
Details : Options include True Range (based on price range), Fractals, Volume, Combined, or None (no filtering).
Pattern Label Colors :
Bullish Pattern Color : Choose the color for labeling Bullish patterns, indicating potential upward trends.
Bearish Pattern Color : Choose the color for labeling Bearish patterns, indicating potential downward trends.
Indecision Pattern Color : Choose the color for labeling Indecision patterns, indicating no clear trend direction.
Base Line and Patterns Display Options :
Show Base Line in Place of Labels : Toggle to display a base line instead of labels for detected patterns. This helps visualize the general trend.
Show Counterattack Lines : Toggle to display Counterattack Lines patterns, indicating potential reversal points.
Show Dark Cloud Cover : Toggle to display Dark Cloud Cover patterns, a bearish pattern suggesting a potential reversal from an uptrend to a downtrend.
Show Engulfing Patterns : Toggle to display Engulfing patterns. Bullish Engulfing patterns suggest a potential upward reversal, while Bearish Engulfing patterns suggest a potential downward reversal.
Show Hammer Patterns : Toggle to display Hammer patterns, a bullish pattern indicating a potential reversal from a downtrend to an uptrend.
Show Hanging Man Patterns : Toggle to display Hanging Man patterns, a bearish pattern indicating a potential reversal from an uptrend to a downtrend.
Show Harami Patterns : Toggle to display Harami patterns. Bullish Harami patterns suggest a potential upward reversal, while Bearish Harami patterns suggest a potential downward reversal.
Show In-Neck Patterns : Toggle to display In-Neck patterns, indicating a potential continuation of the current trend.
Show On-Neck Patterns : Toggle to display On-Neck patterns, indicating a potential continuation of the current trend.
Show Piercing Patterns : Toggle to display Piercing patterns, a bullish pattern suggesting a potential reversal from a downtrend to an uptrend.
Show Three Black Crows : Toggle to display Three Black Crows patterns, a bearish pattern suggesting a potential reversal from an uptrend to a downtrend.
Show Thrusting Patterns : Toggle to display Thrusting patterns, a bearish pattern suggesting a potential continuation of the downtrend.
Show Upside Gap Two Crows : Toggle to display Upside Gap Two Crows patterns, a bearish pattern suggesting a potential downward reversal after an upward gap.
Show Evening Star : Toggle to display Evening Star patterns, a bearish pattern suggesting a potential reversal from an uptrend to a downtrend.
Show Inverted Hammer : Toggle to display Inverted Hammer patterns, a bullish pattern suggesting a potential reversal from a downtrend to an uptrend.
Show Morning Star : Toggle to display Morning Star patterns, a bullish pattern suggesting a potential reversal from a downtrend to an uptrend.
Show Shooting Star : Toggle to display Shooting Star patterns, a bearish pattern suggesting a potential reversal from an uptrend to a downtrend.
Show Doji Patterns : Toggle to display Doji patterns, indicating market indecision and potential reversals.
Show Dragonfly Doji : Toggle to display Dragonfly Doji patterns, a bullish pattern suggesting a potential reversal from a downtrend to an uptrend.
Show Evening Doji Star : Toggle to display Evening Doji Star patterns, a bearish pattern suggesting a potential reversal from an uptrend to a downtrend.
Show Gravestone Doji : Toggle to display Gravestone Doji patterns, a bearish pattern suggesting a potential reversal from an uptrend to a downtrend.
Show Long-Legged Doji : Toggle to display Long-Legged Doji patterns, indicating high market indecision and potential reversals.
Show Morning Doji Star : Toggle to display Morning Doji Star patterns, a bullish pattern suggesting a potential reversal from a downtrend to an uptrend.
Show Rising Three Methods : Toggle to display Rising Three Methods patterns, a bullish pattern suggesting a continuation of the uptrend.
Show Falling Three Methods : Toggle to display Falling Three Methods patterns, a bearish pattern suggesting a continuation of the downtrend.
Show Tasuki Patterns : Toggle to display Tasuki patterns, indicating potential trend continuation after a gap.
Show Marubozo : Toggle to display Marubozo patterns, indicating strong trend continuation, either bullish or bearish.
Show Long Lower Shadow : Toggle to display Long Lower Shadow patterns, indicating strong buying pressure and potential upward movement.
Show Long Upper Shadow : Toggle to display Long Upper Shadow patterns, indicating strong selling pressure and potential downward movement.
Show Three Inside Up/Down : Toggle to display Three Inside Up/Down patterns, indicating potential bullish or bearish reversals.
Show Kicker Pattern : Toggle to display Kicker patterns, indicating significant potential reversals.
Show Tweezer Tops/Bottoms : Toggle to display Tweezer Tops/Bottoms patterns, indicating potential reversals at the tops or bottoms.
Show Mat Hold Pattern : Toggle to display Mat Hold patterns, a bullish pattern suggesting a continuation of the uptrend.
Candle Body/Shadow Comparison Options :
Candle Body/Shadow Comparison : Choose the criteria to compare candle sizes: Shadows (larger shadows), Body (larger body), Both (larger shadows and body), Either (larger shadows or body), or None (no comparison).
Look-back Period for Candle Comparison : Specify the number of periods to look back when comparing the current candle size to determine if it is significant.
Period for Body Length Average : Specify the period for calculating the average body length of candles to help identify significant patterns.
Period for Candle Length Average : Specify the period for calculating the average length of candles to help identify significant patterns.
Specific Pattern Thresholds :
Doji Body Percentage Threshold : Set the percentage threshold for identifying Doji patterns based on the candle body size compared to its range.
Upper Shadow Percentage Limit : Set the maximum allowed upper shadow percentage of the candle’s range for identifying specific Doji patterns.
Lower Shadow Percentage Limit : Set the maximum allowed lower shadow percentage of the candle’s range for identifying specific Doji patterns.
Price Deviation Tolerance : Specify the price deviation tolerance for pattern recognition, which helps in identifying patterns within a certain price range.
Thrusting Neck Percentage : Set the percentage threshold for identifying Thrusting Neck patterns, indicating a potential continuation of the current trend.
Base Line Settings :
Base Line EMA Length : Specify the length of the EMA for the Base Line, helping to visualize the general trend.
Enhanced Calculations :
Wavelet Transform : If machine learning is enabled, calculates the wavelet transform for smoother and more accurate pattern detection.
Candle Body and Shadows Calculation : Detailed calculations for candle body and shadow lengths to improve pattern detection.
Average Calculations : Calculate averages for body and candle sizes to help identify significant patterns.
Fractals Calculation : Identify fractal highs and lows to aid in trend detection.
Trend Filters : Apply user-selected trend filters based on True Range, Fractals, Volume, or a combination.
Pattern Detection and Labeling : Detects and labels various candlestick patterns, including Doji, Engulfing, Hammer, and more, with options for displaying labels or base lines.
Alerts and Notifications : Set alerts for detected patterns and base line colors to notify traders of significant market events.
Plotting Candlestick Patterns :
Pattern Detection : Automatically detects and labels various candlestick patterns based on user settings.
Label Customization : Customize the labels for different patterns, including color and text.
Base Line Plotting : Option to plot a base line instead of labels for detected patterns, enhancing trend visualization.
Alerts for Patterns : Set alerts for detected patterns to keep traders informed of significant market changes.
📘 Enhanced Fibonacci Retracement Integration
Purpose : Provides a tool for identifying potential support and resistance levels using Fibonacci retracement.
Usage : Toggle the display of Fibonacci levels, adjust the lookback period, and customize the appearance of Fibonacci levels for better market analysis.
Auto Mode :
Description : Toggle to enable or disable automatic detection of price points.
Details : When enabled, the highest and lowest price points within a specified period will be automatically detected to set Fibonacci levels. Disable to manually set the top and bottom prices.
Period :
Description : Set the lookback period for detecting price points.
Details : Defines the number of bars to look back when detecting the highest and lowest prices in Auto Mode, used for calculating Fibonacci levels.
Manual Top :
Description : Manually set the top price level.
Details : Adjust this setting to reflect the peak price of interest when Auto Mode is disabled.
Manual Bottom :
Description : Manually set the bottom price level.
Details : Adjust this setting to reflect the low price of interest when Auto Mode is disabled.
Display Fibonacci :
Description : Toggle to show or hide Fibonacci retracement levels.
Details : When enabled, the calculated Fibonacci levels will be displayed on the chart, overlaying the price data.
Baseline Levels :
Description : Select Fibonacci levels to highlight as baselines.
Details : Choose specific levels to be visually distinct, emphasizing their significance in the analysis.
Fibonacci Levels Colors :
Upper Levels Color : Set the color for Fibonacci levels above the baseline, indicating potential resistance levels.
Lower Levels Color : Set the color for Fibonacci levels below the baseline, indicating potential support levels.
Baseline Levels Color : Set the color for highlighted baseline Fibonacci levels, making them stand out from other levels.
Display Individual Fibonacci Levels :
Show Level : Toggle to enable or disable the display of specific Fibonacci levels.
Level Value : Set the multiplier used to calculate each specific Fibonacci level relative to the price range.
Reverse Levels :
Description : Toggle to switch the calculation direction of Fibonacci levels.
Details : When enabled, levels are calculated in reverse, useful for analyzing downtrends.
Line Extension :
Description : Choose how Fibonacci level lines are extended on the chart.
Details : Options include extending lines to the left, right, or both, affecting their visual presentation.
Text Size :
Description : Adjust the font size of the labels for Fibonacci levels.
Details : Options range from large to tiny, allowing for readability adjustments according to user preference.
Line Style :
Description : Select the line style for Fibonacci levels.
Details : Options include solid, dotted, and dashed, providing visual distinction.
Line Width :
Description : Set the thickness of the Fibonacci level lines.
Details : A higher value makes the lines more prominent on the chart.
Baseline Line Style :
Description : Choose the line style specifically for the baseline levels.
Details : This can differ from other Fibonacci levels to emphasize their importance.
Baseline Line Width :
Description : Adjust the thickness of the baseline level lines.
Details : Can be set differently from other levels for visual emphasis.
Enhanced Calculations :
Automatic and Manual Top/Bottom Setup : Detect or manually set the highest and lowest price points.
Price Range Calculation : Determine the range between the highest and lowest prices.
Fibonacci Level Values : Calculate the values for each Fibonacci level.
Visual and Label Configuration : Configure visual aspects and labels for each level.
Plotting and Labeling :
Level Plotting :
Description : Plot each Fibonacci level on the chart.
Details : Draw lines representing each calculated level.
Label Customization :
Description : Customize the labels for Fibonacci levels.
Details : Include text, colors, and positioning for clarity.
📘 Supports and Resistances Integration
Purpose : Identifies key support and resistance levels to aid in market analysis.
Usage : Toggle the display of support and resistance lines, customize their appearance, and use Bollinger Bands for additional insights.
Display Supports and Resistances :
Description : Toggle to enable or disable the display of support and resistance lines.
Details : When enabled, support and resistance lines will be shown on the chart, providing key levels for market analysis.
Swing Period :
Description : Set the retrospective period for identifying swing points.
Details : A longer period captures more significant trends but may reduce sensitivity. The default value is 10.
Support Line Color :
Description : Set the color for support lines.
Details : Choose a color that enhances chart readability. Default is green.
Resistance Line Color :
Description : Set the color for resistance lines.
Details : Choose a color that makes resistance lines easily distinguishable. Default is red.
Trend-Based Line Color :
Description : Toggle to enable dynamic coloring based on trend direction.
Details : When enabled, the color of the lines will change according to the trend, aiding visual analysis.
Line Thickness :
Description : Adjust the thickness of the support and resistance lines.
Details : Choose a thickness value between 1 and 5 for better visibility.
Line Style :
Description : Select the style of the lines.
Details : Options include Solid, Dotted, or Dashed lines for visual distinction.
Number of Lines to Display :
Description : Set the maximum number of support/resistance lines to display.
Details : Adjust the number of lines to avoid clutter or to show more levels.
Display Bollinger Bands :
Description : Toggle to show or hide Bollinger Bands on the chart.
Details : Bollinger Bands provide a visual representation of volatility and potential price ranges.
Bollinger Bands Integration :
Description : Enable the integration of Bollinger Bands for S/R calculation.
Details : This feature adjusts the placement of S/R lines based on the market volatility captured by the Bollinger Bands.
Bollinger Bands Color Settings :
Description : Set colors for different Bollinger Band conditions.
Details :
Green: Prices above the median but below the upper band (potential overbought area).
Dark green: Prices above the upper band (strong upward momentum).
Light red: Prices below the median but above the lower band (potential oversold area).
Dark red: Prices below the lower band (strong downward momentum).
Fill Opacity Adjustment :
Description : Adjust the fill opacity between Bollinger Bands.
Details : Set the opacity level to balance visibility with other chart elements.
BB Sensitivity Level :
Description : Adjust the sensitivity for determining S/R levels near Bollinger Bands.
Details : A higher value increases the consideration of levels near the bands.
Band Width Multiplier :
Description : Control the width of the Bollinger Bands.
Details : Adjust the multiplier to expand or contract the bands based on market volatility.
Uniform BB Coloring :
Description : Apply a consistent color to Bollinger Bands.
Details : Simplify visual interpretation with a uniform color.
Plotting and Alerts :
Plotting Bollinger Bands :
Description : Plot the Bollinger Bands on the chart.
Details : The bands are colored based on the conditions set for market volatility and price ranges.
Alerts and Notifications :
Description : Set alerts for support/resistance breaks and Bollinger Band breakouts.
Details : Notify traders of significant market events related to these levels.
📘 Enhanced Trend Lines Integration
Purpose : Identifies and plots trend lines based on market structure to help traders understand market direction and potential buy/sell points.
Usage : Toggle the display of trend lines, customize their appearance, and use enhanced calculations for trend analysis.
Display Trend Lines :
Description : Enable or disable the display of trend lines on the chart.
Details : These trend lines are calculated based on market structure, specifically through the detection of Breaks of Structure (BOS). If enabled, the trend lines will help in identifying the market overall trend and potential buy and sell points.
Trend Line Colors :
Upper Line Color : Set the color for the upper trend lines to enhance visual distinction.
Lower Line Color : Set the color for the lower trend lines, aiding in easy identification of support levels.
Pivot Labels :
Show Pivots Labels : Control the display of pivot labels on the chart.
Pivot Label Size : Select the size of the pivot labels displayed on the chart. Options include Tiny, Small, Normal, Large, and Huge.
Trend Line Calculations :
Pivot Depth : Adjust the depth for pivot calculation based on the selected timeframe to capture significant price movements.
Pivot Deviation : Set the deviation for pivot calculation to identify key turning points.
Pivot Backstep : Define the backstep for pivot calculation to ensure accurate detection of pivot points.
Enhanced Calculations :
Market Structure Detection : Utilize advanced algorithms to identify key market structures, improving trend line accuracy.
Adaptive Parameters : Automatically adjust pivot depth, deviation, and backstep based on the selected timeframe for better relevance.
Zigzag Calculation : Implement zigzag patterns to dynamically adjust trend lines, ensuring they reflect current market conditions.
Slope and Intercept Calculation : Compute the slope and intercept for trend lines to enhance precision in trend detection.
Dynamic Updates : Continuously update trend lines as new data becomes available, ensuring real-time accuracy.
Alerts and Notifications : Set alerts for new high and low pivots, as well as for when the price crosses upper or lower trend lines, keeping traders informed of significant market changes.
Plotting Trend Lines :
Trend Line Plotting : Automatically draw trend lines based on detected BOS, helping traders visualize the market trend.
Diagonal Support/Resistance Lines : Plot diagonal lines to indicate support and resistance levels, enhancing the understanding of market dynamics.
Pivot Label Customization : Customize pivot labels for clear identification of high and low points in the trend.
Alerts for Trend Lines : Set alerts for when price crosses trend lines, ensuring timely notifications of potential trading opportunities.
📘 Enhanced Linear Regression Integration
Purpose : Uses linear regression to analyze price movements and identify trends.
Usage : Display the linear regression projection line, customize its appearance, and use enhanced calculations for better trend analysis.
Display Projection Line :
Description : Toggle to display or hide the linear regression projection line on the chart.
Details : This line represents the best fit line that predicts future prices based on historical data.
Data Source :
Description : Select the data source for the linear regression projection.
Details : This is typically the closing price but can be any price point such as open, high, or low. The selected source will be used to calculate the linear regression projection line.
Trend-Based Line Color :
Enable Trend-Based Line Color : Toggle to automatically color the projection line based on the trend direction. When enabled, the line will be red for a downward trend and green for an upward trend, providing a visual indication of market direction.
Uptrend Line Color : Select the color for the projection line when the trend is upward. This color will be used when "Enable Trend-Based Line Color" is active.
Downtrend Line Color : Select the color for the projection line when the trend is downward. This color will be used when "Enable Trend-Based Line Color" is active.
Enhanced Calculations :
Standard Deviation Calculation : Calculate the standard deviation for a given length to understand the volatility around the linear regression line.
Pearson's Correlation Calculation : Compute Pearson's R to measure the strength of the linear relationship between the price points and the linear regression line.
Slope and Intercept Calculation : Calculate the slope and intercept for the regression line, providing the basis for the projection.
Kernel Application : Optionally apply the RBF Kernel to the selected source data for smoothing and enhancing the regression calculations.
Dynamic Length Selection : Automatically select the optimal regression period based on the highest Pearson's R value, ensuring the most accurate trend representation.
Real-Time Updates : Continuously update the regression line and related calculations as new data becomes available, maintaining accuracy in real-time.
Alerts and Notifications : Set alerts for when the price crosses the linear regression projection line, notifying traders of significant market events.
Plotting Linear Regression Components :
Projection Line Plotting : Automatically draw the linear regression projection line based on historical data and the selected data source.
Label Customization : Customize the label for the projection line, including color and text, for clear identification on the chart.
Alerts for Projection Line : Set alerts for when the price crosses the projection line, ensuring timely notifications of potential trading opportunities.
📘 POC Analysis Integration
Purpose : Identifies the Point of Control (POC) to highlight price levels with the highest trading volume.
Usage : Toggle the display of the POC, customize its appearance, and use enhanced calculations for better market analysis.
Display POC :
Description : Toggle to display or hide the Point of Control (POC) on the chart.
Details : The POC is the price level at which the highest volume of trading occurred, indicating a focal point of market activity.
Data Source :
Description : Select the price source for POC analysis.
Details : This is typically the closing price but can be any price point such as open, high, or low. The selected source will be used to calculate the POC.
POC Line Colors :
Color Above POC : Set the line color when the closing price is above the POC.
Color Below POC : Set the line color when the closing price is below the POC.
Width Multiplier :
Description : Adjust the width around the price for POC analysis.
Details : A higher value broadens the calculation range.
POC Calculation and Visualization :
Price Level Initialization : Calculate the initial spacing between price levels based on the first candlestick and user settings.
Volume Data Accumulation : Accumulate volume data at specified price levels for each candlestick to determine the POC.
Dynamic Array Expansion : Expand price levels array to accommodate new price data outside the current range.
POC Determination : Determine and visualize the POC at the last candlestick if enabled by the user.
Alerts and Notifications : Set alerts for when the price crosses the POC, notifying traders of significant market events.
Plotting POC Components :
POC Line Plotting : Automatically draw the POC line based on historical data and the selected data source.
Label Customization : Customize the label for the POC line, including color and text, for clear identification on the chart.
Alerts for POC : Set alerts for when the price crosses the POC, ensuring timely notifications of potential trading opportunities.
📘 Enhanced Divergences Integration
Purpose : Detects and displays divergences between price movements and indicators to identify potential reversal points.
Usage : Toggle the display of divergences, select data sources, customize divergence colors, and use enhanced calculations for better trend analysis.
Display Divergences :
Description : Toggle to display or hide the detected divergences on the chart.
Details : Divergences occur when the price movement of an asset and a related indicator (e.g., volume or momentum) move in opposite directions. They are used to identify potential reversal points in the market. Regular divergences signal possible reversals, while hidden divergences can indicate continuation.
Data Source :
Description : Defines the timeframe from which to fetch data for analysis.
Details : Typically lower than the chart current timeframe for multi-timeframe analysis.
Divergence Colors :
Bearish Divergence Color : Sets the color for bearish divergence lines. Bearish divergences typically suggest potential downward price movement.
Bullish Divergence Color : Sets the color for bullish divergence lines. Bullish divergences typically indicate potential upward price movement.
Pivot Bars :
Left Bars : Number of bars to the left of the pivot point to consider. Helps in identifying the pivot high or low by looking back these many bars.
Right Bars : Number of bars to the right of the pivot point to consider. Assists in confirming a pivot point by ensuring no higher high or lower low is present within this range.
Display Hidden Divergences :
Description : When enabled, this setting reveals hidden divergences on the chart.
Details : Hidden divergences are a subtler form of divergence that often signal continuation rather than reversal. A hidden bullish divergence occurs when price makes a higher low while the indicator makes a lower low, suggesting the continuation of an uptrend. Conversely, a hidden bearish divergence occurs when price makes a lower high while the indicator makes a higher high, indicating the continuation of a downtrend. These divergences are particularly useful for identifying the strength of the current trend.
Dynamic Line Width Based on Divergence Count :
Description : When enabled, adjusts the width of the divergence line dynamically based on the count of divergences detected.
Details : This provides visual emphasis on stronger signals.
Enhanced Calculations :
Standard Deviation Calculation : Calculate the standard deviation for a given length to understand the volatility around the linear regression line.
Pearson's Correlation Calculation : Compute Pearson's R to measure the strength of the linear relationship between the price points and the linear regression line.
Slope and Intercept Calculation : Calculate the slope and intercept for the regression line, providing the basis for the projection.
Kernel Application : Optionally apply the RBF Kernel to the selected source data for smoothing and enhancing the regression calculations.
Dynamic Length Selection : Automatically select the optimal regression period based on the highest Pearson's R value, ensuring the most accurate trend representation.
Real-Time Updates : Continuously update the regression line and related calculations as new data becomes available, maintaining accuracy in real-time.
Alerts and Notifications : Set alerts for when the price crosses the linear regression projection line, notifying traders of significant market events.
Plotting Divergence Components :
Divergence Line Plotting : Automatically draw divergence lines based on historical data and the selected data source.
Label Customization : Customize the label for the divergence lines, including color and text, for clear identification on the chart.
Alerts for Divergences : Set alerts for when a divergence is detected, ensuring timely notifications of potential trading opportunities.
📘 Enhanced Average True Range Integration
Purpose : Measures market volatility using the Average True Range (ATR) to assist in identifying potential buy and sell points.
Usage : Set the ATR period, minimum tick filter, upper and lower coefficients, and customize ATR colors for better market analysis.
Show Labels :
Description : Enable or disable the display of labels for the Average True Range (ATR) indicator.
Details : This option controls whether the ATR signals (buy and sell) are shown on the chart with respective labels.
ATR Period :
Description : Sets the period for calculating the Average True Range (ATR).
Details : The ATR measures market volatility by calculating the average range of price movement over a specified period. A shorter period makes the ATR more sensitive to recent price movements, while a longer period smooths out short-term volatility.
Minimum Tick Filter :
Description : Sets the minimum tick filter for buy and sell signals.
Details : This filter ensures that the price movement is significant enough to be considered a valid signal. For example, a value of 20 means that the price must move at least 20 ticks from the open to the close to generate a signal.
Upper Coefficient :
Description : Sets the upper coefficient for band calculation.
Details : This value adjusts the sensitivity of the upper band used to detect high points. A higher coefficient makes the band wider, capturing more significant price movements, while a lower coefficient makes the band narrower, making it more sensitive to smaller price changes.
Lower Coefficient :
Description : Sets the lower coefficient for band calculation.
Details : This value adjusts the sensitivity of the lower band used to detect low points. A higher coefficient makes the band wider, capturing more significant price movements, while a lower coefficient makes the band narrower, making it more sensitive to smaller price changes.
ATR Colors :
Bullish Color : Sets the color for the bullish signal, helping to visually distinguish bullish trends.
Bearish Color : Sets the color for the bearish signal, helping to visually distinguish bearish trends.
Enhanced Calculations :
Dynamic Coefficient Calculation : Calculates dynamic coefficients based on market volatility, adjusting the sensitivity of ATR bands accordingly.
Band Calculation : Computes high and low bands using dynamic coefficients to detect significant price movements.
High/Low Point Detection : Identifies potential high and low points based on ATR band calculations and price thresholds.
Real-Time Updates : Continuously updates ATR calculations and signals as new data becomes available, ensuring accuracy in real-time.
Plotting ATR Components :
Signal Plotting : Plots bullish and bearish ATR signals on the chart based on calculated conditions.
Label Customization : Customize the labels for ATR signals, including color and text, for clear identification on the chart.
Alerts for Signals : Set alerts for detected bullish and bearish signals, ensuring timely notifications of potential trading opportunities.
📘 Enhanced ATR Visualization Parameters
Purpose : Provides a visual representation of market volatility using the ATR Strength Meter.
Usage : Toggle the display of the ATR Strength Meter, set thresholds, and customize its appearance for better market analysis.
Display ATR Strength Meter :
Description : Toggle to display or hide the ATR Strength Meter, a visual representation of market volatility.
Details : The meter is based on the Average True Range (ATR) and helps identify volatility trends.
High ATR Threshold :
Description : Set the threshold for high volatility.
Details : ATR values above this threshold indicate increased market volatility.
Low ATR Threshold :
Description : Set the threshold for low volatility.
Details : ATR values below this threshold indicate decreased market volatility.
Progression Bar Position :
Description : Select the position of the ATR Strength Meter on the chart.
Details : Options are "Top" or "Bottom", affecting where the volatility meter is displayed relative to price action.
Progress Bar Length :
Description : Set the horizontal length of the ATR Strength progression bar.
Details : Adjust to increase or decrease the bar's width, accommodating different chart sizes and user preferences.
Enhanced Calculations :
ATR Strength Calculation : Calculate the ATR strength to measure market volatility.
Dynamic Coefficients : Use dynamic coefficients based on volatility for more accurate calculations.
Progress Bar Calculation : Determine the position and color of the progression bar based on ATR strength.
Label Positioning : Dynamically position labels for minimum and maximum values to avoid overlap.
Plotting ATR Strength Meter :
Progression Bar Plotting : Plot the progression bar to represent the ATR strength.
Label Customization : Customize labels for the ATR strength, minimum, and maximum values.
📘 Enhanced Relative Strength Index Integration
(A special thanks to RumpyPumpyDumpy for allowing the private reuse of his script.)
Purpose : Measures market momentum using the Relative Strength Index (RSI) and Stochastic RSI to assist in identifying potential buy and sell points.
Usage : Set the RSI and StochRSI parameters, toggle the display of the RSI Meter, and customize its appearance for better market analysis.
RSI Calculation Parameters :
RSI Length : Defines the length of the RSI calculation.
Details : A longer period captures more data points but may reduce sensitivity.
RSI Overbought Level : Sets the overbought level for RSI.
Details : Values above this level indicate overbought conditions.
RSI Oversold Level : Sets the oversold level for RSI.
Details : Values below this level indicate oversold conditions.
StochRSI Length : Defines the length of the StochRSI calculation.
Details : A longer period captures more data points but may reduce sensitivity.
StochRSI %K Length : Defines the length of the %K line of the StochRSI.
StochRSI %D Length : Defines the length of the %D line (SMA of %K) of the StochRSI.
RSI Visualization Parameters :
Display RSI Meter : Toggle the display of the RSI Meter on the chart.
RSI Meter Size : Adjust the size of the RSI Meter displayed on the chart.
Details : Measured as the diameter of the meter. Increase the value for larger display size, enhancing visibility and making it easier to read the RSI trend at a glance.
Horizontal Offset : Move the RSI Meter horizontally across the chart.
Details : Positive values shift the meter to the left, allowing for placement adjustments relative to the chart's current view or specific visual preferences.
RSI Meter Components :
Sectors and Ticks : Draw sector arcs and tick marks around the RSI Meter to represent different RSI levels and thresholds.
Needle : Draw the needle on the RSI Meter to indicate the current RSI value.
Sector Labels : Label each sector of the RSI Meter to indicate market conditions like "Strong Buy," "Buy," "Neutral," "Sell," and "Strong Sell."
Title Label : Draw the title label for the RSI Meter displaying the RSI value and its period.
Enhanced Calculations :
RSI Calculation : Calculate the RSI using the built-in function with the specified length and source.
StochRSI Calculation : Calculate StochRSI values using the specified lengths for RSI, %K, and %D.
Dynamic Line Management : Efficiently manage and update dynamically created line objects to prevent potential memory leaks.
Optimized Sector and Needle Drawing : Enhanced the drawing functions for sectors, needles, and ticks to improve visual clarity and performance.
Plotting RSI Meter :
Sector Plotting : Draw the sectors on the RSI Meter using specified colors and widths to represent different RSI levels and thresholds.
Needle Plotting : Plot the needle on the RSI Meter based on the calculated RSI value to visually indicate the current RSI level.
Tick Plotting : Plot tick marks around the RSI Meter to denote key RSI levels and thresholds for better readability.
Label Plotting : Draw sector labels and a title label on the RSI Meter to provide context and information about the RSI levels and their corresponding market conditions.
📘 Market Sentiment Integration
Purpose : Analyzes market sentiment using various indicators to provide an overall sentiment score.
Usage : Enable or disable individual sentiment indicators, set account type, and customize sentiment calculations for better market analysis.
Volatility Index (IV) :
Description : Enable or disable the use of the Volatility Index in sentiment calculation.
Details : When enabled, the Volatility Index (IV) provides insight into market sentiment by measuring market volatility. The selected Volatility Index varies based on your TradingView account type.
Account Type :
Description : Select your TradingView account type.
Details : Free accounts use SPX, while Premium accounts use VIX.
Put/Call Ratio (PCR) :
Description : Enable or disable the use of the Put/Call ratio in sentiment calculation.
Details : The Put/Call ratio is a sentiment indicator that measures the volume of put options traded relative to call options, indicating market sentiment towards bearish or bullish expectations.
Fear and Greed Index :
Description : Enable or disable the use of the Fear and Greed Index in sentiment calculation.
Details : The Fear and Greed Index gauges the prevailing emotions in the market, indicating whether investors are inclined towards fear (bearish sentiment) or greed (bullish sentiment).
Momentum Indicators :
Description : Enable or disable the use of momentum indicators like MACD and RoC in sentiment calculation.
Details : Momentum indicators help identify the strength and direction of price movements, assisting in sentiment analysis.
Adaptive Periods for Shorter Timeframes :
Description : Toggle this option to use shorter periods for sentiment indicators when analyzing lower timeframes.
Details : Enabling this option allows for more responsive and sensitive analysis when working with shorter timeframes.
Calculation Details :
Normalization Function : Normalize the values of the indicators over a 252-period range.
Set Periods Function : Set periods based on user preference for faster or slower periods, adjusting the analysis sensitivity.
IV Calculation : Calculate the IV value based on the selected Volatility Index (SPX for Free accounts, VIX for Premium accounts).
Put/Call Ratio Calculation : Calculate the Put/Call ratio using volume data, where put volume is proportional to the trading range, and call volume is proportional to the price change.
RoC Calculation : Calculate the Rate of Change (RoC) as a momentum indicator, measuring the percentage change in closing prices over a specified period.
Dynamic Thresholds : Define dynamic thresholds based on historical data, calculating mean and standard deviation to determine upper and lower thresholds for IV, PCR, and RoC.
📘 Enhanced Market Trend Dashboard Integration
Purpose : Provides a summary of key market indicators and signals in a single dashboard for quick and easy reference.
Usage : Customize the dashboard settings to display relevant market information, including Ichimoku components, Linear Regression, Support/Resistance levels, MACD, RSI, and Market Sentiment.
Market Trend Dashboard Parameters :
Display Market Trend Dashboard : Toggle to show or hide the market trend dashboard, providing a summary of key indicators and signals.
Panel Position : Select the position of the dashboard on the chart for optimal viewing.
Panel Text Size : Choose the text size for the information displayed in the dashboard, ensuring readability.
Panel Background Color : Set the background color of the market trend dashboard, enhancing contrast with the chart.
Ichimoku Dashboard Parameters :
Display Ichimoku Dashboard : Toggle to show or hide the Ichimoku section in the dashboard.
Display Tenkan-Sen Price Cross : Indicate when the price crosses the Tenkan-Sen line, signaling potential trade opportunities.
Display Kijun-Sen Price Cross : Indicate when the price crosses the Kijun-Sen line, often considered a stronger signal than Tenkan-Sen crosses.
Display Chikou Span Price Cross : Indicate Chikou Span price crosses, providing insight into potential trend reversals.
Display Kumo Breakout : Indicate Kumo (cloud) breakouts, which can signify major trend shifts.
Display Kumo Twist : Indicate Kumo twists, suggesting changing market dynamics and potential reversals.
Linear Regression Projection Dashboard Parameters :
Display LR Projection Dashboard : Toggle to show or hide the Linear Regression Projection section in the dashboard.
Display Linear Regression Period : Indicate the period used for Linear Regression Projection analysis.
Display Pearson R Details : Show the Pearson R value in the dashboard, indicating the strength and direction of the correlation in the Linear Regression Projection.
Supports and Resistances Dashboard Parameters :
Display S/R Dashboard : Toggle to show or hide the Support and Resistance section in the dashboard.
Display S/R Break Prices : Show the latest break prices of support and resistance levels in the dashboard.
MACD Dashboard Parameters :
Display MACD Dashboard : Toggle to show or hide the MACD section in the dashboard.
RSI Dashboard Parameters :
Display RSI Dashboard : Toggle to show or hide the Relative Strength Index section in the dashboard.
Display RSI Details : Show the RSI value and status in the dashboard.
Display StochRSI Details : Show the StochRSI %K, %D values and status in the dashboard.
Market Sentiment Dashboard Parameters :
Display Market Sentiment Dashboard : Enable or disable the display of the Market Sentiment Dashboard, which summarizes key market sentiment indicators like Implied Volatility, Put/Call Ratio, and Fear and Greed Index.
Display Implied Volatility Details : Show or hide the Implied Volatility details in the Market Sentiment Dashboard.
Display Put/Call Ratio Details : Show or hide the Put/Call Ratio details in the Market Sentiment Dashboard.
Display Fear and Greed Index Details : Show or hide the Fear and Greed Index details in the Market Sentiment Dashboard.
Enhanced Calculations :
Ichimoku Cloud Trend Calculation : Calculates trend based on the relationship between Ichimoku Cloud components, identifying bullish or bearish trends.
Support and Resistance Break Detection : Detects breaks in support and resistance levels and updates the dashboard accordingly.
Linear Regression Projection Calculation : Calculates Linear Regression Projection and Pearson R value for trend analysis.
MACD Signal Calculation : Determines MACD status based on histogram values.
RSI and StochRSI Calculation : Calculates RSI and StochRSI values and updates their statuses in the dashboard.
Market Sentiment Score Calculation : Calculates overall market sentiment score based on individual sentiment indicators.
Dynamic Alert Management : Manages alerts for various dashboard signals to prevent repeated alerts.
Real-Time Data Integration : Continuously updates the dashboard with real-time data for accurate and current trend analysis.
Plotting Market Trend Dashboard Components :
Ichimoku Components Plotting : Plots Tenkan-Sen, Kijun-Sen, Chikou Span, and Kumo cloud with dynamic adjustments.
Support and Resistance Levels Plotting : Plots support and resistance levels and updates them dynamically based on market data.
Linear Regression Projection Plotting : Plots the Linear Regression Projection line and labels with trend-based colors.
MACD and RSI Plotting : Plots MACD and RSI signals on the dashboard, including status updates.
Market Sentiment Indicators Plotting : Plots Market Sentiment indicators like IV, PCR, and Fear and Greed Index with dynamic updates.
Alert Notifications Plotting : Plots alert notifications for significant market changes based on dashboard signals.
Summary
This comprehensive market analyzer integrates multiple technical indicators, including machine learning, Ichimoku Kinkō Hyō, candlestick patterns, Fibonacci retracement, support and resistance levels, trend lines, linear regression, POC analysis, divergences, ATR, RSI, and market sentiment. Each section includes detailed descriptions and usage instructions to help traders understand how to effectively utilize the indicator in their trading strategies.

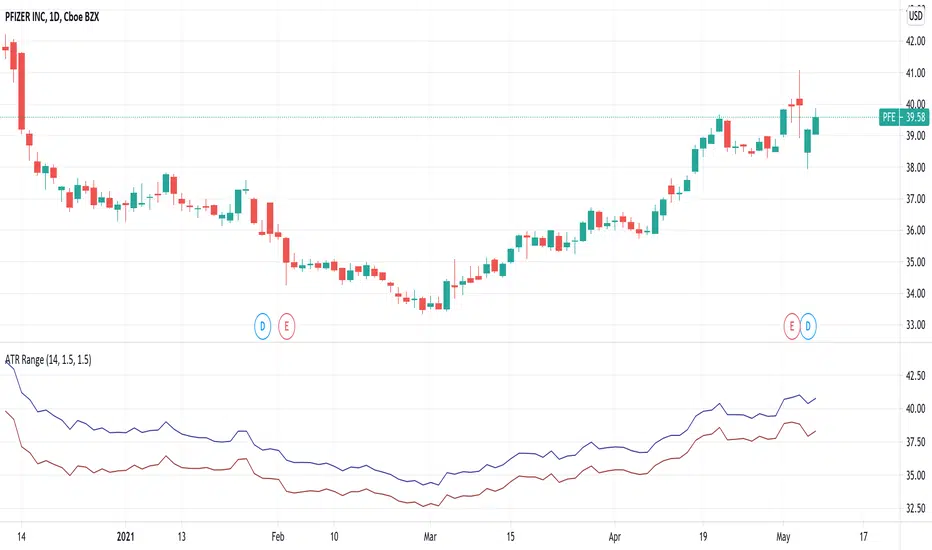
ATR RangeUseful in case you use Average True Range to determine Shows Stop Loss and Take Profit price levels.
For example, if you want to put Stop Loss with a distance of 1.5xATR and Take Profit 2xATR for a long trade, put 1.5 as Lower Factor and 2 as Upper Factor. Lower and Upper prices will show price levels for SL and TP respectively.
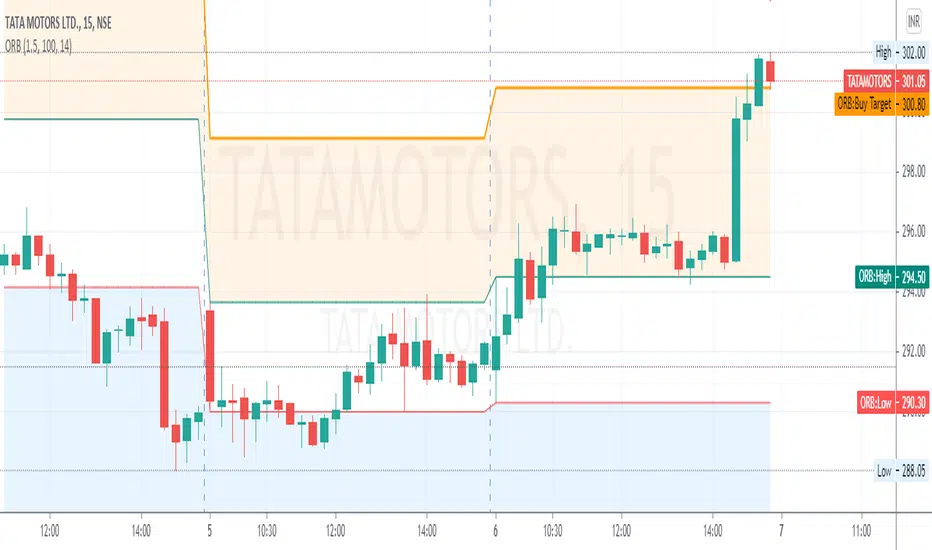
ORB Current Timeframe + ATRThis is Indicator
1. Opening Range Breakout for Selected Time frame
2. You can fix your Risk Reward and also Risk Amount
3. It will calculate the Position size based on Open Range ATR and your Risk Amount
4. Display's the Daily ATR for Given Input
5. It Gives Opening ATR Percentage to take a trade or not
6. It Calculates the Target on Either Side Based on the Risk Reward
[kai]mATRThis indicator is for calculating the volatility of any interval
mTR (green line): TR is extended to calculate multiple bars at once with magnification setting.
mATR (red line): ATR is extended to calculate multiple bars at once with magnification setting.
dev (blue line): standard deviation
If you turn on "divide source" in the settings, it will be the price volatility.
dev will be the same as BBW
このインジケーターは任意の区間のボラリティを計算するための物です
mTR(緑線) : TRを倍率設定で複数のバーをまとめて計算する用に拡張したものです
mATR(赤線) : ATRを倍率設定で複数のバーをまとめて計算する用に拡張したものです
dev(青線) : 標準偏差
設定で「divide source 価格変動率」をONにすると価格変動率になります
devはBBWと同じになります

(JS) Interchanging ATR & VWAP BandsOkay so this is pretty simple, but I think it's a great tool for day trading especially. I just took the default VWAP and Keltner channel scripts and combined them together.
The top option allows you to choose which one you'd prefer to use, "Use ATR instead of VWAP" .
The next options, "ATR Source", "KC Length", and "ATR Length" are the parameters for the ATR Bands.
"Number of Bands" allows you to choose how many bands you'd like to be on display (you can choose 1-8).
"Use Expoential MA" and "Band Style" are more default parameters from Keltner Channels used to set up the ATR Bands.
The "ATR Bands" are just stacked Keltner Channels separated by 1 ATR each, whereas the "VWAP Bands" are separated by standard deviation just like the default script from Trading View.
In these example chart, you can see the weekly VWAP with 8 deviation bands and 5 ATR bands with Keltner Channels.

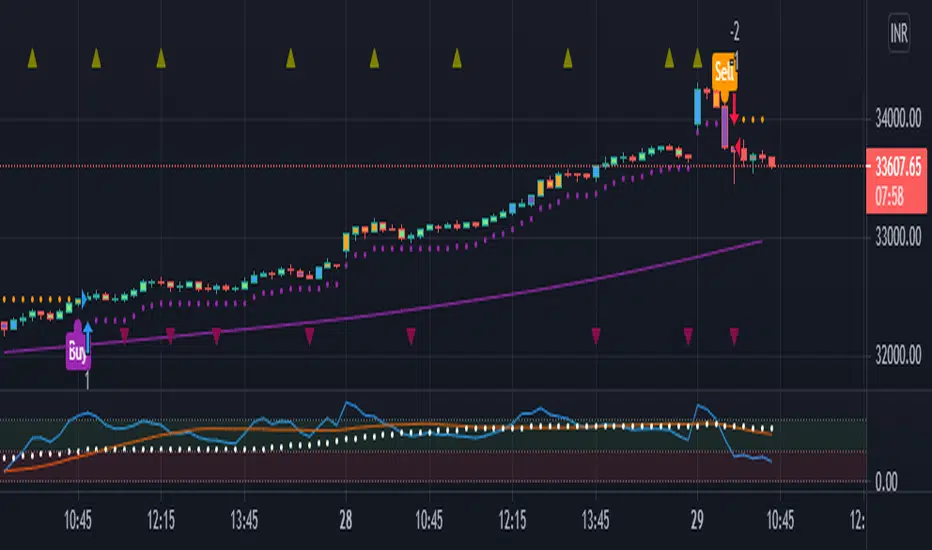
SMT V11 BY Stock_InshotsHello , i Combined 3 Indicators to generate buy /sell signal
1) Super Trend
2) Simple Moving Average
3) Williams Fractal Indicator.
I thank Trading View to keep all these indicators source code open so i was able to combine and customized as per requirement.
In settings one may change use different period of super trend as well Sma
This works best on 10 min chart.
Buy Setup : after buy signal one can wait for fractal confirmation below the candle and place order above High of that candle with buffer of 0.01% in LTP
or one can place order near to Sma 50 as after Signal as it will come to retest . Reversal Strategy for good Risk Reward Ratio
Sell Setup : After Sell Signal one can wait for fractal Confirmation below the candle and place the order below the low of the candle with buffer of 0.01% in LTP
Note : It may not give good results on Forex better do your on research with different Periods on different time frames
I am not SEBi Registered to advice on your investment. Consult your Financial Advisor before investing on any idea
Please give feedback for Modification/ Suggestions are most welcome.
Thank you trading view a great platform. i am publishing this in protected mode as some ,copy and start selling these type of indicator by invite-only links. i wish to help retailers.
Refer chart for understanding of buy/sell setup
3 SuperTrends + ATR SL + 3 EMAsHere I have assembled 3 indicators, SuperTrend + ATR + Ema, to make them fit into one indicator to make things more organized and to save space. Check Script for original Authors of the used scripts. The UI or the indicator is far from perfect as my programming skills are very low :D

HamStar Tweezer Engulfing DetectorStandard candle pattern identifier like many already available, however this one allows to filter with ATR or RVOL to help remove false signals.
Please comment any suggestions, questions or requests.
*Disclaimer*
some of the pattern logic was located throughout the internet and is not mine. I have simply cobbled it together and added the filters.

ATR 1Day Upper Lower BoundsThis script is useful as a guide to get into positions.
The 1day ATR has upper and lower bounds, however its typically used to determine if a trend is long or short. And the trend reverses when the price action close crosses the directional trend limit.
This script is different in that it always shows both the upper and lower ATR ranges.
Also, its default time resolution is the 1day and this has been selected for BTC, as the chart shows when this indicator can be useful.
The indicator overlays anytime frame equal to or lower than 1 day.
The 1 Day ATR upper and lower limits are a good guide.
If the price action crosses the 1 Day ATR, there is a reasonable chance the price is likely to correct to be within the 1Day ATR bounds.
So, if the price goes above the top ATR line, consider getting into a short position.
Similarly, if the price goes below the lower ATR line, consider getting into a long position.
If you look at the attached chart, there are several times when this is a very good trading signal for BTC.
