RS High Beta Exposure | QuantLapseRS High Beta Exposure | QuantLapse
Conceptual Foundation and Innovation
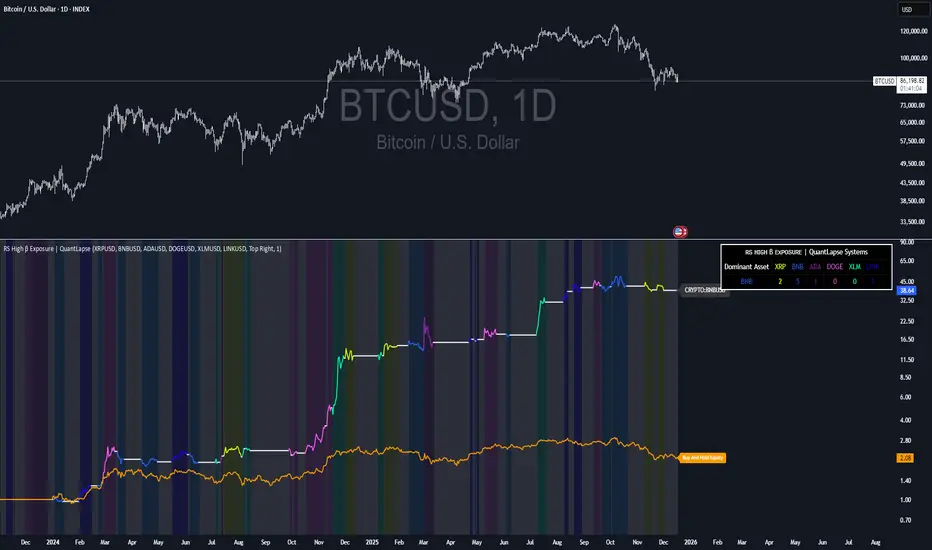
The RS High Beta Exposure indicator from QuantLapse is a comprehensive multi-asset allocation and momentum-ranking system that integrates beta and trend analysis, pairwise relative strength comparison, and volatility-adjusted filtering.
Its objective is to identify dominant crypto assets while dynamically reallocating High Beta exposure based on a calculated relative strength. The objective is to integrate trend analysis along with volatility filtering to these pairs to determine its relative strength.
At its core, RS High Beta Exposure indicator measures the systematic (β) performance of each asset relative to other assets provided combining these measures with inter-asset ratio trends to determine which assets exhibit superior strength and momentum relative to the other assets.
This integration of relative strength comparison, and trend and filtering analysis represents a quantitative evolution of traditional relative strength analysis, designed for adaptive asset rotation across major cryptocurrencies.
Technical Composition and Calculation
The indicator is structured around three major analytical layers:
1. Beta and Alpha Analysis
-Each asset’s return is decomposed into systematic components relative to the other assets by using a trend based, volatility filtering model.
-Assets with the highest point on a relative strength basis above the median are considered outperformers and eligible for allocation.
2. Pairwise Ratio Momentum
-Every asset is compared against all others through a ratio-trend, where momentum based trend scores quantify the directional momentum between each pair.
-In addition, we filter any false signals with volatility adjusted trends in which ensure high quality signals.
3. High Confidence Ranking
-Using the Pairwise Momentum signals, the RS High Beta Exposure scores them. If the asset comparison is given a signal, the RS High Beta Exposure scores points for each asset.
-If the total points of an asset is 5, its given the rank the dominant asset and is most likely to outperform.
By combining these layers, RS High Beta Exposure determines not only which assets is the strongest but also which assets to be invested.
User Inputs and Feature Adaptability
The indicator includes set of customizable parameters to support portfolio and risk management preferences:
Start Date Filter – Defines the beginning of live strategy evaluation.
Display Options – Able to change the location of the RS Table, Background and equity color.
Asset Selection – Modify or replace up to six crypto assets in the ranking matrix
asset1 = input.symbol("CRYPTO:XRPUSD", title ="Asset 1")
asset2 = input.symbol("CRYPTO:BNBUSD", title ="Asset 2")
asset3 = input.symbol("CRYPTO:ADAUSD", title ="Asset 3")
asset4 = input.symbol("CRYPTO:DOGEUSD", title ="Asset 4")
asset5 = input.symbol("CRYPTO:XLMUSD", title ="Asset 5")
asset6 = input.symbol("CRYPTO:LINKUSD", title ="Asset 6")
Each module operates cohesively to maintain analytical transparency while allowing user-level control over system sensitivity and behavior.
Real World, Practical Applications
The RS High Beta Exposure indicator is designed for systematic traders and quantitative portfolio managers who seek a disciplined framework for dynamic crypto asset rotation.
Key applications include:
High-Beta Asset Identification: Systematically identify crypto assets exhibiting relative dominance and stronger momentum characteristics versus peers within the comparison set.
Rule-Based Portfolio Rotation: Reallocate exposure toward leading assets using objective pairwise signals, reducing emotional decision-making and FOMO-driven trades.
Trend-Aligned Risk Participation: Employ the pairwise relative strength model to maintain exposure only during favorable momentum conditions, helping avoid prolonged participation in weak or deteriorating trends.
By combining relative strength comparisons with trend-aware filtering, this framework bridges quantitative finance and market regime analysis, providing a structured, data-driven approach to crypto asset allocation.
Advantages and Strategic Value
RS High Beta Exposure goes beyond conventional relative strength tools by integrating multi-asset comparison, ratio-based dominance scoring, and volatility-aware regime filtering into a single coherent framework.
By employing a three-layer confluence model — combining trend integrity, relative performance attribution, and volatility-state confirmation — the system improves the reliability of rotation and trend-following decisions.
The model is particularly valuable for traders seeking to:
Mitigate drawdowns while participating in higher-beta assets through regime-aware exposure control.
Identify persistent outperformers early in emerging market trends.
Maintain capital exposure only when statistical and momentum conditions signal elevated confidence.
The inclusion of visual allocation tables and a dynamic alert system makes RS High Beta Exposure both transparent and actionable, supporting discretionary analysis as well as systematic or automated trading workflows.
Alerts and Visualization
The script delivers clear, intuitive visual cues and alert-based feedback to support real-time decision-making:
Color-coded background states visually indicate the current allocation regime.
Allocation labels and summary tables display the dominant asset and its relative strength in real time.
An integrated alert system automatically notifies users whenever allocation states change (e.g., “100% XRP” or “100% CASH”).
Together, these visualization and alert features make RS High Beta Exposure both analytically rigorous and easy to interpret, even in fast-moving live market conditions.
Summary and Usage Tips
RS High Beta Exposure is an advanced interpretation of relative strength analysis, blending pairwise momentum comparisons, multi-asset dominance scoring, and adaptive volatility filters into a disciplined framework for crypto asset rotation.
By combining cross-asset selection with systematic allocation logic, the indicator helps traders determine when to be exposed, which asset demonstrates leadership, and when to step aside during unfavorable conditions. The model is best applied on the 1D timeframe, where its structure is optimized for identifying sustained leadership rather than short-term price noise. For broader context and confirmation, it can be used alongside other QuantLapse systematic models at the portfolio level.
Note: Past performance does not guarantee future results. This indicator is intended for research and educational use within TradingView.
Altcoins
CRUX-3 Macro Regime Index"CRUX-3 Macro Regime Index"
Description:
CRUX-3 Macro Regime Index is a higher-timeframe macro indicator designed to evaluate how crypto markets are performing relative to traditional equities. It compares Bitcoin, Ethereum, and the broader altcoin market (TOTAL3) against the S&P 500 using Z-score normalization to highlight periods of relative outperformance or underperformance.
The indicator incorporates liquidity-based regime detection using Bitcoin dominance and stablecoin dominance to classify market environments as Risk-On, BTC-Led, or Risk-Off. Background shading visually highlights these regimes, helping users identify broader macro conditions rather than short-term trade signals.
CRUX-3 is intended for macro context, regime awareness, and allocation bias decisions, not for precise trade entries or timing.
How to Use:
Weekly timeframe recommended for best results
Rising Z-scores indicate crypto outperforming equities
ETH/SPX typically acts as an early rotation signal
TOTAL3/SPX confirms broader altcoin participation
Regime shading reflects liquidity conditions, not price forecasts
Regime Definitions:
Risk-On: BTC dominance and stablecoin dominance declining
BTC-Led: BTC dominance strong while stablecoin dominance eases
Risk-Off: BTC dominance and stablecoin dominance rising
Notes:
Forward regime bands are statistical reference guides based on historical behavior
This indicator does not predict future prices or market direction
Best used alongside price charts and other macro tools
Disclaimer:
This indicator is for educational and informational purposes only. It does not constitute financial advice, investment advice, or trading recommendations.
Recommended Settings:
Timeframe: Weekly (1W)
Z-Score Lookback: 52
Forward Regime Bands: Enabled

Mutanabby_AI | ONEUSDT_MR1
ONEUSDT Mean-Reversion Strategy | 74.68% Win Rate | 417% Net Profit
This is a long-only mean-reversion strategy designed specifically for ONEUSDT on the 1-hour timeframe. The core logic identifies oversold conditions following sharp declines and enters positions when selling pressure exhausts, capturing the subsequent recovery bounce.
Backtested Period: June 2019 – December 2025 (~6 years)
Performance Summary
| Metric | Value |
|--------|-------|
| Net Profit | +417.68% |
| Win Rate | 74.68% |
| Profit Factor | 4.019 |
| Total Trades | 237 |
| Sharpe Ratio | 0.364 |
| Sortino Ratio | 1.917 |
| Max Drawdown | 51.08% |
| Avg Win | +3.14% |
| Avg Loss | -2.30% |
| Buy & Hold Return | -80.44% |
Strategy Logic :
Entry Conditions (Long Only):
The strategy seeks confluence of three conditions that identify exhausted selling:
1. Prior Move Filter:*The price change from 5 bars ago to 3 bars ago must be ≥ -7% (ensures we're not entering during freefall)
2. Current Move Filter: The price change over the last 2 bars must be ≤ 0% (confirms momentum is stalling or reversing)
3. Three-Bar Decline: The price change from 5 bars ago to 3 bars ago must be ≤ -5% (confirms a significant recent drop occurred)
When all three conditions align, the strategy identifies a potential reversal point where sellers are exhausted.
Exit Conditions:
- Primary Exit: Close above the previous bar's high while the open of the previous bar is at or below the close from 9 bars ago (profit-taking on strength)
- Trailing Stop: 11x ATR trailing stop that locks in profits as price rises
Risk Management
- Position Sizing:Fixed position based on account equity divided by entry price
- Trailing Stop:11× ATR (14-period) provides wide enough room for crypto volatility while protecting gains
- Pyramiding:Up to 4 orders allowed (can scale into winning positions)
- **Commission:** 0.1% per trade (realistic exchange fees included)
Important Disclaimers
⚠️ This is NOT financial advice.
- Past performance does not guarantee future results
- Backtest results may contain look-ahead bias or curve-fitting
- Real trading involves slippage, liquidity issues, and execution delays
- This strategy is optimized for ONEUSDT specifically — results may differ on other pairs
- Always test before risking real capital
Recommended Usage
- Timeframe:*1H (as designed)
- Pair: ONEUSDT (Binance)
- Account Size: Ensure sufficient capital to survive max drawdown
Source Code
Feedback Welcome
I'm sharing this strategy freely for educational purposes. Please:
- Drop a comment with your backtesting results any you analysis
- Share any modifications that improve performance
- Let me know if you spot any issues in the logic
Happy trading
As a quant trader, do you think this strategy will survive in live trading?
Yes or No? And why?
I want to hear from you guys

Structure Break ModelMAIN FEATURES
Supported Assets & Timeframe
This indicator is specifically designed and calibrated for 30 USDT trading pairs on the H4 timeframe, all of which have been actively traded for over 1,000 days, including:
BTCUSDT, ETHUSDT, XRPUSDT, BNBUSDT, SOLUSDT, TRXUSDT, DOGEUSDT, ADAUSDT, XLMUSDT, BCHUSDT,
ZECUSDT, LINKUSDT, HBARUSDT, UNIUSDT, LTCUSDT, AVAXUSDT, SHIBUSDT, DOTUSDT, AAVEUSDT, NEARUSDT,
ETCUSDT, ICPUSDT, FILUSDT, APTUSDT, ENSUSDT, ATOMUSDT, VETUSDT, QNTUSDT, CRVUSDT, INJUSDT
Using the script on other pairs or timeframes will trigger an automatic warning to prevent incorrect usage.
1. Structural Weakening Model (Core Logic)
At the heart of the system lies the Structural Weakening Model (SWM) — a multi-layered market-structure engine that identifies momentum exhaustion and confirms genuine reversals using pivot-based swing architecture.
Pivot Structure Mapping
The indicator continuously analyzes Pivot Highs and Pivot Lows (length = 5) to establish clean, stable swing structure.
Weakening Pattern Detection
The model evaluates directional fatigue by detecting pivot sequences:
2–6 Higher Lows → Weakening buyers → Potential SELL setup
2–6 Lower Highs → Weakening sellers → Potential BUY setup
This mechanism identifies “compression zones” where market pressure fades before a structural shift.
Breakout Confirmation Layer
A signal is only triggered when price breaks the final structural anchor of the pivot chain.
This ensures:
Optional Trend Filter (MA Alignment)
Users may select EMA, SMA, WMA, HMA and more.
Price above MA → BUY-only mode
Price below MA → SELL-only mode
This keeps signals aligned with broader market flow.
Visual Example – SELL Signal (TP Hit)
2. Signal Conditions (How the System Works)
SELL Setups
Triggered when:
Price forms 2–6 higher lows, signaling weakening buyers
Price breaks below the structural pivot anchor
(Optional) Price is below the MA filter
BUY Setups
Triggered when:
Price forms 2–6 lower highs, signaling weakening sellers
Price breaks above the structural pivot anchor
(Optional) Price is above the MA filter
Visual Example – SELL Signal (SL Hit)
3. Automatic Capital Management
The script integrates full risk-management utilities:
Starting capital (default 10,000 USDT)
Risk % per trade
Leverage (x10 → x100)
Automatic position sizing
Margin requirements
Real-time TP/SL calculations
This turns the indicator into not just a signal tool, but a complete trading assistant.
4. Flexible Stop-Loss System
Users may choose:
Swing-based SL (nearest structural pivot)
Fixed SL %
Custom TP based on R:R (1:1.5 → 1:5)
Default R:R = 1:2
SL/TP levels update instantly whenever settings change.
Input Settings Menu
5. Visual Interface
The chart displays:
Entry, TP, SL (extended 20 candles)
BUY/SELL labels
Real-time TP/SL hit status
Full info panel:
Latest signal
Entry price
TP/SL
Leverage
Risk %
Required margin
Win/loss & R statistics
Days on chart: The total number of trading days calculated from your chart’s visible data
All signals follow the exact same logic in historical and real-time charts.
Zero repainting.
6. Internal Backtest Engine (Not Official TradingView Backtesting)
The script includes an internal backtest calculator that evaluates:
SL methods
TP R:R settings
Signal quality
Aggregate R performance
⚠ This is an internal calculation tool, not the official TradingView Strategy Tester.
Its purpose is to help users understand how different settings behave when applied to past data.
7. 1-Day Free Trial
Users may message the author on TradingView to request:
1-day trial access
Ability to test signals in real-time
Compare different SL/RR settings
Verify that the indicator does not repaint
Inspect how the engine behaves on the supported 30-coin dataset
This allows users to evaluate the tool transparently before subscribing.
8. Market Coverage & Deep Backtest Basis This indicator is calibrated on the 30 largest USDT pairs, providing a deep historical dataset with stable liquidity and clearer structural swings. The long backtest range and high signal density help reduce noise and ensure more consistent behavior across different market conditions.
⚠ Disclaimer
This indicator is a quantitative analysis tool created for educational purposes only.
All “optimal settings” are derived from historical market behavior and do not guarantee future performance.
Market conditions change, and every trader must apply independent risk management.
Trading involves risk.
Use responsibly.

V-CORE Engine Free v2V-CORE Engine Free v2 — Public Release
This is another release from the V-CORE suite, providing simplified market regime visualization based on proprietary trend-state processing.
No settings, no noise — just clean directional bias adapted for crypto markets on 1H+ timeframes.
This free version is intentionally minimal. It uses a reduced feature-set derived from our internal V-CORE Engine architecture.
For more details about V-CORE tools, future releases, or the full professional engine, please check our profile page.

Axel AltsOverview
Axel Alts is a higher-timeframe-aware overlay that forms a two-line support band for altcoins using a sticky, threshold-and-step progression. It draws an Upper Support (mid) and a Lower Support (low) derived from evolving local lows, with smoothed transitions and an optional halving-cycle bear-window background.
The goal is disciplined context: identify controlled pullbacks into support in constructive regimes and avoid emotional chasing. All core settings are fixed for consistent behavior across symbols.
Core logic (concepts, not implementation)
• Two baseline levels are computed as fractional distances from the current base and then smoothed.
• A sticky mechanism advances each line toward its target only when deviation is material, and in capped steps. This reduces whipsaw and preserves structure.
• Visual easing smooths transitions so curves remain stable and readable.
• Rendering accounts for higher-timeframe structure and uses interpolation on lower timeframes for visual continuity; values do not look ahead and finalize on higher-timeframe closes.
• An optional bear-window background is derived from halving dates to flag a more cautious phase between the late part of one cycle and the run-up to the next.
Inputs
• Parameters are locked (lengths, fractions, sticky thresholds/steps, easing radii, bear-window bounds). No user-tweakable inputs—this prevents overfitting and improves repeatability.
How to read it
• The zone between Upper Support and Lower Support is the preferred “controlled pullback” area in constructive regimes.
• Persistent closes above Upper Support indicate strength; orderly reactions into the band can be constructive.
• Sustained closes below Lower Support warn of deterioration; be cautious with aggressive longs until recovery.
• The bear-window background suggests a more conservative stance on risk and size.
• Confirmations are best taken on daily/weekly closes; short-term pokes through the band are often noise.
Practical use cases
• Altcoin rotation: prioritize names holding the band; de-prioritize those persisting below it.
• Dollar-Cost Averaging (DCA) context: scale within the band during favorable regimes.
• Risk framing: tighten or reduce exposure on breaks below Lower Support or during the bear window.
• Confluence: combine with volume/volatility tools and market-wide risk gauges.
Best practices
• Rely on daily/weekly closes for confirmation.
• Pair with market structure (HH/HL vs. LH/LL) and higher-timeframe support/resistance.
• Consider broader cycle context (e.g., halving windows) before scaling risk.
Technical notes
• Non-repainting: values finalize on the close of the higher timeframe used by each calculation.
• Interpolation on lower timeframes is for continuity only; it is not forward-looking.
• Bear-window boundaries are fixed and derived from publicly known Bitcoin halving dates.
• The fill between lines is fixed in the current configuration.
Who it is for
• Traders who want a fixed-rules, repeatable context for alt pullbacks and trend health.
• Systematic users who prefer deterministic, non-tunable overlays for portfolio discipline.
Limitations & disclosures
• Closed-source; for educational and analytical use only.
• Not financial advice. Markets involve risk; past performance does not guarantee future results.
Release notes
• Includes sticky progression for both support lines with eased transitions.
• Improved visual continuity on lower timeframes while respecting higher-timeframe structure.
• Added halving-based bear-window highlighting (bounds are fixed).
Originality & why closed-source
This is not a reimplementation of public open-source scripts. Axel Alts integrates (1) sticky threshold-and-step progression, (2) dual support lines built from fractional levels off evolving lows with separate smoothing, (3) visual easing for stability, and (4) a halving-based bear window. The interaction of thresholds/steps, smoothing, and the regime window is proprietary and tuned to retain structure while limiting lag. The source is closed to protect this implementation.
Integration, not a mashup
Axel Alts is a single, self-contained framework. It does not merely merge indicators; its components are designed to work together to form a unified support band with a clear reading protocol (hold within the band, caution below, close-based confirmations, optional bear-window context).
Indicator, not a strategy
This publication is an indicator overlay, not a trading strategy. It includes no backtests, position logic, performance claims, or risk assumptions. Use it as analytical context within your own risk management.
Comparison to common tools
Compared to standard moving-average channels or volatility bands, Axel Alts emphasizes (1) structure retention via sticky thresholds/steps, (2) smoother visuals through eased transitions, and (3) explicit cycle context via the halving-based bear window.

Crypto Breadth Engine [alex975]
A normalized crypto market breadth indicator with a customizable 40 coin input panel — revealing whether rallies are broad and healthy across major coins and altcoins or led by only a few.
📊 Overview
The Crypto Breadth Engine measures the real participation strength of the crypto market by analyzing the direction of the 40 largest cryptocurrencies by market capitalization.
⚙️ How It Works
Unlike standard breadth tools that only count assets above a moving average, this indicator measures actual price direction:
+1 if a coin closes higher, –1 if lower, 0 if unchanged.
The total forms a Breadth Line, statistically normalized using standard deviation to maintain consistent readings across timeframes and volatility conditions.
🧩 Dynamic Input Mask
All 40 cryptocurrencies are fully editable via the input panel, allowing users to easily replace or customize the basket (Top 40, Layer-1s, DeFi, Meme Coins, AI Tokens, etc.) without touching the code.
This flexibility keeps the indicator aligned with the evolving crypto market.
🧭 Trend Bias
The indicator classifies market structure as Bullish, Neutral, or Bearish, based on how the Breadth Line aligns with its moving averages (10, 20, 50).
💡 Dashboard
A compact on-chart table displays in real time:
• Positive and negative coins
• Participation percentage
• Current trend bias
🔍 Interpretation
• Rising breadth → broad, healthy market expansion
• Falling breadth → narrowing participation and structural weakness
Ideal for TOTAL, TOTAL3, or custom crypto baskets on 1D,1W.
Developed by alex975 – Version 1.0 (2025).
-------------------------------------------------------------------------------------
🇮🇹 Versione Italiana
📊 Panoramica
Il Crypto Breadth Engine misura la partecipazione reale del mercato crypto, analizzando la direzione delle 40 principali criptovalute per capitalizzazione.
Non si limita a contare quante coin sono sopra una media mobile, ma calcola la variazione effettiva del prezzo:
+1 se sale, –1 se scende, 0 se invariato.
La somma genera una Breadth Line normalizzata statisticamente, garantendo letture coerenti su diversi timeframe e fasi di volatilità.
🧩 Mascherina dinamica
L’indicatore include una mascherina d’input interattiva che consente di modificare o sostituire liberamente i 40 ticker analizzati (Top 40, Layer-1, DeFi, Meme Coin, ecc.) senza intervenire nel codice.
Questo lo rende sempre aggiornato e adattabile all’evoluzione del mercato crypto.
⚙️ Funzionamento e Trend Bias
Classifica automaticamente il mercato come Bullish, Neutral o Bearish in base alla relazione tra la breadth e le medie mobili (10, 20, 50 periodi).
💡 Dashboard
Una tabella compatta mostra in tempo reale:
• Numero di coin positive e negative
• Percentuale di partecipazione
• Stato attuale del trend
🔍 Interpretazione
• Breadth in crescita → mercato ampio e trend sano
• Breadth in calo → partecipazione ridotta e concentrazione su pochi asset
Ideale per analizzare TOTAL, TOTAL3 o panieri personalizzati di crypto.
Funziona su timeframe 1D, 4H, 1W.
Sviluppato da alex975 – Versione 1.0 (2025).

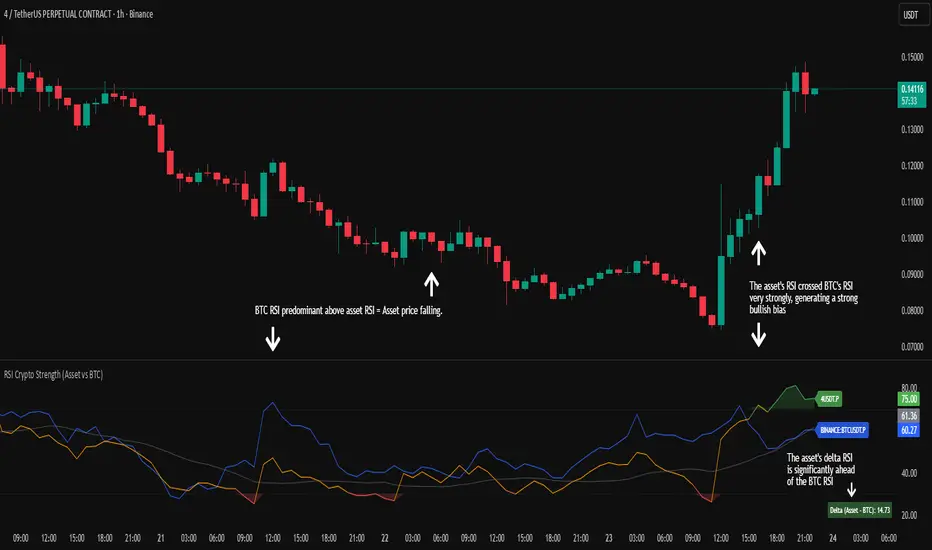
RSI Crypto Strength (Asset vs BTC)The "RSI Crypto Strength" is an advanced analysis tool built on a fundamental pillar of the cryptocurrency market: for an altcoin to achieve exponential bullish performance, it must invariably be and remain stronger than Bitcoin itself.
The primary objective of this indicator is to quantify and reinforce this thesis. It provides a clear and immediate view of the relative strength of any cryptocurrency in direct comparison with the market leader, Bitcoin. This relative strength can be identified on any timeframe. This also reinforces a scenario where a cryptocurrency that is weaker than Bitcoin is prone to sideways movements and downturns.
Key Features
This indicator combines multiple tools into a single solution:
> Dual RSI Plot: Simultaneously visualizes the RSI of the asset on the chart (dynamic) and the RSI of Bitcoin (blue line).
> Strength Delta (Asset vs. BTC): The heart of the indicator. A panel displays the exact difference (Asset RSI - Bitcoin RSI).
- Green: The asset has more RSI strength than Bitcoin.
- Red: The asset has less RSI strength than Bitcoin.
> Dynamic Coloring and Area Fill: The asset's RSI line and the background area automatically change color to highlight critical zones:
- Green (Overbought): RSI above 70.
- Red (Oversold): RSI below 30.
- Orange (Neutral): RSI between 30 and 70.
> Integrated Moving Average: A Moving Average line (gray) is plotted directly on the asset's RSI, serving as a signal line or to smooth momentum. The type (SMA, EMA, WMA, etc.) and period are fully customizable.
> Multi-Timeframe (MTF) Support: You can configure the indicator to display data from a higher timeframe (e.g., "1H") while analyzing a lower timeframe chart (e.g., "5m").
> Customizable Panel and Labels:
- A Delta Panel that can be enabled/disabled and moved to any of the four corners of the indicator.
- Labels at the end of the lines (Asset, BTC, MA) for easy identification, which can also be enabled/disabled.
> Alert-Ready: The indicator exposes the 4 main data sources for creating alerts.
How to Use
> Thesis Validation (Higher Timeframes): This is the primary use. Before looking for entries, use the indicator on timeframes like the H4, Daily, or Weekly. Confirm that the Asset (orange/green line) is consistently above Bitcoin (blue line) and that the Delta is positive. This is your structural strength validation, confirming the asset has potential for an exponential rally.
> Delta Analysis: The "Delta (Asset - BTC)" panel is your immediate strength metric. A positive and rising value indicates the asset is outperforming Bitcoin. A negative and falling value indicates relative weakness.
> Line Crossovers (Timing): On lower timeframes, watch for crossovers between the Asset line and the Bitcoin line. A cross of the Asset line above the Bitcoin line is a clear sign that the asset's momentum is gaining strength.
> Signal Confluence: Look for high-probability scenarios. For example: The Asset's RSI crosses above the Bitcoin RSI while the Delta also crosses above 0.
> Market Extremes: Use the area fill to quickly identify when the asset reaches extreme overbought (>70) or oversold (<30) levels, regardless of what Bitcoin is doing.
Alerts
This indicator is fully prepared for alert creation. When setting up an alert in TradingView, you can select the following data sources from this indicator:
> RSI Asset: Alerts on the RSI value of the asset on the chart.
> RSI Bitcoin: Alerts on the RSI value of Bitcoin.
> Moving Average: Alerts on the value of the Moving Average.
> RSI Delta: Allows creating alerts based on the difference between the two. (e.g., "Alert if RSI Delta crosses above Value 0").
Settings (Inputs)
The indicator offers full customization:
> RSI Length: The calculation period for both RSIs (default 14).
> Indicator Timeframe: Enables Multi-Timeframe functionality.
> Bitcoin Ticker: Allows changing the Bitcoin reference ticker.
> MA Settings: Choose the MA Type (SMA, EMA, WMA, VWMA, etc.) and its period.
> Panels and Labels: Toggles to enable/disable the Delta Panel and Line Labels, plus a selector for the panel's location.
> Colors: All line and highlight colors are fully customizable in the settings.
DISCLAIMER: This script is an analysis tool and does not provide financial advice. All trades carry risk. Use this tool as part of a broader trading strategy and always practice good risk management.
SZN - Altcoin OscillatorSZN Altcoin Oscillator – Identify Market Phases with Precision
What is the SZN Altcoin Oscillator?
The SZN Altcoin Oscillator is a multi-layered analysis indicator specifically developed for the altcoin market.
It combines different signal groups (trend, relative strength, volume, market environment, and overheating filters) into a unified oscillator in the 0–100 range.
--> The goal is to make major market movements visible while separating short-term fluctuations from broader trends.
Why not just use RSI or MACD?
Classic single indicators like RSI or MACD often react too sensitively to short-term fluctuations.
This leads to many false signals – especially during volatile altcoin phases.
--> The SZN Altcoin Oscillator solves this problem by combining and filtering multiple signal sources.
--> This smooths out overreactions and identifies true trend movements more reliably.
-----
How does it work?
The oscillator consists of five signal groups:
Price & Trend Momentum
checks the relative position of fast and slow moving averages
detects whether an altcoin is in a confirmed uptrend or downtrend
Relative Strength vs. Bitcoin & Ethereum
measures performance compared to the two market leaders
shows whether capital is rotating into altcoins or staying in majors
Volume and Breakout Filter
detects whether breakouts are confirmed by increased volume
prevents short “fakeouts” from appearing as buy signals
Market Environment (Regime Filter)
includes overall market data such as BTC dominance or TOTAL3
ensures that buy signals only trigger in suitable market phases
Overheating & Oversold Filter
marks statistically extreme zones
upward cross from oversold → buy signal
downward cross from overheated → sell signal
--> All results are displayed in a 0–100 oscillator.
Buy signal: upward cross from oversold zones
Sell signal: downward cross from overheated zones
-----
Variants (selection in the settings menu)
The indicator offers 5 preconfigured variants, optimized for different altcoin groups:
Default
The neutral standard configuration – balanced between sensitivity and stability. Suitable for a wide range of altcoins with medium to large market capitalization.
Large Caps
More conservative parameters with stronger smoothing. Designed for established projects (Top 20), where trends develop more slowly but with higher reliability.
Mid Caps
A balanced approach for mid-sized market caps. More sensitive than the Large-Cap variant, but filters more noise than the Small-Cap settings.
Small Caps
Higher sensitivity, optimized for more volatile coins (Top 100–200). Detects dynamic moves faster, but with higher risk of false signals.
Meme Coins
Adapted for highly speculative tokens. Accounts for extreme volatility and shorter cycles to better highlight overheating phases.
--> This allows each user to select the variant best suited to the asset category being analyzed.
-----
Recommended Usage
Timeframe: Daily chart (highest precision). For very new projects, the 8h chart can be used.
Asset selection: Coins with sufficient history (at least 200 trading days).
-----
Interpretation:
Oscillator rising from oversold → potential bottom / upward trend reversal
Oscillator falling from overheated → potential top / profit-taking zone
Movements in between indicate interim rallies or correction phases
The indicator is not a day-trading tool, but optimized for cyclical moves and swing trading.
-----
Notes:
The SZN Altcoin Oscillator is an additional analysis tool and does not replace independent trading decisions.
All signals are probabilistic; there is no guarantee of profits.
Effectiveness depends on the specific altcoin and the current market phase.
The indicator provides insights into broader market phases, not short-term price moves.

Altcoins Exit Planner [SwissAlgo]Altcoins Exit Planner
Navigating Altcoin Exits: A Strategic Approach: Planning your exits before emotions take over
------------------------------------------------------------------
✅ THE PSYCHOLOGY OF ALTCOIN TRADING
Many traders face recurring challenges when managing altcoin positions:
The Greed Trap : Holding through euphoric rallies, hoping for unrealistic targets, only to watch gains evaporate during market reversals.
The Paralysis Problem : Sitting on large unrealized profits but unsure which assets to exit, when, or how much — leading to inaction.
The FOMO Cycle : Rotating into trending coins too early or too late, often abandoning solid positions prematurely.
Analysis Overload : Consuming endless opinions and indicators without ever forming a clear, actionable exit strategy.
These patterns often stem from a lack of structure and planning . Emotional decision-making in volatile markets can be costly — especially with altcoins.
Developing a systematic framework can help define exit levels in advance , aiming to reduce emotional bias and improve decision clarity. The goal is to build disciplined exit strategies based on predefined logic rather than reactive impulses.
------------------------------------------------------------------
✅ FEATURES & FUNCTIONALITY
This indicator is designed to provide traders with a structured framework for exit planning. It aims to reduce decision-making under pressure by offering a visual roadmap on the chart.
The tool provides an analysis of key data points, including:
Structured Analysis : The indicator evaluates asset strength, identifies potential market phases, and derives potential exit levels from historical price behavior. This analysis may help traders assess whether an asset shows characteristics of strength (e.g., potential for extended targets) or weakness (e.g., early exit signals).
Actionable Information : It generates specific price levels and quantities for consideration as part of a predefined exit strategy.
Proactive Alerts : The system includes configurable alerts that can notify users as prices approach these key levels, allowing time for preparation. This feature is intended to support a shift from reactive trading toward systematic, criteria-based exit planning.
------------------------------------------------------------------
✅ HOW IT WORKS - AUTOMATED ANALYSIS & PLANNING
This indicator is designed to automate key aspects of exit planning that would otherwise require manual effort:
Fibonacci Level Calculation & Plotting : Automatically identifies key historical cycle points (e.g., bear market lows, bull market highs, recent pullbacks) and calculates relevant Fibonacci levels (both "Fib Retracments" from previous cycle ATH to bear market bottom, and "Fib. extensions" - considering major price impulses/waves in current bull market). This may help reduce manual drawing errors and streamline target identification.
Automated Calculation and Plotting of "Fib. Retracement "Levels
(from ATH of previous cycle to bottom in bear market)
Fibonacci retracement levels are a popular tool used in technical analysis to identify potential support and resistance levels in a market. After a significant price move, traders look for the price to "retrace" or pull back to one of several key Fibonacci ratios of the original move before continuing in its original direction. The most common retracement levels are 23.6%, 38.2%, 50%, 61.8%, and 78.6%. These levels are static horizontal lines on a chart, and their predictive power is based on the idea that they are "areas of interest" where a trend might pause or reverse.
Automated Calculation and Plotting of "Fib. Extension" Levels
(Price Impulses/Waves within current Bull Market)
Fibonacci extension levels are used to identify potential price targets or profit zones once a market has moved past its previous high or low. Unlike retracements, which measure a pullback, extensions project how far a trend might continue in the direction of its impulse move. They are typically used to anticipate where a wave or a rally might end and are based on ratios like 127.2%, 161.8%, 261.8%, and sometimes even higher. Extensions are a key tool for traders looking to set price targets for taking profits.
Coin Strength Assessment: Evaluates recovery performance relative to previous cycle peaks and classifies assets into four categories (Weak, Average, Strong, Outlier). Strength ratings may adjust dynamically based on momentum conditions — all derived from price data.
Market Phase Detection : Continuously monitors trend indicators, volume behavior, and altseason dynamics to estimate the current market phase. This may assist in contextualizing exit decisions without requiring manual phase analysis.
Exit Level Generation : Based on the asset’s strength classification and selected strategy (Conservative, Balanced, Aggressive), the system generates sequential exit levels with suggested percentages and quantities. Designed to support structured planning across three stages.
Signal Detection : Tracks multiple conditions — including price extensions, volume surges, momentum shifts, and cycle patterns — to generate alerts when predefined criteria are met.
Emergency Exit Detection : Scans for rare but high-risk scenarios (e.g., cycle top formations with multiple confluences) that may warrant immediate attention. Alerts are designed to highlight potential overextension during volatile phases.
Transfer Alerts : Calculates proximity to key exit zones and may issue early warnings to prepare for execution (e.g., moving assets from cold storage to exchanges), aiming to reduce last-minute decision pressure.
The script operates in two distinct modes:
Coin Analysis Mode Displays automatically-calculated Fibonacci levels, asset strength classification, market phase estimation, and contextual risk factors — designed to support structured analysis.
Exit Plan Mode Generates a customizable exit strategy with calculated price levels, suggested quantities, and potential outcome scenarios — aiming to assist with disciplined planning and reduce emotional bias.
------------------------------------------------------------------
✅ SETUP & INSTALLATION
Step 1: Chart Setup
Add the indicator to your altcoin USD chart (e.g., spot market pairs).
Recommended timeframe: 3 days for signal clarity.
Dark theme suggested for visual contrast.
Step 2: Configure Your Exit Strategy
Open Settings → “Setup Your Exit Plan”
Choose your strategy: Conservative: Prioritizes earlier exits for stricter risk control; Balanced: Combines early and late exits for a mixed approach; Aggressive: Targets later exits, accepting potentially higher volatility.
Input your asset quantity.
(Optional) Set a minimum sell price to block exit signals below your defined threshold.
(Optional) Set a sell-now price to trigger a sell alert when your exit target is reached, bypassing intermediate levels.
Step 3: Choose Display Mode
Coin Analysis Mode: View market conditions, strength classification, Fibonacci levels, and contextual risk insights. Designed to support monitoring and signal validation.
Exit Plan Mode: Displays your structured exit roadmap with suggested price levels, quantities, and visual chart overlays. Focuses on execution and planning.
Step 4: Set Up Alerts (Recommended)
Click the “Alert” button on the chart.
Select “Altcoins Exit Planner” as the condition.
Choose alert type: Planned Exit, Emergency Exit, Transfer Alert, Local Top, Trend Change
Set expiration to “Open-ended”
Configure your preferred notification method.
Alert Types Include:
Planned Exit Alerts: Triggered when suggested exit levels are reached (Exit #1, #2, #3).
Emergency Exit Alerts: Highlight potential cycle tops or full-exit conditions.
Transfer Alerts: Advance notice to prepare for execution (e.g., moving assets to exchanges).
Local Top Alerts: Short-term pullback signals for tactical decisions.
Trend Change Alerts: Indicate potential market phase transitions.
Once configured, the indicator begins analyzing and may notify you when exit conditions align with your selected strategy.
------------------------------------------------------------------
✅ USER INTERFACE
The interface is organized into two primary modes:
1) Coin Analysis Mode
Analysis Table Includes:
Fibonacci levels with price targets and percentage differentials
Market trend status (e.g., Strong Bull, Weakening Bull, Bear Market)
Volume behavior (Normal / Abnormal)
Price extension status (Overextended / Within range)
Altseason detection
Coin strength classification
Reversal risk assessment (Low / Average / High)
Suggested action based on current conditions
Visual Elements:
Bull/Bear trend EMA line
Volume-based candle coloring (overrides default chart candles)
Pivot points for key structural levels
Selectable Fibonacci extension/retracement lines
Background highlighting during altseason periods (potential cycle peak phase)
2) Exit Plan Mode
Exit Plan Table Displays:
Suggested quantity to sell at each exit level
Estimated portfolio value in USD
Structured exit plan with Fibonacci levels, percentages, quantities, and projected amounts
Average exit price calculation
Potential outcome scenarios if all exit levels are reached
Price Lines:
Individual exit level markers with contextual details
Average exit price reference line
Minimum sell price line (if enabled)
Sell-now price line (if enabled)
Signal Indicators:
Blue diamonds: Planned exit levels reached
Red triangles: Cycle top warnings
Orange triangles: Local top signals
These elements are designed to assist with visual interpretation and structured decision-making. All outputs are derived from price data and user-defined settings.
------------------------------------------------------------------
✅ LIMITATIONS
Market Cycle Dependency: This indicator is designed for cryptocurrency market cycles and will not perform similarly in other asset classes or market conditions. Its logic is based on historical crypto behavior, which may not repeat.
Assumption-Based Framework: The methodology relies on assumptions about market cycles, Fibonacci relationships, and altcoin behavior patterns. These assumptions may not hold under future conditions.
User Responsibility
All signals require user interpretation and decision-making.
The indicator provides information, not investment advice.
Signals should be validated with additional analysis.
Position sizing and risk management remain the user's responsibility.
Technical Requirements
Intended for use on the 3-day timeframe.
Designed for altcoin/USD trading pairs.
Requires sufficient historical data for Fibonacci calculations.
May not function properly on newly listed assets with limited price history.
Risk Management Guidelines. Recommended practices include:
Use with limited portions of your portfolio.
Combine with other technical and fundamental tools.
Consider broader market context beyond indicator signals.
Maintain independent stop-loss levels.
Review and adjust settings as market conditions evolve.
Signal Interpretation
Emergency signals highlight conditions that may warrant immediate review.
Planned exits support gradual, structured position reduction.
Transfer alerts provide preparation time before potential execution.
Local top signals may assist short-term tactical decisions.
------------------------------------------------------------------
✅ DISCLAIMER
This indicator is for educational and informational purposes only . It does not constitute financial, investment, or trading advice.
The indicator:
Makes no guarantees about future market performance.
Cannot predict market movements with certainty.
May generate false signals or miss key developments.
Relies on historical patterns that may not repeat.
Should not be used as the sole basis for trading decisions.
Users are responsible for:
Conducting independent research and analysis.
Understanding the risks of cryptocurrency trading.
Making their own investment/divestment decisions.
Managing position sizes and risk exposure appropriately.
Cryptocurrency trading involves substantial risk and may not be suitable for all investors. Past performance does not guarantee future results. Users should only invest what they can afford to lose and consult qualified professionals before making financial decisions.
The indicator’s assumptions may be invalidated by changing market conditions.
By using this tool, users acknowledge these limitations and accept full responsibility for their trading decisions.

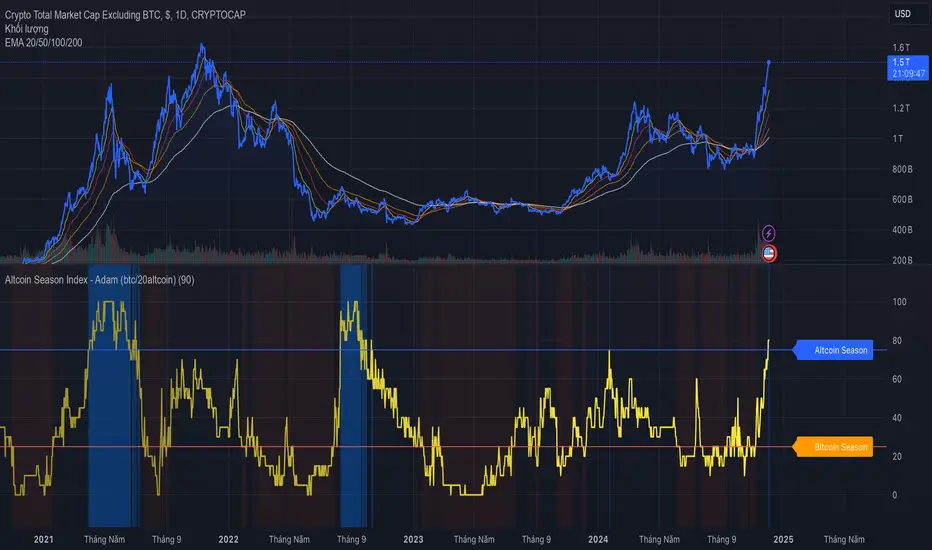
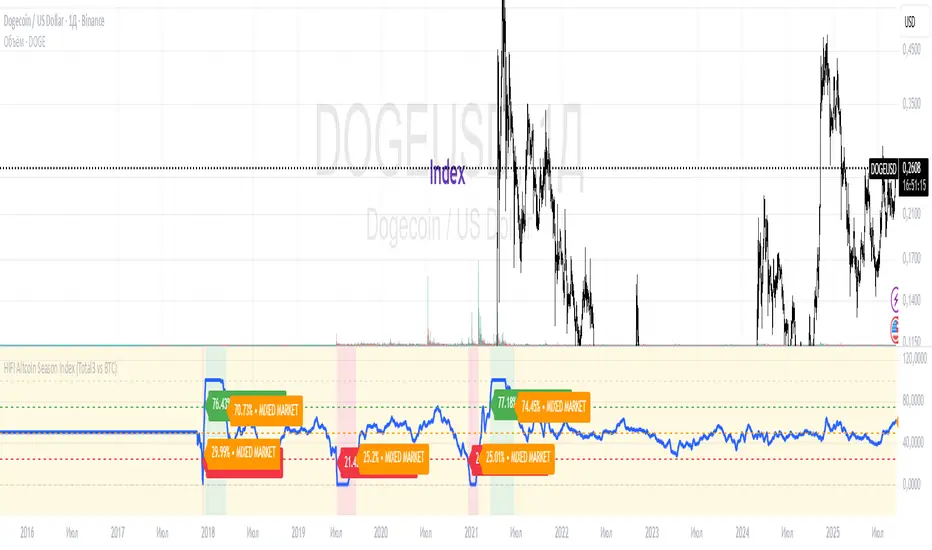
HIFI Altcoin Season Index (Total3 vs BTC)This indicator helps you determine whether the crypto market is in an "altcoin season" or a "bitcoin season." It doesn't compare every single altcoin to Bitcoin individually; instead, it uses a more efficient approach.
Methodology
The index calculates the difference in price performance over a selected period (default 90 days) between the total market capitalization of altcoins without Ethereum (TOTAL3) and Bitcoin (BTC).
Interpretation
Value above 75: TOTAL3 is showing significantly stronger growth than BTC, indicating an ALTCOIN SEASON. 🚀
Value below 25: BTC is outperforming TOTAL3, indicating a BITCOIN SEASON. 👑
Value between 25 and 75: The market is in a mixed or neutral phase. 🤷
Benefits
This method avoids the technical limitations of Pine Script when requesting data for a large number of symbols, making the indicator stable and reliable.
Disclaimer: This indicator is a tool for market analysis and should not be considered financial advice.
AltCoin & MemeCoin Index Correlation [Eddie_Bitcoin]🧠 Philosophy of the Strategy
The AltCoin & MemeCoin Index Correlation Strategy by Eddie_Bitcoin is a carefully engineered trend-following system built specifically for the highly volatile and sentiment-driven world of altcoins and memecoins.
This strategy recognizes that crypto markets—especially niche sectors like memecoins—are not only influenced by individual price action but also by the relative strength or weakness of their broader sector. Hence, it attempts to improve the reliability of trading signals by requiring alignment between a specific coin’s trend and its sector-wide index trend.
Rather than treating each crypto asset in isolation, this strategy dynamically incorporates real-time dominance metrics from custom indices (OTHERS.D and MEME.D) and combines them with local price action through dual exponential moving average (EMA) crossovers. Only when both the asset and its sector are moving in the same direction does it allow for trade entries—making it a confluence-based system rather than a single-signal strategy.
It supports risk-aware capital allocation, partial exits, configurable stop loss and take profit levels, and a scalable equity-compounding model.
✅ Why did I choose OTHERS.D and MEME.D as reference indices?
I selected OTHERS.D and MEME.D because they offer a sector-focused view of crypto market dynamics, especially relevant when trading altcoins and memecoins.
🔹 OTHERS.D tracks the market dominance of all cryptocurrencies outside the top 10 by market cap.
This excludes not only BTC and ETH, but also major stablecoins like USDT and USDC, making it a cleaner indicator of risk appetite across true altcoins.
🔹 This is particularly useful for detecting "Altcoin Season"—periods where capital rotates away from Bitcoin and flows into smaller-cap coins.
A rising OTHERS.D often signals the start of broader altcoin rallies.
🔹 MEME.D, on the other hand, captures the speculative behavior of memecoin segments, which are often driven by retail hype and social media activity.
It's perfect for timing momentum shifts in high-risk, high-reward tokens.
By using these indices, the strategy aligns entries with broader sector trends, filtering out noise and increasing the probability of catching true directional moves, especially in phases of capital rotation and altcoin risk-on behavior.
📐 How It Works — Core Logic and Execution Model
At its heart, this strategy employs dual EMA crossover detection—one pair for the asset being traded and one pair for the selected market index.
A trade is only executed when both EMA crossovers agree on the direction. For example:
Long Entry: Coin's fast EMA > slow EMA and Index's fast EMA > slow EMA
Short Entry: Coin's fast EMA < slow EMA and Index's fast EMA < slow EMA
You can disable the index filter and trade solely based on the asset’s trend just to make a comparison and see if improves a classic EMA crossover strategy.
Additionally, the strategy includes:
- Adaptive position sizing, based on fixed capital or current equity (compound mode)
- Take Profit and Stop Loss in percentage terms
- Smart partial exits when trend momentum fades
- Date filtering for precise backtesting over specific timeframes
- Real-time performance stats, equity tracking, and visual cues on chart
⚙️ Parameters & Customization
🔁 EMA Settings
Each EMA pair is customizable:
Coin Fast EMA: Default = 47
Coin Slow EMA: Default = 50
Index Fast EMA: Default = 47
Index Slow EMA: Default = 50
These control the sensitivity of the trend detection. A wider spread gives smoother, slower entries; a narrower spread makes it more responsive.
🧭 Index Reference
The correlation mechanism uses CryptoCap sector dominance indexes:
OTHERS.D: Dominance of all coins EXCLUDING Top 10 ones
MEME.D: Dominance of all Meme coins
These are dynamically calculated using:
OTHERS_D = OTHERS_cap / TOTAL_cap * 100
MEME_D = MEME_cap / TOTAL_cap * 100
You can select:
Reference Index: OTHERS.D or MEME.D
Or disable the index reference completely (Don't Use Index Reference)
💰 Position Sizing & Risk Management
Two capital allocation models are supported:
- Fixed % of initial capital (default)
- Compound profits, which scales positions as equity grows
Settings:
- Compound profits?: true/false
- % of equity: Between 1% and 200% (default = 10%)
This is critical for users who want to balance growth with risk.
🎯 Take Profit / Stop Loss
Customizable thresholds determine automatic exits:
- TakeProfit: Default = 99999 (disabled)
- StopLoss: Default = 5 (%)
These exits are percentage-based and operate off the entry price vs. current close.
📉 Trend Weakening Exit (Scale Out)
If the position is in profit but the trend weakens (e.g., EMA color signals trend loss), the strategy can partially close a configurable portion of the position:
- Scale Position on Weak Trend?: true/false
- Scaled Percentage: % to close (default = 65%)
This feature is useful for preserving profits without exiting completely.
📆 Date Filter
Useful for segmenting performance over specific timeframes (e.g., bull vs bear markets):
- Filter Date Range of Backtest: ON/OFF
- Start Date and End Date: Custom time range
OTHER PARAMETERS EXPLANATION (Strategy "Properties" Tab):
- Initial Capital is set to 100 USD
- Commission is set to 0.055% (The ones I have on Bybit)
- Slippage is set to 3 ticks
- Margin (short and long) are set to 0.001% to avoid "overspending" your initial capital allocation
📊 Visual Feedback and Debug Tools
📈 EMA Trend Visualization
The slow EMA line is dynamically color-coded to visually display the alignment between the asset trend and the index trend:
Lime: Coin and index both bullish
Teal: Only coin bullish
Maroon: Only index bullish
Red: Both bearish
This allows for immediate visual confirmation of current trend strength.
💬 Real-Time PnL Labels
When a trade closes, a label shows:
Previous trade return in % (first value is the effective PL)
Green background for profit, Red for losses.
📑 Summary Table Overlay
This table appears in a corner of the chart (user-defined) and shows live performance data including:
Trade direction (yellow long, purple short)
Emojis: 💚 for current profit, 😡 for current loss
Total number of trades
Win rate
Max drawdown
Duration in days
Current trade profit/loss (absolute and %)
Cumulative PnL (absolute and %)
APR (Annualized Percentage Return)
Each metric is color-coded:
Green for strong results
Yellow/orange for average
Red/maroon for poor performance
You can select where this appears:
Top Left
Top Right
Bottom Left
Bottom Right (default)
📚 Interpretation of Key Metrics
Equity Multiplier: How many times initial capital has grown (e.g., “1.75x”)
Net Profit: Total gains including open positions
Max Drawdown: Largest peak-to-valley drop in strategy equity
APR: Annualized return calculated based on equity growth and days elapsed
Win Rate: % of profitable trades
PnL %: Percentage profit on the most recent trade
🧠 Advanced Logic & Safety Features
🛑 “Don’t Re-Enter” Filter
If a trade is closed due to StopLoss without a confirmed reversal, the strategy avoids re-entering in that same direction until conditions improve. This prevents false reversals and repetitive losses in sideways markets.
🧷 Equity Protection
No new trades are initiated if equity falls below initial_capital / 30. This avoids overleveraging or continuing to trade when capital preservation is critical.
Keep in mind that past results in no way guarantee future performance.
Eddie Bitcoin

Bear Market Defender [QuantraSystems]Bear Market Defender
A system to short Altcoins when BTC is ranging or falling - benefit from Altcoin bleed or collapse .
QuantraSystems guarantees that the information created and published within this document and on the TradingView platform is fully compliant with applicable regulations, does not constitute investment advice, and is not exclusively intended for qualified investors.
Important Note!
The system equity curve presented here has been generated as part of the process of testing and verifying the methodology behind this script.
Crucially, it was developed after the system was conceptualized, designed, and created, which helps to mitigate the risk of overfitting to historical data. In other words, the system was built for robustness, not for simply optimizing past performance.
This ensures that the system is less likely to degrade in performance over time, compared to hyper-optimized systems that are tailored to past data. No tweaks or optimizations were made to this system post-backtest.
Even More Important Note!!
The nature of markets is that they change quickly and unpredictably. Past performance does not guarantee future results - this is a fundamental rule in trading and investing.
While this system is designed with broad, flexible conditions to adapt quickly to a range of market environments, it is essential to understand that no assumptions should be made about future returns based on historical data. Markets are inherently uncertain, and this system - like all trading systems - cannot predict future outcomes.
INTRODUCTION TO THE STAR FRAMEWORK
The STAR Framework – an abbreviation for Strategic Trading with Adaptive Risk - is a bespoke portfolio-level infrastructure for dynamic, multi-asset crypto trading systems. It combines systematic position management, adaptive sizing, and “intra-system” diversification, all built on a rigorous foundation of Risk-based position sizing .
At its core, STAR is designed to facilitate:
Adaptive position sizing based on user-defined maximum portfolio risk
Capital allocation across multiple assets with dynamic weight adjustment
Execution-aware trading with robust fee and slippage adjustment
Realistic equity curve logic based on a compounding realized PnL and additive unrealized PnL
The STAR Framework is intended for use as both a standalone portfolio system or preferred as a modular component within a broader trading “global portfolio” - delivering a balance of robustness and scalability across strategy types, timeframes, and market regimes.
RISK ALLOCATION VIA "R" CALCULATIONS
The foundational concept behind STAR is the use of the R unit - a dynamic representation of risk per trade. R is defined by the distance between a trade's entry and its stoploss, making it an intuitive and universally adaptive sizing unit across any token, timeframe, or market.
Example: Suppose the entry price is $100, and the stoploss is $95. A $5 move against the position represents a 1R loss. A 15% price increase to $115 would equal a +3R gain.
This makes R-based systems highly flexible: the user defines the percentage of capital that is put at risk per R and all positions are scaled accordingly - whether the token is volatile, illiquid, or slow-moving.
R is an advantageous method for determine position sizing - instead of being tied to complex value at risk mechanisms with having layered exit criteria, or continuous volatility-based sizing criteria that need to be adjusted while in an open trade, R allows for very straightforward sizing, invalidation and especially risk control – which is the most fundamental.
REALIZED BALANCE, FEES & SLIPPAGE ACCOUNTING
All position sizing, risk metrics, and the base equity curve within STAR are calculated based on realized balance only .
This means:
No sizing adjustments are made based on unrealized profit and loss ✅
No active positions are included in the system's realized equity until fully closed ✅
Every trade is sized precisely according to current locked-in realized portfolio balance ✅
This creates the safest risk profile - especially when multiple trades are open. Unrealized gains are not used to inflate sizing, ensuring margin safety across all assets.
All calculations also incorporate slippage and fees, based on user-defined estimates – which can and should be based upon user-collected data - and updated frequently forwards in time. These are not cosmetic, or simply applied to the final equity curve - they are fully integrated into the dynamic position sizing and equity performance , ensuring:
Stoploss hits result in exactly a −1R loss, even after slippage and fees ✅
Winners are discounted based on realistic execution costs ✅
No trade is oversized due to unaccounted execution costs ✅
Example - Slippage in R Units:
Let R be defined as the distance from entry to stoploss.
Suppose that distance is $1, and the trade is closed at a win of +$2.
If execution slippage leads to a 50 cent worse entry and a 50 cent worse exit, you’ve lost $1 extra - which is an additional 1R in execution slippage. This makes the effective return 1.0R instead of the intended 2.0R.
This is equivalent to a slippage value of 50%.
Thus, slippage in STAR is tracked and modelled on an R-adjusted basis , enabling more accurate long-term performance modelling.
MULTI-ASSET, LONG/SHORT SUPPORT
STAR supports concurrent long and short positions across multiple tokens. This can sometimes result in partially hedged exposure - for example, being long one asset and short another.
This structure has key benefits:
Diversifies idiosyncratic risk by distributing exposure across multiple tokens
Allows simultaneous exploitation of relative strength and weakness
Reduces portfolio volatility via natural hedging during reduced trending periods
Even in a highly correlated market like crypto, short-term momentum behaviour often varies between tokens - making diversified, multi-directional exposure a strategic advantage .
EQUITY CURVE
The STAR framework only updates the underlying realized equity when a position is closed, and the trade outcome is known. This approach ensures:
True representation of actual capital available for trading
No exposure distortion due to unrealized gains
Risk remains tightly linked to realized results
This trade-to-trade basis for realized equity modelling eliminates the common pitfall of overallocation based on unrealized profits.
The visual equity curve represents an accurate visualization of the Total Equity however, which is equivalent to what would be the realized equity if all trades were closed on the prior bar close.
TIMEFRAME CONSIDERATIONS
Lower timeframes typically yield better performance for STAR due to:
Greater data density per day - more observations = better statistical inference
Faster compounding - more trades per week = faster capital rotation
However, lower timeframes also suffer from increased slippage and fees. STAR's execution-aware structure helps mitigate this, but users must still choose timeframes appropriate to their liquidity, costs, and operational availability.
INPUT OPTIONS
Fees (direct trading costs - the percentage of capital removed from the initial position size)
Slippage (execution delay, as a percentage. In practice, the fill price is often worse than the signal price. This directly affects R and hence position sizing)
Risk % ( Please note : this is the risk level if every position is opened at once. 5% risk for 5 assets is 1% risk per position)
System Start date
Float Precision value of displayed numbers
Table visualization - positioning and table sizes
Adjustable color options
VISUAL SIMPLICITY
To avoid usual unnecessary complexity and empower fast at-a-glance action taking, as well as enable mobile compatibility, only the most relevant information is presented.
This includes all information required to open positions in one table.
As well as a quick and straightforward overview for the system stats
Lastly, there is an optional table that can be enabled
displaying more detailed information if desired:
USAGE GUIDELINES
To use STAR effectively:
Input your average slippage and fees %
Input your maximum portfolio risk % (this controls overall leverage and is equivalent to the maximum loss that the allocation to STAR would bring if ALL positions are allocated AND hit their stop loss at the same time)
Wait for signal alerts with entry, stop, and size details
STAR will dynamically calculate sizing, risk exposure, and portfolio allocation on your behalf. Position multipliers, stop placement, and asset-specific risk are all embedded in the system logic.
Note: Leverage must be manually set to ISOLATED on your exchange platform to prevent unwanted position linking.
ABOUT THE BEAR MARKET DEFENDER STRATEGY
The first strategy to launch on the STAR Framework is the BEAR MARKET DEFENDER (BMD) - a fast-acting, trend following system based upon the Trend Titan NEUTRONSTAR. For the details of the logic behind NEUTRONSTAR, please refer to the methodology and trend aggregation section of the following indicator:
The BMD ’s short side exit calculation methodology is slightly improved compared to NEUTRONSTAR, to capture downtrends more consistently and also cut positions faster – which is crucial when considering general jump risk in the Crypto space.
Accordingly, the only focus of the BMD is to capture trends to the short side, providing the benefit of being in a spectrum from no correlation to being negatively correlated in risk and return behavior to classical Crypto long exposure.
More precisely, Crypto behavior showcases that when Bitcoin is in a ranging/mean reverting environment, most tokens that don’t fall into the “Blue-Chip” category tend to find themselves in a trend towards 0.
Typically during this period most Crypto portfolios suffer heavily due to a “Crypto-long” biased exposure.
The Bear Market Defender thrives in these chaotic, high volatility markets where most coins trend towards zero while the traditional Crypto long exposure is either flat or in a drawdown, therefore the BMD adds a source of uncorrelated risk and returns to hedge typical long exposure and bolster portfolio volatility.
Because of the BMD's short-only exposure, it will often suffer small losses during strong uptrends. During these periods, long exposure performs the best and the goal is to outperform the temporary underperformance in the BMD .
To take advantage of the abovementioned behavior of most tokens trending to zero, assets traded in the BMD are systematically updated on a quarterly basis with available liquidity being an important consideration for the tokens to be eligible for selection.
FINAL SUMMARY
The STAR Framework represents a new generation of portfolio grade trading infrastructure, built around disciplined execution, realized equity, and adaptive position sizing. It is designed to support any number of future methodologies - beginning with BMD .
The Bear Market Defender is here to hedge out commonly long biased portfolio allocations in the Crypto market, specializing in bringing uncorrelated returns during periods of sideways price action on Bitcoin, or whole-market downturns.
Together, STAR + BMD deliver a scalable, volatility tuned system that prioritizes capital preservation, signal accuracy, and adaptive risk allocation. Whether deployed standalone or within a broader portfolio, this framework is engineered for high performance, longevity, and adaptability in the ever-evolving crypto landscape.

EMA 200 Monitor - Bybit CoinsEMA 200 Monitor - Bybit Coins
📊 OVERVIEW
The EMA 200 Monitor - Bybit Coins is an advanced indicator that automatically monitors 30 of the top cryptocurrencies traded on Bybit, alerting you when they are close to the 200-period Exponential Moving Average on the 4-hour timeframe.
This indicator was developed especially for traders who use the EMA 200 as a key support/resistance level in their swing trading and position trading strategies.
🎯 WHAT IT'S FOR
Multi-Asset Monitoring: Simultaneous monitoring of 30 cryptocurrencies without having to switch between charts
Opportunity Identification: Detects when coins are approaching the 200 EMA, a crucial technical level
Automated Alerts: Real-time notifications when a coin reaches the configured proximity
Time Efficiency: Eliminates the need to manually check chart collections
⚙️ HOW IT WORKS
Main Functionality
The indicator uses the request.security() function to fetch price data and calculate the 200 EMA of each monitored asset. With each new bar, the script:
Calculates the distance between the current price and the 200 EMA for each coin
Identifies proximity based on the configured percentage (default: 2%)
Displays results in a table organized on the chart
Generates automatic alerts when proximity is detected
Monitored Coins
Major : BTC, ETH, BNB, ADA, XRP, SOL, DOT, DOGE, AVAX
DeFi : UNI, LINK, ATOM, ICP, NEAR, OP, ARB, INJ
Memecoins : SHIB, PEPE, WIF, BONK, FLOKI
Emerging : SUI, TON, APT, POL (ex-MATIC)
📋 AVAILABLE SETTINGS
Adjustable Parameters
EMA Length (Default: 200): Exponential Moving Average Period
Proximity Percentage (Default: 2%): Distance in percentage to consider "close"
Show Table (Default: Active): Show/hide results table
Table Position: Position of the table on the chart (9 options available)
Color System
🔴 Red: Distance ≤ 1% (very close)
🟠 Orange: Distance ≤ 1.5% (close)
🟡 Yellow: Distance ≤ 2% (approaching)
🚀 HOW TO USE
Initial Configuration
Add the indicator to the 4-hour timeframe chart
Set the parameters according to your strategy
Position the table where there is no graphic preference
Setting Alerts
Click "Create Alert" in TradingView
Select the "EMA 200 Monitor" indicator
Set the notification frequency and method
Activate the alert to receive automatic notifications
Results Interpretation
The table shows:
Coin: Asset name (e.g. BTC, ETH)
Price: Current currency quote
EMA 200: Current value of the moving average
Distance: Percentage of proximity to the core code
💡 STRATEGIES TO USE
Reversal Trading
Entry: When price touches or approaches the EMA 200
Stop: Below/above the EMA with a safety margin
Target: Previous resistance/support levels
Breakout Trading
Monitoring: Watch for currencies consolidating near the EMA 200
Entry: When the media is finally broken
Confirmation: Volume and close above/below the EMA
Swing Trading
Identification: Use the monitor to detect setups in formation
Timing: Wait for the EMA 200 to approach for detailed analysis
Management: Use the EMA as a reference for stops dynamics
⚠️ IMPORTANT CONSIDERATIONS
Technical Limitations
Request Bybit data: Access to exchange symbols required
Specific timeframe: Optimized for 4-hour analysis
Minimum delay: Data updated with each new bar
Usage Recommendations
Combine with technical analysis: Use together with other indicators
Confirm the configuration: Check the graphic patterns before trading
Manage risk: Always use stop loss and adequate position sizing
Backtesting: Test your strategy before applying with real capital
Disclaimer
This indicator is a technical analysis tool and does not constitute investment advice. Always do your own analysis and manage detailed information about the risks of your operations.
🔧 TECHNICAL INFORMATION
Pine Script version: v6
Type: Indicator (overlay=true)
Compatibility: All TradingView plans
Resources used: request.security(), arrays, tables
Performance: Optimized for multiple simultaneous queries
📈 COMPETITIVE ADVANTAGES
✅ Simultaneous monitoring of 30 major assets ✅ Clear visual interface with intuitive core system ✅ Customizable alerts for different details ✅ Optimized code for maximum performance ✅ Flexible configuration adaptable to different strategies ✅ Real-time update without the need for manual refresh
Developed for traders who value efficiency and accuracy in identifying market opportunities based on the EMA 20

ZenAlgo - DominatorThis indicator provides a structured multi-ticker overview of market momentum and relative strength by analyzing short-term price behavior across selected assets in comparison with broader crypto dominance and Bitcoin/ETH performance.
Ticker and Market Data Handling
The script accepts up to 9 user-defined symbols (tickers) along with BTCUSD and ETHUSD. For each symbol:
It retrieves the current price.
It also requests the daily opening price from the "D" timeframe to compute intraday percentage change.
For BTC, ETH, and dominance (sum of BTC, USDT, and USDC dominance), daily change is calculated using this same method.
This comparison enables tracking relative performance from the daily open, which provides meaningful insight into intraday strength or weakness among different assets.
Dominance Logic
The indicator aggregates dominance data from BTC , USDT , and USDC using TradingView’s CRYPTOCAP indices. This combined dominance is used as a reference in directional and status calculations. ETH dominance is also analyzed independently.
Changes in dominance are used to infer whether market attention is shifting toward Bitcoin/stablecoins (typically indicating risk-off sentiment) or away from them (typically risk-on behavior, benefiting altcoins).
Price Direction Estimation
The script estimates directional bias using an EMA-based deviation technique:
A short EMA (user-defined lookback , default 4 bars) is calculated.
The current close is compared to the EMA to assess directional bias.
Recent candle changes are also inspected to confirm a consistent short-term trend (e.g., 3 consecutive higher closes for "up").
A small threshold is used to avoid classifying flat movements as trends.
This directionality logic is applied separately to:
The selected ticker's price
BTC price
Combined dominance
This allows the script to contextualize the movement of each asset within broader market conditions.
Market Status Evaluation
A custom function analyzes ETH and BTC dominance trends along with their relative strength to define the overall market regime:
Altseason is identified when BTC dominance is declining, ETH dominance rising, and ETH outperforms BTC.
BTC Season occurs when BTC dominance is rising, ETH dominance falling, and BTC outperforms ETH.
If neither condition is met, the state is Neutral .
This classification is shown alongside each ticker's row in the table and helps traders assess whether market conditions favor Bitcoin, Ethereum, or altcoins in general.
Ticker Status Classification
Each ticker is analyzed independently using the earlier directional logic. Its status is then determined as follows:
Full Bull : Ticker is trending up while dominance is declining or BTC is also rising.
Bullish : Ticker is trending up but not supported by broader bullish context.
Bearish : Ticker is trending down but without broader confirmation.
Full Bear : Ticker is trending down while dominance rises or BTC falls.
Neutral : No strong directional bias or conflicting context.
This classification reflects short-term momentum and macro alignment and is color-coded in the results table.
Table Display and Plotting
A configurable table is shown on the chart, which:
Displays the name and status of each selected ticker.
Optionally includes BTC, ETH, and market state.
Uses color-coding for intuitive interpretation.
Additionally, price changes from the daily open are plotted for each selected ticker, BTC, ETH, and combined dominance. These values are also labeled directly on the chart.
Labeling and UX Enhancements
Labels next to the current candle display price and percent change for each active ticker and for BTC, ETH, and combined dominance.
Labels update each bar, and old labels are deleted to avoid clutter.
Ticker names are dynamically shortened by stripping exchange prefixes.
How to Use This Indicator
This tool helps traders:
Spot early rotations between Bitcoin and altcoins.
Identify intraday momentum leaders or laggards.
Monitor which tickers align with or diverge from broader market trends.
Detect possible sentiment shifts based on dominance trends.
It is best used on lower to mid timeframes (15m–4h) to capture intraday to short-term shifts. Users should cross-reference with longer-term trend tools or structural indicators when making directional decisions.
Interpretation of Values
% Change : Measures intraday move from daily open. Strong positive/negative values may indicate breakouts or reversals.
Status : Describes directional strength relative to market conditions.
Market State : Gives a general bias toward BTC dominance, ETH strength, or altcoin momentum.
Limitations & Considerations
The indicator does not analyze liquidity or volume directly.
All logic is based on short-term movements and may produce false signals in ranging or low-volume environments.
Dominance calculations rely on external CRYPTOCAP indices, which may differ from exchange-specific flows.
Added Value Over Other Free Tools
Unlike basic % change tables or price overlays, this indicator:
Integrates dominance-based macro context into ticker evaluation.
Dynamically classifies market regimes (BTC season / Altseason).
Uses multi-factor logic to determine ticker bias, avoiding single-metric interpretation.
Displays consolidated information in a table and chart overlays for rapid assessment.

Regime Filter IndicatorRegime Filter – Crypto Market Trend Indicator
📊 Overview
The Regime Filter is a powerful market analysis indicator designed specifically for crypto trading. It helps traders identify whether the market is in a bullish or bearish phase by analyzing key assets in the cryptocurrency market, including Bitcoin (BTC), Bitcoin Dominance (BTC.D), and the Altcoin Market (TOTAL3). The indicator compares these assets against their respective Simple Moving Averages (SMA) to determine the overall market regime, allowing traders to make more informed decisions.
🔍 How It Works
The Regime Filter evaluates three main components to determine the market's sentiment:
1. BTC Dominance (BTC.D) vs. 40 SMA (Medium Timeframe)
The Bitcoin Dominance (BTC.D) is compared to its 40-period SMA on a mid-timeframe (e.g.,
1-hour). If BTC.D is below the 40 SMA, it indicates that altcoins are performing well relative
to Bitcoin, suggesting a bullish altcoin market. If BTC.D is above the 40 SMA, Bitcoin is
gaining dominance, indicating a potential bearish phase for altcoins.
2. TOTAL3 Market Cap vs. 100 SMA (Medium Timeframe)
The TOTAL3 index, which tracks the total market capitalization of all cryptocurrencies except
Bitcoin and Ethereum, is compared to its 100-period SMA. A bullish signal occurs when TOTAL3
is above the 100 SMA, indicating strength in altcoins, while a bearish signal occurs when
TOTAL3 is below the 100 SMA, signaling a potential weakness in the altcoin market.
3. BTC Price vs. 200 SMA (Higher Timeframe)
The current Bitcoin price is compared to its 200-period Simple Moving Average (SMA) on a
higher timeframe (e.g., 4-hour). A bullish signal is given when the BTC price is above the 200
SMA, and a bearish signal when it's below.
🟢 Bullish Market Conditions
The market is considered bullish when:
- BTC Dominance (BTC.D) is below the 40 SMA, suggesting altcoins are gaining momentum.
- TOTAL3 Market Cap is above the 100 SMA, signaling strength in the altcoin market.
- BTC price is above the 200 SMA, indicating an uptrend in Bitcoin.
In these conditions, the background turns green 🟢, and a "Bullish" label is displayed on the chart.
🔴 Bearish Market Conditions
The market is considered bearish when:
- BTC Dominance (BTC.D) is above the 40 SMA, indicating Bitcoin is outperforming altcoins.
- TOTAL3 Market Cap is below the 100 SMA, signaling weakness in altcoins.
- BTC price is below the 200 SMA, indicating a downtrend in Bitcoin.
In these conditions, the background turns red 🔴, and a "Bearish" label appears on the chart.
⚙ Customization Options
- The Regime Filter offers flexibility for traders:
- Enable or Disable Specific SMAs: Customize the indicator by enabling or disabling the 200 SMA for Bitcoin, the 40 SMA for BTC Dominance, and the 100 SMA for TOTAL3.
- Adjust Timeframes: Choose the timeframes for each of the moving averages to suit your preferred trading strategy.
- Real-Time Data Adjustments: The indicator updates in real-time to reflect current market conditions, ensuring timely analysis.
📈 Best Use Cases
- Trend Confirmation: The Regime Filter is ideal for confirming the market's overall trend,
helping traders to align their positions with the dominant market sentiment.
- Trade Entry/Exit Signals: Use the indicator to identify favorable entry or exit points based on
whether the market is in a bullish or bearish phase.
- Market Overview: Gain a quick understanding of the broader crypto market, with a focus on
Bitcoin and altcoins, to make more strategic decisions.
⚠️ Important Notes
Trend-Following Indicator: The Regime Filter is a trend-following tool, meaning it works best in strong trending markets. It may not perform well in choppy, sideways markets.
Risk Management: This indicator is designed to assist in identifying market trends, but it does not guarantee profits. Always apply sound risk management strategies and use additional indicators when making trading decisions.
Not a Profit Guarantee: While this indicator can help identify potential market trends, no trading tool or strategy guarantees profits. Please trade responsibly and ensure that your decisions are based on comprehensive analysis and risk tolerance.

3Commas Multicoin Scalper PRO [SwissAlgo]Introduction
Are you tired of tracking dozens of cryptocurrency charts and placing orders manually on your Exchange?
The 3Commas Multicoin Scalper PRO is an automated trading system designed to simultaneously identify and execute potential trading setups on multiple cryptocurrencies on your preferred Exchange (Binance, Bybit, OKX, Gate.io, Bitget) via 3Commas integration.
It analyzes price action, volume, momentum, volatility, and trend patterns across 180+ USDT Perpetual coins divided into 17 crypto categories , providing real-time signals directly to your 3Commas bots for automated trade execution. This indicator aims to identify potential trend-following and contrarian setups in both bull and bear markets.
-------------------------------------
What it Does
The 3Commas Multicoin Scalper PRO is a technical analysis tool that monitors multiple cryptocurrency pairs simultaneously and connects with 3Commas for signal delivery and execution.
Here's how the strategy works:
🔶 Technical Analysis : Analyzes price action, volume, momentum, volatility, and trend patterns across multiple USDT Perpetual Futures contracts simultaneously.
🔶 Pattern Detection : Identifies specific candle patterns and technical confluences that suggest potential trading setups across all USDT.P contracts of the selected categories
🔶 Signal Generation : When technical criteria are met at bar close, the indicator creates deal-start signals for the relevant pairs.
🔶 3Commas Integration : Packages these signals and delivers them to 3Commas through TradingView alerts, allowing 3Commas bots to receive specific pair information ('Deal-Start' signals).
🔶 Category Management : Each TradingView alert monitors an entire category (approximately 11 pairs), allowing selective activation of different crypto categories.
🔶 Visual Feedback : Provides color-coded candles and backgrounds to visualize technical conditions, with optional pivot points and trend visualization.
Candle types:
Signals:
-------------------------------------
Quick Start Guide
1. Setup 3Commas Bots : Configure two DCA bots in 3Commas (All USDT pairs) - one for LONG positions and one for SHORT positions.
2. Define Trading Parameters : Set your budget for each trade and adjust your preferred sensitivity within the indicator settings.
3. Create Category Alerts : Set up one TradingView alert for each crypto category you want to trade.
That's it! Once configured, the system automatically sends signals to your 3Commas bots when predefined trading setups are detected across coins in your selected/activated categories. The indicator scans all coins at bar close (for example, every hour on the 1H timeframe) and triggers trade execution only for those showing technical confluences.
Important : The more categories you activate by setting TradingView alerts, the more signals your 3Commas bots will receive. Consider your total capital when enabling multiple categories. More details about the setup process are provided below (see paragraph "Detailed Setup & Configuration")
-------------------------------------
Built-in Backtesting
The 3Commas Multicoin Scalper PRO includes backtesting visualization for each coin. When viewing any USDT Perpetual pair on your chart, you can visualize how the strategy would have performed historically on that specific asset.
Color-coded candles and signal markers show past trading setups, helping you evaluate which coins responded best to the strategy. This built-in backtesting capability can support your selection of assets/categories to trade before deploying real capital.
As backtesting results are hypothetical and do not guarantee future performance, your research and analysis are essential for selecting the crypto categories/coins to trade.
The default strategy settings are: Start Capital 1.000$, leverage 25X, Commissions 0.1% (average Taker Fee on Exchanges for average users), Order Amount 200$ for Longs/150$ for Shorts, Slippage 4
-------------------------------------
Key Features
🔶 Multi-Exchange Support : Compatible with BINANCE, BYBIT, BITGET, GATEIO, and OKX USDT Perpetual markets (USDT.P)
🔶 Wide Asset Coverage : Simultaneously analyzes 180+ cryptocurrencies across 17 specialized crypto categories
🔶 Custom Category Option : Create your watchlist with up to 10 custom USDT Perpetual pairs
🔶 3Commas Integration : Seamlessly connects with 3Commas bots to automate trade entries and exits
🔶 Dual Strategy Approach : Identifies both "trend following" and "contrarian" potential setups
🔶 Confluence-Based Signals : Uses a combination of multiple technical factors - price spikes, price momentum, volume spikes, volume momentum, trend analysis, and volatility spikes - to generate potential trading setups
🔶 Risk Management : Adjustable sensitivity/risk levels, leverage settings, and budget allocation for each trade
🔶 Visual Indicators : Color-coded candles and trading signals provide visual feedback on market conditions
🔶 Trend Indication : Background colors showing ongoing uptrends/downtrends
🔶 Pivot Points & Daily Open : Optional display of pivot points and daily open price for additional context
🔶 Liquidity Analysis : Optional display of high/low liquidity timeframes throughout the trading week
🔶 Trade Control : Configurable limit for the maximum number of signals sent to 3Commas for execution (per bar close and category)
Available Exchanges
Categories
Custom Category
Trend following/contrarian signals
-------------------------------------
Methodology
The 3Commas Multicoin Scalper PRO utilizes a multi-faceted approach to identify potential trading setups:
1. Price Action Analysis : Detects abnormal price movements by comparing the current candle's range to historical averages and standard deviations, helping identify potential "pump and dump" scenarios or new-trends start
2. Price Momentum : Evaluates the relative strength of bullish vs. bearish price movements over time, indicating the build-up of buying or selling pressure.
3. Volume Analysis: Identifies unusual volume spikes by comparing current volume to historical averages, signaling strong market interest in a particular direction.
4. Volume Momentum : Measures the ratio of bullish to bearish volume, revealing the dominance of buyers or sellers over time.
5. Trend Analysis : Combines EMA slopes, RSI, and Stochastic RSI to determine overall trend direction and strength.
6. Volatility : Monitors the ATR (Average True Range) to detect periods of increased market volatility, which may indicate potential breakouts or reversals
7. Candle Wick Analysis : Evaluates upper and lower wick percentages to detect potential rejection patterns and reversals.
8. Pivot Point Analysis : Uses pivot points (PP, R1-R3, S1-S3) for identifying key support/resistance areas and potential breakout/breakdown levels.
9. Daily Open Reference: Analyzes price action relative to the daily open for potential setups related to price movement vs. the opening price
10. Market Timing/Liquidity : Evaluates high/low liquidity periods, specific days/times of heightened risk, and potential market manipulation timeframes.
11. Boost Factors : Applies additional weight to certain confluence patterns to adjust global scores
These factors are combined into a "Global Score" ranging from -1 to +1 , applied at bar close to the newly formed candles.
Scores above predefined thresholds (configurable via the Sensitivity Settings) indicate strong bullish or bearish conditions and trigger signals based on predefined patterns. The indicator then applies additional filters to generate specific "Trend Following" and "Contrarian" trading signals. The identified signals are packaged and sent to 3Commas for execution.
Pivot Points
Daily open
Market Trend
Liquidity patterns by weekday
-------------------------------------
Who This Strategy Is For?
The 3Commas Multicoin Scalper PRO may benefit:
Crypto Traders seeking to automate their trading across multiple coins simultaneously
3Commas Users looking to enhance their bot performance with advanced technical signals
Busy Traders who want to monitor many market opportunities without constant chart-watching
Multi-strategy traders interested in both trend-following and reversal trading approaches
Traders of Various Experience Levels from intermediate traders wanting to save time to advanced traders seeking to scale their operations
Perpetual Futures Traders on major exchanges (Binance, Bybit, OKX, Gate.io, Bitget)
Swing and Scalp Traders seeking to identify short to medium-term profit opportunities
-------------------------------------
Visual Indicators
The indicator provides visual feedback through:
1. Candlestick Colors :
* Lime: Strong bullish candle (High positive score)
* Blue: Moderate bullish candle (Medium positive score)
* Red: Strong bearish candle (High negative score)
* Purple: Moderate bearish candle (Medium negative score)
* Pale Green/Red: Mild bullish/bearish candle
2. Signal Markers :
* ↗: Trend Following Long signal
* ↘: Trend Following Short signal
* ⤴: Contrarian Long signal
* ⤵: Contrarian Short signal
3. Optional Elements :
* Pivot Points: Daily support/resistance levels (R1-R3, S1-S3, PP)
* Daily Open: Reference price level for the current trading day
* Trend Background: Color-coded background suggesting potential ongoing uptrend/downtrend
* Liquidity Highlighting: Background colors indicating typical high/low market liquidity periods
4. TradingView Strategy Plots and Backtesting Data : Standard performance metrics showing entry/exit points, equity curves, and trade statistics, based on the signals generated by the script.
-------------------------------------
Detailed Setup & Configuration
The indicator features a user-friendly input panel organized in sequential steps to guide you through the complete setup process. Tooltips for each step provide additional information to help you understand the actions required to get the strategy running.
Informative tables provide additional details and instructions for critical setup steps such as 3Commas bot configuration and TradingView alert creation (to activate trading on specific categories).
1. Choose Exchange, Crypto Category & Sensitivity
* Select your USDT Perpetual Exchange (BINANCE, BYBIT, BITGET, GATEIO, or OKX) - i.e. the same Exchange connected in your 3Commas account
* Browse and choose your preferred crypto category, or define your watchlist
* Choose from three sensitivity levels: Default, Aggressive, or Test Mode (test mode is designed to generate way more signals, a potentially helpful feature when you are testing the indicator and alerts)
2. Setup 3Commas Bots and integrate them with the algo
* Create both LONG and SHORT DCA Bots in 3Commas
* Configure bots to accept signals for 'All USDT Pairs' with "TradingView Custom Signal" as deal start condition
* Enter your Bot IDs and Email Token in the indicator settings
* Set a maximum budget for LONG and SHORT trades
* Choose whether to allow LONG trades, SHORT trades, or both, according to your preference and market analysis
* Set maximum trades per bar/category (i.e. the max. number of simultaneous signals that the algo may send to your 3Commas bots for execution at every bar close - every hour if you set the 1H timeframe)
* Access the detailed setup guide table for step-by-step 3Commas configuration instructions
3Commas integration
3. Choose Visuals
* Toggle various optional visual elements to add to the chart: category metrics, fired alerts, coin metrics, daily open, pivot points
* Select a color theme: Dark or Light
4. Activate Trading via Alerts
* Create TradingView alerts for each category you want to trade
* Set alert condition to "3Commas Multicoin Scalper" with "Any alert() function call"
* Set the content of the message filed to: {{Message}}, deleting the default content shown in this text field, to enable proper 3Commas integration (any other text than {{Message}}, would break the delivery trading signals from Tradingview to 3Commas)
* View the alerts setup instruction table for visual guidance on this critical step
Alerts
Fired Alerts
Important Configuration Notes
Ensure that the TradingView chart's exchange matches your selected exchange in the indicator settings and your 3Commas bot settings.
You must configure the same leverage in both the script and your 3Commas bots
Your 3Commas bots must be configured for All USDT pairs
You must enter the exact Bot IDs and Email Token from 3Commas (these remain confidential - no one, including us, has access to them)
If you activate multiple categories without sufficient capital, 3Commas will display " insufficient funds " errors - align your available capital with the number of categories you activate (each deal will use the budget amount specified in user inputs)
You are free to set your Take Profit % / trailing on 3Commas
We recommend not to use DCA orders (i.e. set the number of DCA orders at zero)
Legend of symbols
-------------------------------------
FAQs
General Questions
❓ Q: What is Global Score? A: The Global Score serves as a foundation for signal generation. When a candle's score exceeds certain thresholds (defined by your Risk Level setting), it becomes a candidate for signal generation. However, not all high-scoring candles generate trading signals - the indicator applies additional pattern recognition and contextual filters. For example, a strongly positive score (lime candle) in an established uptrend may trigger a "Trend Following" signal, while a strongly negative score (red candle) in a downtrend might generate a "Trend Following Short" signal. Similarly, contrarian signals are generated when specific reversal patterns occur alongside appropriate Global Score values, often involving wick analysis and pivot point interactions. This multi-layer approach helps filter out false positives and identify higher-probability trading setups.
❓ Q: What's the difference between "Trend following" and "Contrarian" signals in the script? A: "Trend Following" signals follow the identified trends while "Contrarian" signals anticipate potential trend reversals.
❓ Q: Why can't I configure all the parameters? A: We've designed the solution to be plug-and-play to prevent users from getting lost in endless configurations. The preset values have been tested against their trade-offs in terms of financial performance, average trade duration, and risk levels.
❓ Q: Why don't I see any signals on my chart? A: Make sure you're viewing a USDT Perpetual pair from your selected exchange that belongs to the crypto category you've chosen to analyze. For example, if you've selected the "Top Major Coins" category with Binance as your exchange, you need to view a chart of one of those specific pairs (like BINANCE:BTCUSDT.P) to see signals. If you switch exchanges, for example from Binance to Bybit, you need to pull a Bybit pair on the chart to see backtesting data and signals.
❓ Q: Does this indicator guarantee profits? A: No. Trading cryptocurrencies involves significant risk, and past performance is not indicative of future results. This indicator is a tool to help you identify potential trading setups, but it does not and cannot guarantee profits.
❓ Q: Does this indicator repaint or use lookahead bias? A: No. All trading signals generated by this indicator are based only on completed price data and do not repaint. The system is designed to ensure that backtesting results reflect as closely as possible what you should experience in live trading.
While reference levels like pivot points are kept stable throughout the day using lookahead on, the actual buy and sell signals are calculated using only historical data (lookahead off) that would have been available at that moment in time. This ensures reliability and consistency between backtesting and real-time trading performance.
Technical Setup
❓ Q: What exchanges are supported? A: The strategy supports BINANCE, BYBIT, BITGET, GATEIO, and OKX USDT Perpetual markets (i.e. all the Exchanges you can connect to your 3Commas account for USDT Perpetual trading, excluding Coinbase Perpetual that offers UDSC pairs, instead of USDT).
❓ Q: What timeframe should I use? A: The indicator is optimized for the 1-hour (1H) timeframe but may run on any timeframe.
❓ Q: How many coins can I trade at once? A: You can trade all coins within each selected category (up to 11 coins per category in standard categories). You can activate multiple categories by setting up multiple alerts.
❓ Q: How many alerts do I need to set up? A: You need to set up one alert for each crypto category you want to trade. For example, if you want to trade both the "Top Major Coins" and the "DeFi" categories, you'll need to create two separate alerts, one for each category. We recommend starting with one category, testing the results carefully, monitoring performance daily, and perhaps activating additional categories in a second stage.
❓ Q: Are there any specific risk management features built into the indicator? A: Yes, the indicator includes risk management features: adjustable maximum trades per hour/category, the ability to enable/disable long or short signals depending on market conditions, customizable trade size for both long and short positions, and different sensitivity/risk level settings.
❓ Q: What happens if 3Commas can't execute a signal? A: If 3Commas cannot execute a signal (due to insufficient funds, bot offline, etc.), the trade will be skipped. The indicator will continue sending signals for other valid setups, but it doesn't retry failed signals.
❓ Q: Can I run this indicator on multiple charts at once? A: Yes, but it's not necessary. The indicator analyzes all coins in your selected categories regardless of which chart you apply it to. For optimal resource usage, apply it to a single chart of a USDT Perpetual pair from your selected exchange. To stop trading a category delete the alert created for that category.
❓ Q: How frequently does the indicator scan for new signals? A: The indicator scans all coins in your selected categories at the close of each bar (every hour if you selected the 1H timeframe).
3Commas Integration
❓ Q: Do I need a 3Commas account? A: Yes, a 3Commas account with active DCA bots (both LONG and SHORT) is required for automated trade execution. A paid subscription is needed, as multipair Bots and multiple simultaneous deals are involved.
❓ Q: How do I set the leverage? A: Set the leverage identically in both the indicator settings and your 3Commas DCA bots (the max supported leverage is 50x). Always be careful about leverage, as it amplifies both profits and losses.
❓ Q: Where do I find my 3Commas Bot IDs and Email Token? A: Open your 3Commas DCA bot and scroll to the "Messages" section. You'll find the Bot ID and Email Token within any message (e.g., "Start Deal").
Display Settings
❓ Q: What does the Sensitivity setting do? A: It adjusts the sensitivity of signal generation. "Default" provides a balanced approach with moderate signal frequency. "Aggressive" lowers the thresholds for signal generation, potentially increasing trade frequency but may include more noise. "Test Mode" is the most sensitive setting, useful for testing alert configurations but not recommended for live trading. Higher risk levels may generate more signals but with potentially lower average quality, while lower risk levels produce fewer but potentially better signals.
❓ Q: What does "Show fired alerts" do? A: The "Show fired alerts" option displays a label on your chart showing which signals have been fired and sent to 3Commas during the most recent candle closes. This visual indicator helps you confirm that your alerts are working properly and shows which coins from your selected category have triggered signals. It's useful when setting up and testing the system, allowing you to verify that signals are being sent to 3Commas as expected and their frequency over time.
❓ Q: What does "Show coin/token metrics" do? A: This toggle displays detailed technical metrics for the specific coin/token currently shown on your chart. When enabled, it shows statistics for the last closed candle for that coin.
❓ Q: What does "Show most liquid days/times" do? A: This toggle displays color-coded background highlighting to indicate periods of varying market liquidity throughout the trading week. Green backgrounds show generally higher liquidity periods (typically weekday trading hours), yellow highlights potentially manipulative periods (often Sunday/Monday overnight), and gray indicates low liquidity periods (when major markets are closed or during late hours).
⚠️ Disclaimer
This indicator is for informational and educational purposes only and does not constitute financial advice. Trading cryptocurrencies involves significant risk, including the potential loss of all invested capital, and past performance is not indicative of future results.
Always conduct your own thorough research (DYOR) and understand the risks involved before making any trading decisions. Trading with leverage significantly amplifies both potential profits and losses - exercise extreme caution when using leverage and never risk more than you can afford to lose.
The Bot ID and Email Token information are transmitted directly from TradingView to 3Commas via secure connections. No third party or entity will ever have access to this data (including the Author). Do not share your 3Commas credentials with anyone.
This indicator is not affiliated with, endorsed by, or sponsored by TradingView or 3Commas.

Altcoins DCA ScalperIntroduction
The Altcoins DCA Scalper is a Pine Strategy Script designed to automate Altcoins trading through 3Commas integration. It implements a Dollar-Cost Averaging (DCA) strategy that expands upon 3Commas' standard DCA capabilities, helping to manage risk while trading both long and short positions automatically.
This tool aims to assist both beginners exploring automated trading and experienced 3Commas users seeking dynamic DCA automation. The script is specifically designed for the 1-minute timeframe , where it has shown a good balance between performance and risk management. Complete setup typically takes less than 10 minutes, with a detailed guide making configuration straightforward for users of all experience levels.
------------------------------
🔶 What is DCA?
------------------------------
Dollar-cost averaging (DCA) refers to the practice of gradually increasing your position size at lower prices when trading long, or at higher prices when trading short, to achieve a better average entry price if the market moves against the initial entry . Instead of investing all capital at once, which could result in a significant drawdown if the price moves unfavorably, DCA spreads entries across different price levels to help manage potential drawdowns as they occur.
In this script, DCA is implemented through a system that:
🔹 Triggers safety orders only when/if needed (if take profit isn't reached quickly)
🔹 Dynamically adjusts order sizing based on market volatility
🔹 Automatically reduces take profit targets after each DCA order to increase the likelihood of a positive outcome
🔹 Can handle drawdowns depending on market volatility and settings
The images below illustrate two scenarios: one where an entry reaches the take profit directly, without activating DCA orders, and another where DCA is utilized, with the order closing positively after two DCA orders.
Case 1: Order closes in profit after entry
Case 2: Order closes in profit after 2 DCA orders (dynamically placed based on trend and volatility)
This DCA implementation aims to enhance standard 3Commas DCA by adding market-adaptive features while maintaining risk management principles.
------------------------------
🔶 Could this strategy script benefit you?
------------------------------
This script may be helpful if you are:
✅ Looking to automate your trading through 3Commas integration while maintaining full control of your assets
✅ Wanting to enhance 3Commas' standard DCA with market-adaptive features that consider:
Multi-timeframe trend analysis
Real-time volatility assessment
Dynamic safety order sizing and timing
✅ Seeking to minimize chart monitoring through full automation of:
Entry and exit decisions
Safety order management
Risk controls
✅ Interested in comprehensive performance tracking with:
Real-time position metrics
Detailed backtesting capabilities
Risk/reward analysis
Backtesting Metrics (script performance over the backtesting period - which is approx. 15 days on the 1min timeframe with the TradingView Pro Plan):
Current/Open Deal Metrics (the deal is currently under DCA, and waiting for further actions to close):
✅ Looking for trading automation that remains easy to set up and use
Note: While this script provides trading automation, successful trading requires proper education, risk management, and regular performance monitoring. No automated tool can guarantee trading success or profits.
------------------------------
🔶 How it Works
------------------------------
The Altcoins DCA Scalper provides trading automation through:
Market Analysis
* Multi-timeframe trend analysis (1m to 1d) for market direction and entry validation
* Volatility assessment (1h, 4h, 24h) benchmarked against TOTAL3 (excluding Top10 Altcoins and Stablecoins)
* Real-time adjustment of DCA parameters based on:
* Current volatility class (low/medium/high) vs. overall Altcoins market
* Market trend strength
* Price action dynamics
Trading Execution
* Position opening aligned with detected market trends
* "Beast Mode" base order sizing that increases position size during strong trends
* Dynamic take-profit targets that automatically reduce after each safety order to increase the likelihood of positive exits
* Dynamic DCA with safety orders that can:
* Adapt timing based on volatility
* Scale order sizes based on market conditions
* Handle 30-50% drawdowns depending on volatility class
* Execute up to 6 safety orders per position
Risk Management
* Emergency exits during extreme market events:
* "Black Swan" protection for long positions
* "God-Candle" protection for short positions
* Configurable stop-loss with volatility-based placement
* Trend-switch management with automated position reversal
* Position aging controls to prevent capital lock-up
* Leveraged trading protection with a pre-liquidation exit system
Integration & Automation
* Quick setup with two 3Commas bots (typically under 10 minutes)
* Fully automated signal generation and execution through 3Commas
* Detailed performance tracking including:
* Real-time position metrics
* DCA depth analysis
* Win rate and ROE calculations
* Pre-configured settings optimized for most pairs
* Multiple customization options for experienced users
Note: While this strategy employs automation and risk management, trading always carries the risk of loss. No system can guarantee profits, and market conditions significantly impact performance. Always do your own research and monitor your positions closely.
------------------------------
How to Use
------------------------------
Setting up the Altcoins DCA Scalper is quick and facilitated by the User Interface:
1️⃣ 3Commas/TradingView Setup
* Create two 3Commas accounts if using the FREE plan:
* One account for Long Bot
* One account for Short Bot
* This split allows full functionality while staying within 3Commas' free tier limits
* You do not need two separate accounts if you have a Paid 3Commas subscription
* While a free TradingView account works with the script, it limits you to one trading pair and a 4-day backtesting history. A paid TradingView subscription removes these limitations (such as the "Essential" plan).
2️⃣ Bot Configuration
* Create one Long and one Short DCA Bot in 3Commas
* Follow the setup guide available in the script itself for hassle-free configuration
* Copy Bot IDs and Email Token for script connection
* No complex settings needed - the script manages all DCA parameters by itself
3️⃣ Script Implementation
* Apply the script to your TradingView charts
* Use the built-in backtesting to analyze performance on different pairs
* Focus on USDT.P futures pairs with good volatility
4️⃣ Trading Activation
* Create TradingView alerts for each trading pair you want to activate
* Example: Set an alert for BINANCE: XRPUSDT.P following the in-script guide
* The script automatically manages all aspects:
* Entry and exit decisions
* DCA execution
* Risk management
* Position monitoring
Capital Requirements
* Important: Ensure sufficient capital to cover all activated pairs
* Consider volatility class when allocating capital to specific pairs
Once setup is complete, the script operates fully automatically while you maintain complete control of your funds through 3Commas and your exchange.
Note: While the setup is straightforward, always start with a small number of pairs and monitor performance before expanding. Trade responsibly and never risk more than you can afford to lose.
------------------------------
Explaining the Settings
------------------------------
The Altcoins DCA Scalper offers mulitple customization options during the setup process. All settings include detailed tooltips and default values.
Core Settings Sections:
1️⃣ 3Commas Connection
* Bot IDs and Email Token configuration
* Leverage settings (1x to 5x supported)
* Detailed 3Commas bot setup guide included
* Automatic bot control configuration
2️⃣ Trading Parameters
* Capital allocation per trade
* Timeframe verification
* Alert system setup
* Backtesting period control
* Performance tracking preferences
3️⃣ Advanced Features
🔹 Risk Management Suite
* Emergency exit controls (to strengthen protection against extraordinary market events)
* Customizable stop-loss system
* Trend-based exit management
* Position aging controls
* Liquidation protection features
* Advanced DCA controls
🔹 Performance Analytics
* Real-time position monitoring
* Comprehensive backtesting metrics
* DCA depth analysis
* Win rate calculations
* Capital efficiency tracking
🔹 Technical Optimizations
* Exchange minimum order adjustment
* Trading pair name override capability
* System stability controls
* Error handling mechanisms
🔹 Interface Customization
* Theme selection
* Chart overlay options
* Warning display preferences
* Performance metrics visibility
All settings come pre-configured but can be fully customized based on your trading preferences and risk tolerance. The script includes tooltips and setup guides for each option.
Note: While default settings may be tested, market conditions vary and all trading involves risk. Monitor performance and adjust settings according to your risk management requirements.
------------------------------
Frequently Asked Questions
------------------------------
Here are some common questions you may have, and our answers:
❓ Is this tool only for experts? I'm new to algo trading, can I use it?
No, the Altcoins DCA Scalper could be used by both beginners and experienced traders. The setup process is guided, and the algorithm handles all the calculations in the background.
❓ I'm not familiar with 3Commas. Is that a problem?
While the script is designed to work with 3Commas, a step-by-step guide is provided within the script to help you set up your 3Commas accounts and bots, if needed.
❓ Do I need to constantly monitor the script after it's set up?
No, after the initial setup and configuration, the script operates autonomously. It handles all aspects of trading including entries, exits, DCA management, and risk controls. However, we recommend:
* Checking performance metrics daily
* Reviewing position statistics weekly
* Adjusting pair selection monthly based on performance
* Monitoring overall market conditions that might require adjustments
❓ Can I use it with leverage?
Yes, the script is designed to work with leverage up to 5x on perpetual futures pairs (USDT.P). It includes specific features for leveraged trading:
* Dynamic safety order placement based on distance to liquidation
* Pre-liquidation exit system to minimize exchange fees
* Adjustable take-profit targets optimized for leveraged positions
* Emergency exit system for extreme market movements
* Optional risk controls specific to leverage:
* Automatic exit in the liquidation danger zone
* Position size scaling based on leverage level
* Safety order adjustments for different leverage settings
While leverage can amplify returns, it also increases risk. We recommend starting with lower leverage (2x), or no leverage at all, until familiar with the script's operation.
❓ Does this script guarantee profits?
No, no script or trading strategy can guarantee profits. The Altcoins DCA Scalper provides a framework for implementing an automated DCA strategy, but your success will depend on many different factors and conditions.
❓ Do I need to understand the complex algorithms used in the script?
No, it’s not necessary. The logic is handled by the script, and you do not need to understand every detail to use it effectively. However, a basic knowledge of DCA concepts will be beneficial.
❓ Can I use this script with spot or leveraged trades?
The script is optimized for USDT.P pairs (perpetual futures) with leverage up to 5x. This allows:
* Automatic long/short position management
* Increased capital utilization
* Full DCA functionality without holding the underlying assets
* Enhanced risk management features specific to futures
While spot trading is possible, it requires holding underlying assets for shorts and doesn't access the script's full capabilities.
❓What timeframe should I use?
This script is optimized for the 1-minute timeframe , which is the recommended setting for the best balance between performance, capital efficiency, and risk. While we recommend using the tool on the 1 minute TF, it would work on other timeframes too.
❓ What happens if my internet/computer goes down?
Since the script sends signals from Tradingview to 3Commas (which executes trades on your exchange), your positions and DCA management continue to function even if your TradingView chart is closed or your computer is off. The script only needs to be active to generate new signals.
❓ How are the DCA parameters determined?
The script dynamically adjusts DCA parameters based on:
* The pair's volatility class (compared to the overall altcoin market)
* Current market conditions and volatility
* Position direction (long/short)
* Leverage settings
* Number of safety orders already executed
This allows for adaptive/dynamic DCA compared to static or %-based parameters.
❓ What exchanges are supported?
The script works with any exchange supported by 3Commas for futures trading (approximately 15 different crypto Exchanges). However, it's optimized for Binance Futures (USDT.P pairs) due to its high liquidity and for consistency.
❓ What happens during extreme market conditions?
The script includes some (optional) protective measures that can be activated:
* Emergency exits during sharp and abnormal market moves
* Automatic adjustment of DCA parameters during high volatility
* Position closure on significant trend changes
* Special handling of aged positions
These features aim to protect capital during unusual market conditions.
❓How many pairs can I trade simultaneously?
This depends on your total capital. As a general indication, define the number of pairs to activate based on:
* Total available capital
* Desired position size per pair
* Risk tolerance
* Pairs' volatility class
------------------------------
Final Thoughts
------------------------------
We believe that your trading performance will greatly depend on your selection of appropriate trading pairs for this script (high volatility), and your commitment to regularly monitoring its performance and adjust the settings, rather than on the script alone.
------------------------------
⚠️ Risk Disclaimer
------------------------------
Remember that trading involves risk, and most day traders experience losses. This script is for educational and informational purposes only. Past performance does not guarantee future results. This is not financial advice, and you should always do your own research (DYOR). Trade responsibly with capital you can afford to lose.
The Altcoins DCA Scalper is an independent tool and is not endorsed, connected, or validated by TradingView.
3Commas is a third-party service, and TradingView is not responsible for the 3Commas integration or the performance of 3Commas bots. You are solely responsible for the security and management of your 3Commas account. Do not share your 3Commas access credentials (like login information, Bots-ID, Email Token) with anyone. The Author of the script has no access to such information, and nobody (but you) should.

Altcoins Screener [SwissAlgo]Introduction: The Altcoins Screener at a Glance
The Altcoins Screener is a cryptocurrency analysis tool designed to provide an overview of potential trading opportunities across multiple crypto coins/tokens and categories. By combining technical analysis, price action assessment, and social metrics (via LunarCrush data), it presents market information and trading signals for a broad range of altcoins (approx. 300 USDT.P pairs of 9 crypto categories).
The screener is designed to consolidate market information onto a single chart , aiming to streamline the analysis of market conditions. It provides a consolidated market overview, which can simplify the assessment of market conditions, compared to monitoring individual charts with several layered indicators.
Key Features:
🔹 Multi-category analysis covering 300 crypto pairs of 9 categories on a single chart (Layer 1 & Top Coins, Layer2 & Scaling, Defi & Landing, Gaming & Metaverse, AI & Data, Exchanges & Trading, NFT & Social, Memes & Community, Other, User's Custom Portfolio).
🔹 Technical analysis with trade signals (Long/Short) based on an aggregated view of technical and social data points
🔹 Social sentiment integration through LunarCrush metrics (GalaxyScore, AltRank, Social Sentiment)
🔹 Real-time market scanning provides automated alerts when market conditions for specified coins/tokens potentially change.
🔹 Custom watchlist support for personalized monitoring (users can define a custom category containing a set of specific cryptocurrencies, i.e. own portfolio).
The screener presents data in a table format, using color-coded indicators to aid visual analysis. Detailed technical information is also provided. The assessments/trade signals provided by this indicator should be considered as one input among many when forming your trading strategy.
--------------------------------------
What It Does
The Altcoins Screener is a cryptocurrency analysis tool that offers:
Data Display and Analysis (Technical/Social):
🔹 Technical Metrics
* Technical Raw Data : Displays raw values for a range of technical indicators, including RSI, Stochastic RSI, DMI/ADX, RVI, ATR, OBV, and Hull Moving Averages (including their recent trends and potential significance).
Detailed view of key technical indicators, for further analysis and evaluation:
* Technical Analysis (Summary) : Provides a summarized interpretation of technical conditions based on aggregated parameters:
* Price Action
* Trend
* Momentum
* Volatility
* Volume
Summarized view of confluences for potential long/short bias:
🔹 Social Metrics (LunarCrush) : Presents data from LunarCrush®, including Galaxy Score®, AltRank®, and Social Sentiment® (including their recent trends and potential significance).
Lunarcrush data for the top 10 coins for each crypto category:
🔹 PVSRA (Price Volume & Market Makers Activity) Candles : Shows special candles highlighting potential market maker activity and volume anomalies, helping identify possible manipulation zones (including imbalance zones, i.e. price areas that market makers may revisit)
--------------------------------------
Key Features:
Automated trade signals (Long/Short) are generated based on algorithmic calculations and signal confidence levels across technical and social data points. These signals are intended to be used as one component of a broader trading strategy.
Custom sensitivity settings allow users to adjust the analysis timeframe (options: 1D, 2D, or 1W). Higher timeframes may provide a broader perspective, while the 2D setting is the default configuration.
Multi-category analysis covering a selection of approximately 300 crypto pairs across 9 predefined crypto categories.
Custom symbol selection: Users can define a custom list of up to 10 symbols for focused monitoring.
Automated Alerts to track potential trend changes across crypto categories (Long to Short to Neutral, or vice versa)
Visual Interface:
Organized table display with color-coded indicators to aid interpretation.
Clear and efficient format for scanning market information.
--------------------------------------
Target Audience
🔹 The screener is designed for cryptocurrency traders who:
Need to efficiently monitor multiple USDT perpetual futures markets
Use technical analysis in their trading decisions
Want to track sector-wide movements across crypto categories
🔹 Suitable for different trading styles:
Scalpers requiring quick market assessment
Swing traders analyzing multi-day trends
Position traders monitoring longer-term setups
The color-coded interface makes it accessible for intermediate traders while providing detailed metrics for advanced users. A basic understanding of technical analysis and crypto trading is recommended.
--------------------------------------
How It Works
The Altcoins Screener evaluates cryptocurrencies through a multi-layered analysis:
🔹 Core Analysis Components
Each parameter combines multiple indicators for comprehensive evaluation:
Price Action
EMA crossovers and momentum
Support/resistance zones
Candlestick patterns
Trend
Hull Moving Average system
DMI/ADX trend strength
Multi-timeframe confirmation
Momentum
RSI/Stochastic RSI readings
MACD convergence/divergence
Oscillator confirmations
Volatility
RVI/ATR measurements
Bollinger Bands behavior
Historical volatility trends
Volume
OBV trend analysis
Volume/price correlations
Volume profile assessment
🔹 Signal Generation Process
1. Real-time data collection across timeframes
2. Weighted indicator calculations
3. Parameter aggregation and analysis
4. Signal strength determination
5. Color-coding and alert generation
--------------------------------------
How to Use
🔹 Initial Setup:
Add the indicator to a chart (use the 1D timeframe)
Select your preferred crypto category or create a custom list
Choose between Technical Analysis or Technical Metrics view
Set data sensitivity based on your trading style
🔹 Using the Technical Analysis View:
Monitor color-coded dots for quick market assessment
Green: bullish conditions
Red: bearish conditions
Gray: neutral conditions
Check the "Trade Signal" column for potential Long/Short entries signaled by confluences among technical and/or social data points
🔹 Using the Technical Metrics View:
Review detailed numerical values
Monitor slopes (↑↓ arrows) for the most recent trend direction of each data point
Watch for pivotal points (highlighted cells): these are data points that suggest potential trend reversals
Focus on the confluence of multiple indicators
The technical metrics view corroborates the conclusions shown in the Technical Analysis View, providing more details about some critical data points.
🔹 Alert Configuration:
Enable Technical Alerts for signal notifications (which coin/token seems most suited for Long or Short trades, and which coin/token is in a neutral/uncertain state for trading = "No Trade")
Configure alert conditions based on trading style
Set timeframe-appropriate sensitivity
Monitor alert messages for trade signals
Instructions on how to set alerts are provided in the script (enable "Signals Setup Instructions" in User Interface to get a step-by-step guide about setting up alerts)
Best Practices:
Confirm signals across multiple timeframes
Use appropriate sensitivity for your trading style
Monitor multiple categories for sector rotation
Combine signals with your trading strategy
Verify signals with price action confirmation and deep dive into the charts of your potential targets
--------------------------------------
About the Settings
🔹 Crypto Category Selection
Layer 1 & Major: Top market cap coins (BTC, ETH, XRP,...), established protocols
Layer 2 & Scaling: ETH L2s, scaling solutions
DeFi & Lending: Decentralized finance protocols
Gaming & Metaverse: Gaming and virtual world tokens
AI & Data: Artificial intelligence and data projects
Exchange & Trading: Exchange tokens, trading protocols
NFT & Social: NFT platforms, social tokens
Memes & Community: Community-driven tokens
Others & Misc: Other categories
Custom Category: User-defined list (up to 10 symbols)
Data Type Options
Technical Analysis: Color-coded summary view
Technical Metrics: Detailed numerical values of some key technical data points
Sensitivity Settings
Higher: Shorter timeframe, more frequent signals
Default: Balanced timeframe, standard signals
Lower: Longer timeframe, stronger signals
Alert Settings
Technical Alerts: Trade signal notifications
Data Timeframe: Minimum 1D required
Theme: Dark/Light mode options
Note: All analysis is performed on USDT Perpetual Futures pairs from Binance
--------------------------------------
FAQ
Q: Does the screener work on other exchanges besides Binance?
A: No, it's designed specifically for Binance USDT Perpetual Futures pairs. Binance offers the highest liquidity and trading volume in the crypto derivatives market, making it ideal for technical analysis. The extensive range of trading pairs and reliable data streams help ensure more accurate signals and analysis. Using a single high-liquidity exchange also helps avoid inconsistencies that could arise from aggregating data across multiple platforms with varying liquidity levels.
Q: What's the minimum timeframe required?
A: The screener requires a minimum 1D (daily) timeframe. This requirement ensures that the technical analysis has sufficient data points for reliable signal generation. Lower timeframes can produce more noise and false signals, while daily timeframes help filter out market noise and identify stronger trends.
Q: Why are some social metrics showing "NaN"?
A: "NaN" (Not a Number) appears when cryptocurrencies don't have associated LunarCrush data. This typically occurs with newer tokens or those with lower market caps. The technical analysis remains fully functional regardless of social metric availability, as these are complementary data points.
Q: How often are signals updated?
A: Signals update with each new candle on the selected timeframe (1D, 2D, or 1W). For example, on the default 2D setting, signals are recalculated every two days as new candles form. This helps reduce noise while maintaining timely analysis of market conditions.
Q: Can I add spot trading pairs?
A: No, the screener is optimized for Binance USDT perpetual futures pairs for data consistency and analysis purposes. While spot and perpetual prices typically align closely due to arbitrage, using a single data source (Binance) and contract type (USDT perpetual) ensures uniform data quality and analysis across all pairs. This standardization helps maintain reliable technical analysis and signal generation.
Q: How many coins can I add to my custom list?
A: Users can add up to 10 custom symbols to their watchlist. This limit is designed to maintain optimal performance while allowing focused monitoring of specific assets. The custom list complements the predefined categories that cover over 300 pairs.
Q: What determines signal confidence levels?
A: Signal confidence is calculated through a weighted algorithm that considers multiple factors: trend strength (Hull MA, DMI/ADX), momentum indicators (RSI, SRSI), volatility measurements (RVI, ATR, BB), volume analysis (OBV, volume trends), and price action patterns. Higher confidence levels indicate stronger alignment across these factors.
Q: Are signals guaranteed to work?
A: No. Signals are analytical tools based on historical and current market data, not guaranteed predictions. They should be used as one component of a comprehensive trading strategy that includes proper risk management, position sizing, and additional confirmation factors. Past performance does not guarantee future results.
Q: Why does the screener need higher timeframes?
A: Higher timeframes (1D minimum) provide several benefits: reduced market noise, more reliable technical signals, better trend identification, and lower likelihood of false signals. They also align better with institutional trading patterns and allow for a more thorough analysis of market conditions across multiple indicators.
--------------------------------------
Conclusion
The Altcoins Screener is a comprehensive crypto market analysis tool that:
Scans 300+ cryptocurrencies across 9 sectors on a single chart
Combines technical indicators and social metrics for signal generation
Identifies potential trading opportunities through color-coded visuals
Saves time by eliminating the need to monitor multiple charts
The tool is suited for:
Market overview and sector rotation analysis
Quick assessment of market conditions
Technical and social sentiment tracking
Systematic trading approach with alerts
Use this screener with caution and as a complement to any other tool you use to define your trading strategy.
--------------------------------------
Disclaimer
This indicator is for informational and educational purposes only:
Not financial advice: This indicator should not be considered investment advice.
No guarantee of accuracy: The indicator's calculations and signals are based on specific algorithms and data sources, but accuracy cannot be guaranteed. Market conditions can change rapidly.
Past performance is not predictive: Past performance of the indicator's signals or any specific asset is not indicative of future results.
Substantial risk of loss: Trading cryptocurrencies involves a substantial risk of loss. You can lose money trading these assets.
User responsibility: Users are solely responsible for their own trading decisions and should exercise caution.
Independent research required: Always conduct thorough independent research (DYOR) before making any trading decisions.
Technical analysis is one of many tools: Technical analysis, including the output of this indicator, is just one tool among many and should not be relied upon exclusively.
Risk management is essential: Use proper risk management techniques, including position sizing and stop-loss orders.
Comprehensive strategy: Use this tool as part of a comprehensive trading strategy, not as a standalone solution.
No liability for trading results: The Author assumes no responsibility or liability for any trading results or losses incurred as a result of using this indicator.
No TradingView affiliation: SwissAlgo is an independent entity and is not affiliated with or endorsed by TradingView.
LunarCrush data: The indicator utilizes publicly available data from LunarCrush. LunarCrush data and trademarks are the property of LunarCrush.
Consult a financial advisor: Consult with a qualified financial advisor before making any investment decisions.
By using this indicator, you acknowledge and agree to these terms. If you do not agree with these terms, please refrain from using this indicator.

skX FVG Enhanced Indicator [1m,5m] skX FVG Indicator
Fair Value Gaps (FVGs) are particularly effective for scalping altcoins due to their tendency to fill price inefficiencies. These gaps occur during strong momentum moves where price leaves an 'empty' zone that often acts as a magnet for price to return to. In the volatile alt market, these gaps frequently present high-probability scalping opportunities.
Why FVGs Work in Alts:
• Quick price movements create more gaps
• Higher volatility increases gap frequency
• Institutional algorithms tend to fill these inefficiencies
• Works especially well in lower timeframes (1-5m)
Key Features:
✓ Automatic FVG detection with size filtering
✓ Smart timeframe adaptation (1m, 5m, Custom settings)
✓ Trend detection using 8/21/55 EMA system
✓ Dynamic TP/SL levels based on ATR
✓ Risk:Reward ratio automation
✓ Visual signals that stick to price levels
✓ Clear information display panel
✓ Built-in alerts system
How to Use:
1. Select your preferred timeframe (1m or 5m recommended)
2. Watch for triangle signals (▲ bullish, ▼ bearish)
3. Confirm with trend direction (shown in panel)
4. Use provided TP/SL levels for trade management
5. Set alerts for new FVG formations
Settings Explained:
• Auto Mode: Adjusts gap size to timeframe
• Custom Gap Size: Manual gap size control
• ATR Period: Volatility measurement window
• ATR Multiplier: Stop loss distance
• Risk:Reward: Take profit ratio
Best Practices:
• Use in conjunction with support/resistance
• Trade in direction of main trend
• Monitor higher timeframe structure
• Start with recommended settings
• Backtest before live trading
Note: This indicator works best in volatile market conditions and should be used as part of a complete trading strategy.
Good luck trading!
-skX

skX_ALT_EMAs Enhanced [1H]An advanced EMA crossover system with dynamic ATR-based risk management, designed
for altcoin trading on the 1H timeframe. Combines trend following with momentum
and volume filters.
CORE COMPONENTS:
1. EMA System:
- 8 EMA (Fast): Primary signal line
- 21 EMA (Medium): Crossover reference
- 55 EMA (Slow): Trend filter
2. Multiple Filters:
- RSI (14): Prevents overbought/oversold entries
- Volume: Optional volume confirmation
- Trend Strength: EMA alignment check
3. Risk Management:
- Dynamic SL: Based on ATR (Average True Range)
- Dynamic TP: Risk:Reward based calculation
- Position entry markers
ENTRY CONDITIONS:
LONG:
- 8 EMA crosses above 21 EMA
- All EMAs aligned bullish (8 > 21 > 55)
- Price above 8 EMA
- RSI below 70 (not overbought)
- Optional: Volume > 1.5x average
SHORT:
- 8 EMA crosses below 21 EMA
- All EMAs aligned bearish (8 < 21 < 55)
- Price below 8 EMA
- RSI above 30 (not oversold)
- Optional: Volume > 1.5x average
RECOMMENDED SETTINGS:
- Timeframe: 1H
- ATR Period: 14
- ATR Multiplier: 1.5
- Risk:Reward: 2.0
- RSI Filter: ON
- Volume Filter: Optional (ON for low liquidity pairs)
VISUAL SIGNALS:
- Green Triangle: Long entry
- Red Triangle: Short entry
- Blue Line: Entry price
- Red Line: Stop Loss
- Green Line: Take Profit
- EMA Colors: Blue/Red for trend direction
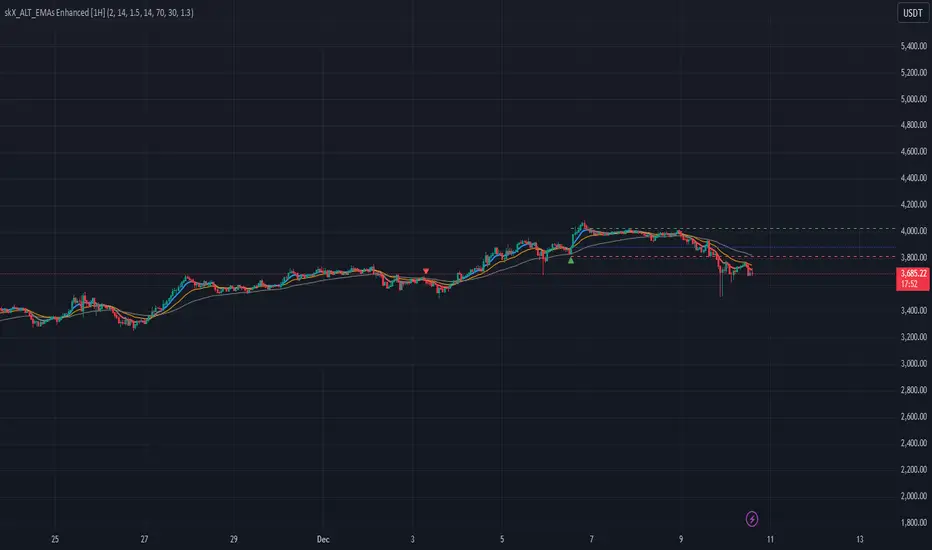
TOP 20 ALTCOIN INDEXIndicator Description
The "ALT20 INDEX" is a financial analysis tool designed to track the aggregate value of the top 20 cryptocurrencies by market capitalization and closing prices over specific periods. This indicator reflects changes in the combined value of these 20 ALTCOINs, providing an overview of trends in the cryptocurrency market.
=================================
Purpose and Practical Applications
1. Tracking Top Cryptocurrencies:
- The indicator allows monitoring the value of the top 20 ALTCOINs, reflecting the general volatility of the cryptocurrency market.
- Helps investors focus on high-capitalization assets.
2. Performance Comparison:
- Serves as a tool to compare the performance of the ALT20 group against other assets like Bitcoin, Ethereum, or traditional financial indices.
3. Assessing Market Health:
- Enables evaluation of market trends, identifying growth or decline periods.
4. Practical Applications:
- Suitable for fund managers, long-term investors, or trend traders to make decisions based on the overall ALTCOIN market performance.
-------------------------------------------
How the Indicator Works
1. Selection of Top 20 ALTCOINs:
- Cryptocurrencies are selected based on their market capitalization at each rebalancing period.
2. Weight Allocation and Calculation:
- Weight: Determined by the market capitalization of each ALTCOIN relative to the total market capitalization of the top 20.
- Token Quantity: Calculated based on weight, total allocation points (e.g., 100 points for T1, 722.63 points for T2, etc.), and each ALTCOIN's closing price.
Formula: Token Quantity = Weight × Total Allocation Points/Closing Price
3. Periodic Rebalancing:
- Rebalancing frequency: Once a year.
- At each rebalancing period, the weights and token quantities are adjusted based on new market capitalization and prices.
4. Portfolio Value Calculation:
- The value of each ALTCOIN is calculated as:
Token Value = Closing Price × Token Quantity
- Index Total: ALT20 Index = 20∑'i=1'Token Value'i'
------------------------------------------
Rebalancing Periods
T1 (2020-2021): Initial period, token quantities calculated based on weights and a total of 100 points.
T2 (2021-2022): Rebalanced with a total allocation of 722.63 points.
T3 (2022-2023): Total allocation of 252.26 points, reflecting portfolio adjustments based on new prices and market caps.
T4 (2023-2024): Total allocation of 261.43 points.
T5 (2024-Present): Total allocation of 437.42 points, updated to reflect the current market.
-----------------------------------------
Indicator Features
- Displays Index Value Over Time:
+ index_value_T1 to index_value_T5 represent the portfolio value during specific timeframes.
+ Values are calculated based on the daily closing prices of ALTCOINs.
- Visualization:
+ The index for each period is plotted on the chart, enabling easy observation of market trends over time.
---------------------------------------
Practical Applications
- Portfolio Management:
+ The indicator helps track the performance of asset groups within the ALTCOIN portfolio.
- Integration into Trading Systems:
+ Used as a reference for automated or manual trading strategies.
- Market Analysis:
+ Assists analysts in evaluating cryptocurrency market movements based on the top 20 ALTCOINs.
Let me know if further optimization or additional information is needed! Thank!
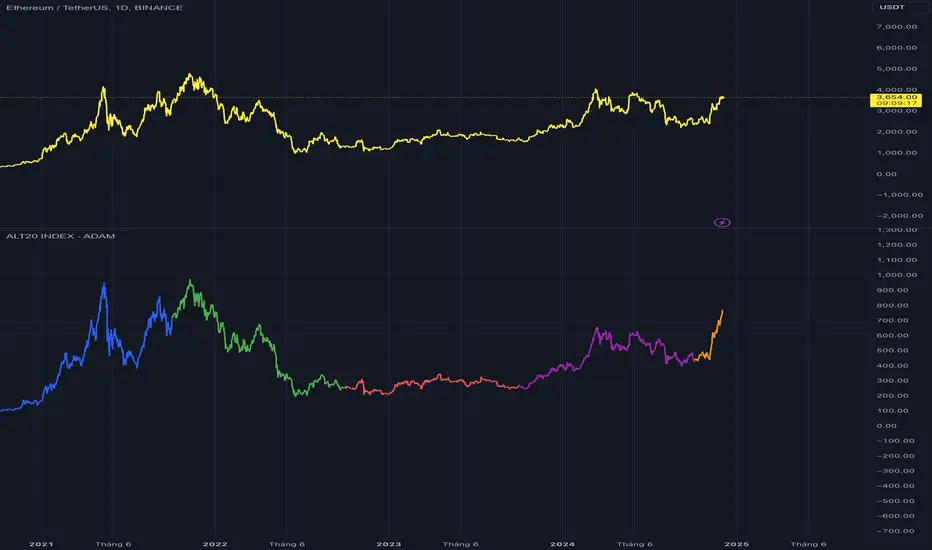
Altcoin Season Index - AdamThe "Altcoin Season Index" is a powerful tool for understanding market dynamics between Bitcoin and altcoins. This indicator helps traders identify whether the market is favoring Bitcoin or if it has shifted to favor altcoins. Understanding this can be crucial for making informed decisions about allocating your investments within the crypto market.
Overview of the Altcoin Season Index
The Altcoin Season Index calculates how well the top 10 altcoins are performing compared to Bitcoin over a given period. It helps traders determine if they are currently in an "Altcoin Season" or a "Bitcoin Season." The indicator gives a score from 0 to 100, representing the percentage of altcoins outperforming Bitcoin over a specific time window. When many altcoins are performing better than Bitcoin, it suggests a possible "Altcoin Season," whereas the opposite may indicate a period of Bitcoin dominance.
Key Features:
1. Top 10 Altcoin Performance Comparison: The indicator evaluates the performance of the top 10 altcoins compared to Bitcoin. It provides a clear view of how well altcoins are doing relative to the market leader, Bitcoin.
2. Customizable Performance Period: The period of analysis is adjustable, allowing users to set a specific timeframe, typically in days, to evaluate the relative performance of altcoins versus Bitcoin.
3. Dynamic Replacement of Altcoins: The indicator includes a feature to replace the last coin in the list, ensuring that the data stays relevant as market conditions change. For example, when a new altcoin enters the top 10 in terms of market cap, the indicator can replace an older coin that is falling out of the top ranks.
4. Threshold Indicators: The indicator uses predefined thresholds to determine and visualize whether it is an "Altcoin Season" or a "Bitcoin Season":
- A value above 75 indicates an Altcoin Season, suggesting that altcoins are outperforming Bitcoin.
- A value below 25 suggests Bitcoin dominance, where Bitcoin is outperforming the majority of altcoins.
How the Indicator Works:
1. Performance Calculation: The indicator calculates the percentage change in price for each of the top 10 altcoins and Bitcoin over a given number of days. The comparison is made by looking at how much each asset's price has changed over the specified period.
2. Altcoin Season Calculation: The indicator counts the number of altcoins that have outperformed Bitcoin during the given period. The result is then expressed as a percentage, known as the Altcoin Season Index. If 8 out of 10 altcoins are outperforming Bitcoin, the index will be 80%, signaling a strong altcoin season.
3. Visual Representation: The indicator is visualized on a separate panel within TradingView, showing the Altcoin Season Index over time. Additionally, thresholds are marked on the chart, and background colors are applied to provide visual cues:
- Red Background: When the Altcoin Season Index is above 75, indicating a strong altcoin season.
- Blue Background: When the Altcoin Season Index is below 25, indicating Bitcoin dominance.
Practical Use:
- Identify Market Cycles: Traders can use this indicator to identify when the market is moving into or out of an altcoin season. This can help traders decide whether to rotate capital into altcoins or Bitcoin.
- Investment Strategy Adjustment: During altcoin seasons, altcoins tend to outperform Bitcoin. Traders might allocate more of their portfolio to promising altcoins. Conversely, during Bitcoin-dominant periods, shifting investments towards Bitcoin could provide more stability.
- Support Technical Analysis: This indicator complements other forms of technical analysis by providing macro-level insights about market direction and which asset classes might be favored.
Example Usage:
Imagine that the Altcoin Season Index is currently at 80%. This means that 8 of the top 10 altcoins have performed better than Bitcoin over the selected period. This strong altcoin performance suggests that the market has entered an "Altcoin Season." A trader observing this might consider reallocating funds towards altcoins to capitalize on the positive momentum.
Alternatively, if the index is at 20%, only 2 out of the top 10 altcoins are outperforming Bitcoin, indicating that Bitcoin is currently the stronger player. In this scenario, traders may choose to prioritize Bitcoin or maintain a more conservative portfolio allocation.
Note:
This indicator includes a feature to replace the bottom-ranked altcoin (typically a coin that falls out of the top 10) with a new altcoin when market conditions change. This ensures that the analysis remains relevant by focusing on the top-performing assets by market capitalization.
Conclusion:
The Altcoin Season Index is a helpful tool for understanding broader trends in the cryptocurrency market and making strategic investment decisions. By monitoring which assets are performing better, traders can adapt their strategies and make more informed choices, particularly during shifts in market sentiment.
Please leave your feedback or contributions if there are any inaccuracies in my indicator. Thank you!