RedK Trader Pressure Index (TPX v1.0) Quick Summary
---------------------
The RedK Trader Pressure Index (REDK_TPX) analyzes the changes in price bars to give the trader a clear visual insight that represents the ongoing fight between the bulls (buyers) and bears (sellers) in the market - to determine who is in control of the price action, which in turn can be helpful in a trader’s decision about how the price action may be unfolding, what type of trade and positions to take (or to close) and when is the ideal time to action.
How the TPX calculation works
---------------------------------------
The TPX uses a simple logic and that’s one of the things I like about it – there is no complex calculation or magic stuff - and the core idea makes sense to me, as well as being one of the ways I needed to analyze my price charts.
The underlying assumption is that the buyers and sellers are competing for control of the market at all time.
- if there’s more buyers than sellers in the market, and if the buyers’ (or bull) pressure is stronger (than the sellers’), they will be able pull the “price range” up – and that means that on the price chart we can expect to see an increase in value in both the “high” and the “low” of the next price bar.
- Similarly, if there’s more sellers than buyers in the market, and if the sellers’ (or bear) pressure is stronger (than the buyers’), they will be able push the “price range” down – on the price chart we can expect to see a decrease in value in both the “high” and the “low” of the next price bar.
So, we will use the change in high and low price, between 2 consecutive price bars, as a proxy for the bull and bear “pressures” – a (weighted) moving average of these “pressure” values are then calculated along with the “Net Pressure” – the final results are plotted.
The importance of the "Control Level"
-----------------------------------------------
As in similar price-action based indicators, there’s a certain threshold or “control level”, above which, the pressure becomes “dominant”
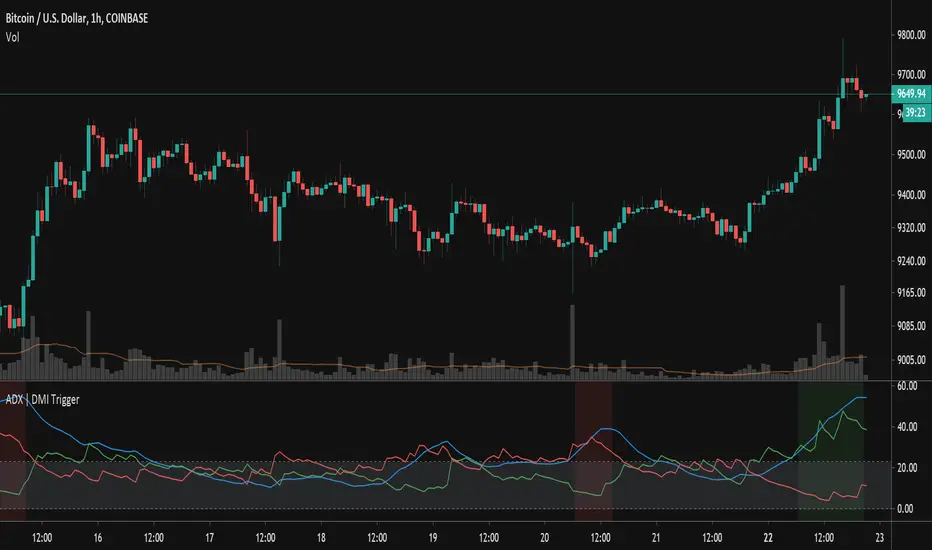
when the bull or bear pressure is above that threshold, they will dominate and control the price move – this level can be found around the 25 or 30. I have included the ability to plot and adjust that control level in the TPX’s settings – and I also show some examples in the chart above (weekly chart for MSFT)
The code is commented and the chart is annotated to explain how to “read” the TPX – and how to interpret the values on the price chart
Using the Trader Pressure Index (TPX) in trading
------------------------------------------------------------
TPX can be valuable in showing well-supported (up or down) price moves that may lead to a strong trend that we can ride (when the pressure value is above the control level) - see exampled above
TPX is also valuable in showing when there’s “lack of interest” from the buyers or the sellers (or both) – which is great in exploring chub or no-trade zones - so basically when to avoid trading.
As usual, it's always recommended to use these types of "price action insight" indicators in conjunction with other trend and momentum indicators (moving averages, MACD..etc), so the insight we gain from them can be properly placed within the broader "context" - and to receive additional confimtion signals to support the trading decision.
I will come back later to post something about how the TPX differs from my recently-posted Strength of Movement (SoM) because they wok completely differently but can be used together with great synergy – and also how the TPX compares to the classic DMI/ADX which uses a similar concept.
Please feel free to integrate in your trading – hope you find this useful - comments and feedback are always welcome
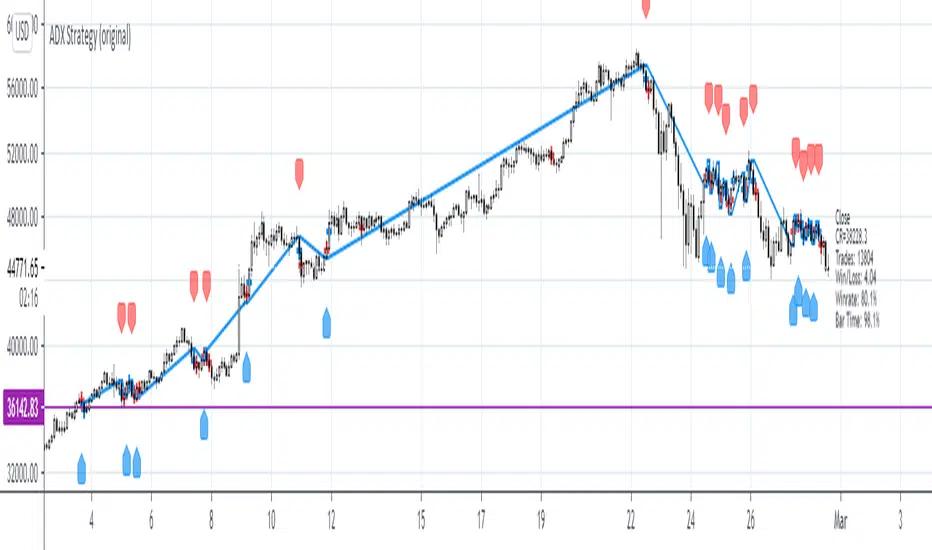
ADX

ADX Strategy (original)ADX Strategy
Description:
Generates a long entry signal when the Average Directional Index (ADX) value is greater than the trendlevel and the close is greater than the filter value, and/or generates a short entry signal when the ADX value is greater than the trendlevel and the close is less than the filter value.
The Average Directional Index evaluates the strength of a current trend. The ADX is an oscillator that fluctuates between 0 and 100. Values below 20 indicate a weak trend, values above 40 indicate a strong trend. The direction of the trend is not measured by this indicator.
As usual, the script features signal filtering/generation and a rough estimate of its performance.
MrBS:Directional Movement Index [Trend Friend]I started this project with the goal of making a DMI/ADX that was easy to read at a glance. Its since become a little more then just colouring the slopes. The majority of the time, the best returns come from trending markets (THE TREND IS YOUR FRIEND... until the end) and I hope this helps people become good friends with the trends.
----- Features
- A function to change the values used for calculation from real OHLC and Heikin Ashi. This allows us to look at different chart types but see the specific ADX we choose. Originally HA values were used for calculation since it is easier to see trend on HA charts. However when testing it was not as effective as the ADX calculated from the real values on normal charts. So the default function was flipped and real OHLC values are used as default.
- Two ADX plots so we can see two different smoothness's. With a smoothing of 2, a slight slow down in PA can cause a negative slope but the smoother ADX will stay trending unless its a major change. 2nd ADX is slightly transparent.
- There is an EMA of the main ADX that can be used as a exit signal filter. If the ADX starts going down but has not crossed the EMA we would stay in a trade.
- Plots (excluding EMA) are coloured based on positive or negative slopes.
- Fibonacci numbers have been used to create different trend levels, instead of the standard 25, 50, 100.
- Alerts for every useful situation to help save time and not have to manually enter levels or crosses each time.
- In the code there are 8 EMAs and 3 ADXs but it was too much so they have been slashed out, but are fully functional if you choose to activate and use them. To reactivate the 3rd ADX delete slashes on lines 50, 65, 78, 92-95, 165. The slashed out EMAs are much more obvious and easy to reactivate.
Colours:
ADX going up = Green
ADX going down = Red
DMI+ going up = Bright Aqua
DMI+ going down = Turquoise / Dark Aqua
DMI- going up = Bright Purple
DMI- going down = Dark Purple
EMA = White (50% transparent)
If there is anything that would be useful, let me know and I will add it in. I've already got some improvements/changes planned and some of my notes can be found in the code.
There is also a strategy to go with this indicator that will be uploaded very soon.

Trend Trader Buy/Sell SignalsTrend Trader
The code is open source, what it uses to print signals is MACD cross and ADX. Bar colors change in relation to where price is according to the 50 day MA. The MA ribbon is used for visualizing trend and using it for dynamic support/resistance. The ribbon is comprised of the 50 day and 100 day MAs.
Main reason to publish this script is because some like to jumble up scripts together slap some moving averages on it to "follow trend" and then label it an algorithm, market it and sell it to people online. No single system will work 100% of the time, do you due diligence in anything you are interested in buying. Plenty of free scripts in the TV library that can do you justice when trading.

Crypto Directional Movement Index DMI/ADXCrypto ADX + DMI
This indicator is a customised version of the ADX + DMI by J. Welles Wilder in 1978, with default settings optimal for cryptocurrencies.
What is the DMI (ADX) Indicator?
According to Investopedia:
DMI (ADX) consists of three indicators that measure a trend’s strength and direction. Three lines compose the Direction Movement Index (DMI): ADX (black line), DI+ (green line), and DI- (red line). The Average Directional Index (ADX) line shows the strength of the trend. The higher the ADX value, the stronger the trend. The color of the lines can be altered, but black, green, and red are the default in most software.
The Plus Direction Indicator (DI+) and Minus Direction Indicator (DI-) show the current price direction. When the DI+ is above DI-, the current price momentum is up. When the DI- is above DI+, the current price momentum is down.
This Version
The ADX default value has been changed to from 14 to 2 (optimal for cryptocurrencies). The background flashes red when the –DMI goes above the HZ1 threshold and green when the +DMI does the same. There is an option to change it so that it’ll only flash when the ADX and the DMI are both above the threshold. The ADX changes color when above HZ1.
Red and green plotshapes appear at DMI crossovers and three horizontal lines have also been added.
Any suggestions are most welcome

Excellent ADXThe Average Directional movement indeX (ADX) is an indicator that helps you determine the trend direction, pivot points, and much more else! But it looks not so easy as other famous indicators. It seems strange or even terrible, but don't be afraid. Let's understand how it works and get its power into your analysis tactics.
In the beginning, imagine a drunk man goes through a ladder: step by step. Up, up, down, up, down, down, up...
How can we understand which direction he goes? Exactly! We can count the number of steps in each direction. In the above example, in the upward – 4, in the downward – 3. So, it looks like he goes in an upward direction.
The ADX indicator counts the same steps, but for price. The size of each step equals 1 ATR for "DI Length" candles. On the indicator chart, we have the green and red lines. The green line represents a number of steps upward. The red line shows one downward. When the red line upper green, then the price goes below, then the trend is directed down. Later the green line comes above the red one, and then the trend changes the direction to upward. Wow? After that, you can easy detect the trend direction on the market!
But it is still not the end. On the chart, we also have the fat blue line. This is the ADX line, and it represents the power of the trend. It is calculated from a distance between the green and red curves. The ADX line value grows if the distance is increased. If the movement is really powerful, then a number of steps into a direction much more prominent than one in an opposed direction. Then the blue line grows faster. But if the growth has stopped and the blue line turns back or already had changed self-direction, then it is a signal that the trend has ended too. It's an excellent sign to close the position (but not always). Easy? Not quite. Thresholds help you there. The indicator has two additional parameters: upper and lower thresholds to evaluate the trend-over signal strength. An u-turn of the ADX line above the upper threshold sends a strong signal. If one occurs between both thresholds, it is a bit weak signal. But if the blue line goes below the lower threshold, it looks like there is no trend, and the price goes side. We can also say that the price goes side when the ADX value gradually falls down.
The Excellent ADX indicator helps you catch pivot/pullback signals based on green, red, and blue lines. Each such signal is highlighted as a green (buy) or red (sell) dot on the plot. The size of the dot represents the strength of the signal. You can also check the position of green and red lines from each other to determine the trend direction and the place where it has been changed. The Excellent ADX indicator helps you there too. It highlights the trend direction by the background-color, so you'll never miss it! The Excellent ADX good compliance with the Price Channel indicator built for the same length. You can use them together to be on a trend wave always!

888 BOT #alerts█ 888 BOT #alerts (open source)
This is an Expert Advisor 'EA' or Automated trading script for ‘longs’ and ‘shorts’, which uses only a Take Profit or, in the worst case, a Stop Loss to close the trade.
It's a much improved version of the previous ‘Repanocha’. It doesn`t use 'Trailing Stop' or 'security ()' functions (although using a security function doesn`t mean that the script repaints) and all signals are confirmed, therefore the script doesn`t repaint in alert mode and is accurate in backtest mode.
Apart from the previous indicators, some more and other functions have been added for Stop-Loss, re-entry and leverage.
It uses 8 indicators, (many of you already know what they are, but in case there is someone new), these are the following:
1. Jurik Moving Average
It's a moving average created by Mark Jurik for professionals which eliminates the 'lag' or delay of the signal. It's better than other moving averages like EMA , DEMA , AMA or T3.
There are two ways to decrease noise using JMA . Increasing the 'LENGTH' parameter will cause JMA to move more slowly and therefore reduce noise at the expense of adding 'lag'
The 'JMA LENGTH', 'PHASE' and 'POWER' parameters offer a way to select the optimal balance between 'lag' and over boost.
Green: Bullish , Red: Bearish .
2. Range filter
Created by Donovan Wall, its function is to filter or eliminate noise and to better determine the price trend in the short term.
First, a uniform average price range 'SAMPLING PERIOD' is calculated for the filter base and multiplied by a specific quantity 'RANGE MULTIPLIER'.
The filter is then calculated by adjusting price movements that do not exceed the specified range.
Finally, the target ranges are plotted to show the prices that will trigger the filter movement.
Green: Bullish , Red: Bearish .
3. Average Directional Index ( ADX Classic) and ( ADX Masanakamura)
It's an indicator designed by Welles Wilder to measure the strength and direction of the market trend. The price movement is strong when the ADX has a positive slope and is above a certain minimum level 'ADX THRESHOLD' and for a given period 'ADX LENGTH'.
The green color of the bars indicates that the trend is bullish and that the ADX is above the level established by the threshold.
The red color of the bars indicates that the trend is down and that the ADX is above the threshold level.
The orange color of the bars indicates that the price is not strong and will surely lateralize.
You can choose between the classic option and the one created by a certain 'Masanakamura'. The main difference between the two is that in the first it uses RMA () and in the second SMA () in its calculation.
4. Parabolic SAR
This indicator, also created by Welles Wilder, places points that help define a trend. The Parabolic SAR can follow the price above or below, the peculiarity that it offers is that when the price touches the indicator, it jumps to the other side of the price (if the Parabolic SAR was below the price it jumps up and vice versa) to a distance predetermined by the indicator. At this time the indicator continues to follow the price, reducing the distance with each candle until it is finally touched again by the price and the process starts again. This procedure explains the name of the indicator: the Parabolic SAR follows the price generating a characteristic parabolic shape, when the price touches it, stops and turns ( SAR is the acronym for 'stop and reverse'), giving rise to a new cycle. When the points are below the price, the trend is up, while the points above the price indicate a downward trend.
5. RSI with Volume
This indicator was created by LazyBear from the popular RSI .
The RSI is an oscillator-type indicator used in technical analysis and also created by Welles Wilder that shows the strength of the price by comparing individual movements up or down in successive closing prices.
LazyBear added a volume parameter that makes it more accurate to the market movement.
A good way to use RSI is by considering the 50 'RSI CENTER LINE' centerline. When the oscillator is above, the trend is bullish and when it is below, the trend is bearish .
6. Moving Average Convergence Divergence ( MACD ) and ( MAC-Z )
It was created by Gerald Appel. Subsequently, the histogram was added to anticipate the crossing of MA. Broadly speaking, we can say that the MACD is an oscillator consisting of two moving averages that rotate around the zero line. The MACD line is the difference between a short moving average 'MACD FAST MA LENGTH' and a long moving average 'MACD SLOW MA LENGTH'. It's an indicator that allows us to have a reference on the trend of the asset on which it is operating, thus generating market entry and exit signals.
We can talk about a bull market when the MACD histogram is above the zero line, along with the signal line, while we are talking about a bear market when the MACD histogram is below the zero line.
There is the option of using the MAC-Z indicator created by LazyBear, which according to its author is more effective, by using the parameter VWAP ( volume weighted average price ) 'Z-VWAP LENGTH' together with a standard deviation 'STDEV LENGTH' in its calculation.
7. Volume Condition
Volume indicates the number of participants in this war between bulls and bears, the more volume the more likely the price will move in favor of the trend. A low trading volume indicates a lower number of participants and interest in the instrument in question. Low volumes may reveal weakness behind a price movement.
With this condition, those signals whose volume is less than the volume SMA for a period 'SMA VOLUME LENGTH' multiplied by a factor 'VOLUME FACTOR' are filtered. In addition, it determines the leverage used, the more volume , the more participants, the more probability that the price will move in our favor, that is, we can use more leverage. The leverage in this script is determined by how many times the volume is above the SMA line.
The maximum leverage is 8.
8. Bollinger Bands
This indicator was created by John Bollinger and consists of three bands that are drawn superimposed on the price evolution graph.
The central band is a moving average, normally a simple moving average calculated with 20 periods is used. ('BB LENGTH' Number of periods of the moving average)
The upper band is calculated by adding the value of the simple moving average X times the standard deviation of the moving average. ('BB MULTIPLIER' Number of times the standard deviation of the moving average)
The lower band is calculated by subtracting the simple moving average X times the standard deviation of the moving average.
the band between the upper and lower bands contains, statistically, almost 90% of the possible price variations, which means that any movement of the price outside the bands has special relevance.
In practical terms, Bollinger bands behave as if they were an elastic band so that, if the price touches them, it has a high probability of bouncing.
Sometimes, after the entry order is filled, the price is returned to the opposite side. If price touch the Bollinger band in the same previous conditions, another order is filled in the same direction of the position to improve the average entry price, (% MINIMUM BETTER PRICE ': Minimum price for the re-entry to be executed and that is better than the price of the previous position in a given %) in this way we give the trade a chance that the Take Profit is executed before. The downside is that the position is doubled in size. 'ACTIVATE DIVIDE TP': Divide the size of the TP in half. More probability of the trade closing but less profit.
█ STOP LOSS and RISK MANAGEMENT.
A good risk management is what can make your equity go up or be liquidated.
The % risk is the percentage of our capital that we are willing to lose by operation. This is recommended to be between 1-5%.
% Risk: (% Stop Loss x % Equity per trade x Leverage) / 100
First the strategy is calculated with Stop Loss, then the risk per operation is determined and from there, the amount per operation is calculated and not vice versa.
In this script you can use a normal Stop Loss or one according to the ATR. Also activate the option to trigger it earlier if the risk percentage is reached. '% RISK ALLOWED' wich is calculated according with: '%EQUITY ON EACH ENTRY'. Only works with Stop Loss on 'NORMAL' or 'BOTH' mode.
'STOP LOSS CONFIRMED': The Stop Loss is only activated if the closing of the previous bar is in the loss limit condition. It's useful to prevent the SL from triggering when they do a ‘pump’ to sweep Stops and then return the price to the previous state.
█ ALERTS
There is an alert for each leverage, therefore a maximum of 8 alerts can be set for 'long' and 8 for 'short', plus an alert to close the trade with Take Profit or Stop Loss in market mode. You can also place Take Profit limit and Stop Loss limit orders a few seconds after filling the position entry order.
- 'MAXIMUM LEVERAGE': It is the maximum allowed multiplier of the % quantity entered on each entry for 1X according to the volume condition.
- 'ADVANCE ALERTS': There is always a time delay from when the alert is triggered until it reaches the exchange and can be between 1-15 seconds. With this parameter, you can advance the alert by the necessary seconds to activate it earlier. In this way it can be synchronized with the exchange so that the execution time of the entry order to the position coincides with the opening of the bar.
The settings are for Bitcoin at Binance Futures (BTC: USDTPERP) in 15 minutes.
For other pairs and other timeframes, the settings have to be adjusted again. And within a month, the settings will be different because we all know the market and the trend are changing.

DMI-ADX HistogramThe Average Direction Index (ADX) coupled with the Direction Movement Index (DMI), developed by J. Welles Wilder, is a popular indicator that measures trend direction and strength.
The AX line (blue) is used to show the strength of the current trend. It does not tell you the trend direction. The under laid histogram shows relative movements of the price with green showing positive momentum and red showing negative momentum. Use these ADX and DMI together to find trend strength and direction.
- ADX line below 20 indicates that the underlying is in accumulation/distribution.
- ADX line above 20 mean that the underlying is trending with over 60 being very strong.
*When the ADX line is below 20 it is likely to see many reversal signals on the DMI Histogram. It is best to use the DMI signals when the ADX line is above 20 or higher. This is also a good level to play around with.
Motivation
Normally the direction movements are plotted as lines with the DI+ being green and the DI- being red. When the DI+ (green) crosses over DI- (red) this may indicate a buy signal, and vice versa. I found this visual representation made it difficult to see signals as well as lacked the ability to easy see the relative strength of other moves.
I have also noticed that the histogram values will periodically cross the ADX line, but not for very long periods. This could be a useful signal to explore further in the future.
In this image the top indicator is using the normal DI+/- lines, where the bottom indicator is using an absolute histogram.

Support and Resistance levels - DMI - DI trailing stop linesThis can be used to compliment the Directional Movement Index if used as a standalone trading system. In addition to using the ADX and DI lines, a trailing stop can be used when the DI lines cross. If the plus line is above to show a buy signal, then the low of the price of when which the cross took place is used as a trailing stop. If the minus line is above to show a sell signal, then the high of the price of when which the cross took place is used as a trailing stop. This helps cut losses sooner whenever the price would end up going through these trailing stops or support/resistance levels yet the DMI system would show an upward or downward move.
ADX Histogram with DI linesInspired by the user scarf from Tradingview. In contrast with that other indicator, this one instead of a simple moving average (SMA) for the ADX calculations, uses a running moving average (RMA) or also known as Wilder's Average. I like having a histogram for the DI lines over just having lines alone because it makes it easier to see. In addition I made it so that values less than 5 for the DI lines are colored lightly to note that the movement was less significant(might not matter but some might care about it, atleast I do). The ADX has a color fainting effect too, and when it goes above the threshold then it becomes black to note that it is trending, as the indicator suggests.
The advantages with these additions and changes are that it shows a more traditional moving average like the original author Wellers Wilder suggested and you can see the crossings and directional movement changes easier from seeing the colors on the histogram easier than you would by looking at the DI lines alone. The disadvantages are you won't be able to tell when the ADX line is above both DI lines and when the ADX then makes a decrease from there(which can sometimes show a reversal), but personally it doesn't matter too much to me and perhaps to those who care more about seeing the direction than having to focus on all those 3 lines crossing all over the place.

ADX and DI Advance [SystemAlpha]Our version of ADX DMI indicator with option to show ADX as histogram or line.

ADX + DI x Upgraded to Pine v4 x KingThiesAverage Directional Movement Index
Momentum based tool to measure trend strength on scale of 1-100
Similar to the aroon but incorporates a 3rd measure, while aroon uses two
The majority of these calculations were pre-existing in older pine scripts but have since been updated
signals are given when -DI and +DI cross, ADX illustrates corresponding strength at time of cross
Full Intro
ADX can help investors to identify trend strengths, as di - di determines the trend direction, while d - d is an impulse indicator. If the ADX is below 20, it can be considered impulsive, while it is above 25 on a trend line.
A trading signal can be generated when the di - DI line is switched to d - d and vice versa. If the di-line crosses and the ADX is above 20 (ideally 25), a potential buy signal could ebb away.
If the ADX is above 20, there is the possibility of potential short selling if the DI crosses over DI. You can also use crosses to get out of the current deal if you need it for a long time.
If the di-line is crossed and the Adx is below 20 (or 25), there may be opportunities to enter the potential for short trading, but only if di are above or below DI or if the price is trendy and may not prove to be the ideal time to start trading.
[WJ] - ADX v2 [DMI, Alerts, Histogram, Customizable]A handy all-in-one package for DMI and ADX
Color-coordinated line for DMI with an EMA and histogram to gauge momentum, mark potential reversals, and quickly gather all the information you need to make your decisions.
Quick take-aways:
- Color of the ADX line indicates the current trend
- An ADX below the EMA indicates a potentially falling/reversing trend
- Customizable line w/ alerts for ADX crossovers
- Histogram to help catch potential reversals faster, and to gauge the momentum
Please let me know what you think, and in any features you think would increase the effectiveness of this amazing tool.

jlmora ADX IndicatorThe ADX also informs us of the prevailing market trend through the positive / negative movement indicators. Being able to determine the existence of a trend in the market and its strength is fundamental, since not all indicators or systems work correctly in different types of markets.
1. Operate only from long positions when the positive directional line is above the negative. Trade only from short positions when the negative directional line is above the positive. The best time to trade is when the ADX is on the rise, showing that the dominant group is strengthening.
2. When the ADX falls, it shows that the market is becoming less discretionary. There are likely to be a few unexpected turns. When the ADX points down, it is preferable not to use trend tracking methods.
3. When the ADX falls below both directional lines, this identifies a flat and sleepy market. Do not use a trend tracking system, but be prepared to trade as major trends emerge from such calm periods.
4. The best individual directional signal is given after the ADX falls below both directional lines. The longer it stays there, the stronger the base of the next move will be. When the ADX rebounds from below both directional lines, it shows that the market is waking up from a calm period. When the ADX grows four or more steps (for example, 9 to 13) from its lowest point below both directional lines, it is "ringing the bell" on a new trend. It shows that a new bull or bear market is emerging, depending on which directional line is above it. When the ADX rebounds above both directional lines, it is identifying an overheated market. When the ADX crosses both directional lines down, it shows that a major trend has entered. It is a good time to collect benefits in a directional operation. If you trade from long positions, you will definitely want to pick up partial gains. Market indicators give strong signals and weak signals. For example, when a moving average changes direction, it is a strong signal. A downward inflection of the ADX is a weak signal. Once you see that the ADX has been turned down, you should be very careful adding to open positions. You should start to collect profits, reduce positions and try to exit.
Directional Movement IndexThis is a standard ADX DMI indicator with Background colour and the option to draw the Background colour of the next higher timeframe.

ADX TriggerThis script fires off a buy alert when the ADX is rising and above a user-defined value (default 25). It fires off a sell signal when ADX starts sloping downward. The lookback period to determine if it is sloping up/down (in bars) is also configurable by the user. The plot highlights green when there is a "go" signal. Thanks to @9e52f12edd034d28bdd5544e7ff92e for the idea.
DMA: ADX L30A modified version of the ADX indicator
Indicator average directional movement ( ADX ) helps traders determine the strength of the trend, not its actual direction. It can be used to determine whether changes in the market or starts a new trend. It refers to the average directional movement Index (DMI), and, in fact, included DMI ADX line . The oscillator ranges from 0 to 100, where high values noted a strong trend and low readings indicate a weak trend. It is often combined with directional indicators. The indicator was developed by Welles Wilder, who has created several leading trading indicators.
Disconnected the lines DI and set the horizontal level 30
-----
Модифицированная версия индикатора ADX .
Индикатор среднего направленного движения ( ADX ) помогает трейдерам определить силу тренда, а не его фактическое направление. Его можно использовать, чтобы выяснить, меняется ли рынок, или начинается новый тренд. Он относится к Индексу направленного движения (DMI) и, фактически, в DMI включена линия ADX . Осциллятор колеблется от 0 до 100, где высокие показания отмечают сильный тренд, а низкие показания указывают на слабый тренд. Он часто комбинируется с направленными индикаторами. Индикатор был разработан Уэллсом Уайлдером, который создал несколько ведущих торговых индикаторов.
Отключены линии DI и установлен горизонтальный уровень на значении 30

ADX + Keylevel + RSIThis script is a combination of the Average Directional Movement Index (ADX) help to determine the trend strength with a key level and Relative Strength Index is an oscillator that measures the speed and change of price movements.
ADX + KeylevelThe Average Directional Movement Index (ADX) help to determine the trend strength with a key level.

ADX weighted maAs the first in a series of weighted moving averages I propose I present to you the ADX Weighted Moving Average .
The ADX Weighted Moving Average (ADXwma) calculates the average price over a certain period,
contrary to the well known Volume weighted ma, it is weighted by the ADX value,
the ADX value gives an indication of the "strength" of the market.
In this indicator the ADX is factored in to calculate the ma behaviour, meaning the stronger the market, the more price is factored in,
while price moves with a weak market are not as impactfull.
Feel free to experiment!!!
If you use the ADXwma in your scripts or your work, a shoutout would be nice!!
Gr, JD.
#NotTradingAdvice #DYOR

unRekt - KISS AddieKISS Addie is the ADX and DI+- indicator and is part of the 'keeping it simple' series. ADX is your Average Directional Index and DI is you Directional Movement Indicator.
ADX - Will show the strength of the trend regardless of direction.
00 - 10 : No trend
10 - 20 : Transitioning trend
20 - 40 : Trending
40 - 99 : Exhausted (Can also be considered a stronger trend the higher it goes, but look to exit position once it begins to downward slope and pay attention to DI spread)
DI - Will show the direction of movement. This indicator includes two views of the DI. the DI+ and DI- crossover and a histogram of the spread between the two.
Bullish : Green crosses over red.
Bearish : Red crosses over green.

Directional Movement Index TrendThis DMI I modified to see the trend more clearly, and the ADX line changes according to the trend force, which is perfectly configurable, the configuration I left my default configuration, in case you want to modify it because you see the trend in different values, feel free, and basically the columns are the average of DI and also indicate the trend more clearly.
/////////////////////////////////////////////////////////////////////////////////////////////////////////////////////////////////////////////////////////////////////////////////////
Esse DMI eu modifiquei para ver a tendência com maior clareza, e a linha do ADX ela muda de acordo com a força de tendência, a qual é perfeitamente configurável, a configuração eu deixei a minha configuração padrão, caso você queira modificar porque você vê a tendência em valores diferentes, sinta-se livre, e basicamente as colunas são a média de DI e indicam também com mais clareza a tendência.

Wolfs ADX + DII have created an alternative visualisation of the ADX + DI indicator created by MasaNakamura, credits to them for providing the source code! :-)
The histogram represents the distance between the DI+ and the DI-. The crossing of the histogram is equal to the crossing of the DI lines.
The ADX line is coloured based on the threshold.
This creates a clean representation of the ADX + DI.
