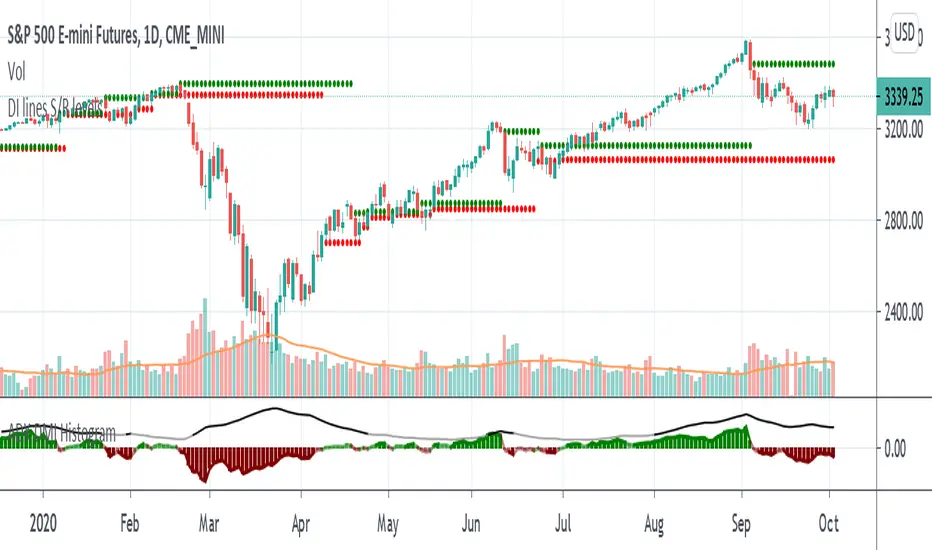
DMI-ADX HistogramThe Average Direction Index (ADX) coupled with the Direction Movement Index (DMI), developed by J. Welles Wilder, is a popular indicator that measures trend direction and strength.
The AX line (blue) is used to show the strength of the current trend. It does not tell you the trend direction. The under laid histogram shows relative movements of the price with green showing positive momentum and red showing negative momentum. Use these ADX and DMI together to find trend strength and direction.
- ADX line below 20 indicates that the underlying is in accumulation/distribution.
- ADX line above 20 mean that the underlying is trending with over 60 being very strong.
*When the ADX line is below 20 it is likely to see many reversal signals on the DMI Histogram. It is best to use the DMI signals when the ADX line is above 20 or higher. This is also a good level to play around with.
Motivation
Normally the direction movements are plotted as lines with the DI+ being green and the DI- being red. When the DI+ (green) crosses over DI- (red) this may indicate a buy signal, and vice versa. I found this visual representation made it difficult to see signals as well as lacked the ability to easy see the relative strength of other moves.
I have also noticed that the histogram values will periodically cross the ADX line, but not for very long periods. This could be a useful signal to explore further in the future.
In this image the top indicator is using the normal DI+/- lines, where the bottom indicator is using an absolute histogram.
ADX

[astropark] DMI/ADX strategy [strategy]Dear Followers,
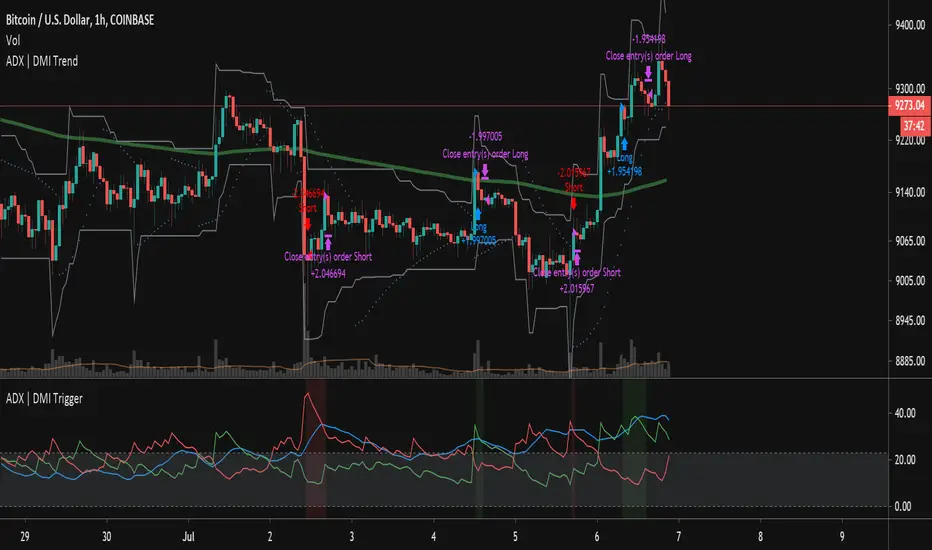
today I'm happy to share with you my DMI / ADX Strategy .
It provides directional trend information, so if a bullish or a bearish trend is going to start. Statistically it works better on lower timeframes (from 5 minutes to 1 hour).
It is both a Swing and Scalping Strategy indicator , based on a simple trend following theory , good for trading FOREX, Indexes, Stocks, Commodities and Cryptocurrencies.
To help in Taking Profits, the strategy integrates 2 special other than bull/bear signals:
Overbought and Oversold RSI Signals , which appear both as darker background (the darker the color, the more the price is in overbought/oversold) and green "ob"-"tp" / red "os"-"tp" labels (they optionally pop up only on a configurable stronger overbought/oversold condition) (you can enable/disable it optionally)
Peak Profit Tracker , which resets every time a new trade starts and keeps track of price fluctuation during the trade: the message is don't be too greedy and take profits or lock them with a stoploss in profit (you can enable/disable it optionally)
You can edit many options in order to
have more/less bull/bear signals
enable/disable showing bull/bear signals
enable/disable showing RSI TP signals (you can edit RSI length, overbought (OB) and oversold (OS) levels)
enable/disable showing peak profits on each trade
The user who wants to use this strategy, especially via an automated bot, must always set a stoploss (example 150$ from entry on bitcoin ) or use a proper risk management strategy .
This is not the "Holy Grail", so use it with caution. It's highly suggested to use a proper money management .
This script will let you backtest performance of the indicator based on bear/bull signals.
You can find the alarms version by searching for my DMI / ADX Strategy and choosing the "alarms" named.
Here there are some examples how this DMI / ADX strategy works on many markets:
LTC/USDT 15m
BTC/USD 15m
BNB/BTC 15m
ETH/USD 15m
GOLD (XAU/USD) 15m
GOLD (XAU/USD) 1h
FB 15m
AAPL 15m
TSLA 1h
BANKNIFTY Index 5m
NIFTY 50 Index 5m
This is a premium indicator , so send me a private message in order to get access to this script .

Support and Resistance levels - DMI - DI trailing stop linesThis can be used to compliment the Directional Movement Index if used as a standalone trading system. In addition to using the ADX and DI lines, a trailing stop can be used when the DI lines cross. If the plus line is above to show a buy signal, then the low of the price of when which the cross took place is used as a trailing stop. If the minus line is above to show a sell signal, then the high of the price of when which the cross took place is used as a trailing stop. This helps cut losses sooner whenever the price would end up going through these trailing stops or support/resistance levels yet the DMI system would show an upward or downward move.
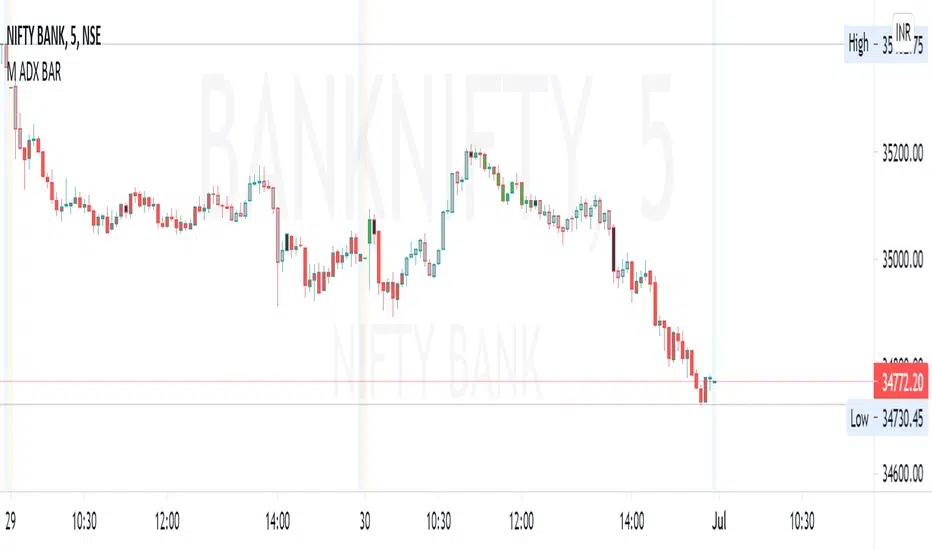
M ADX BARBar colors based on ADX and DI strength.
How to study:
ADX is less then 20 (adjustable value) is SILVER (no trend)
ADX >0 and DI delta (DI plus - DI minus) is >0 color LIME (trend up)
ADX>0 and DI delta <0 color RED (trend down)
ADX cross ADX Index ( adx+adx 14 period back)/2 color is BLACK and means start/end of trend
Converting the ADX into Bars for ease of use... (combining with RSI gives best results.. Timeframe 3min or more
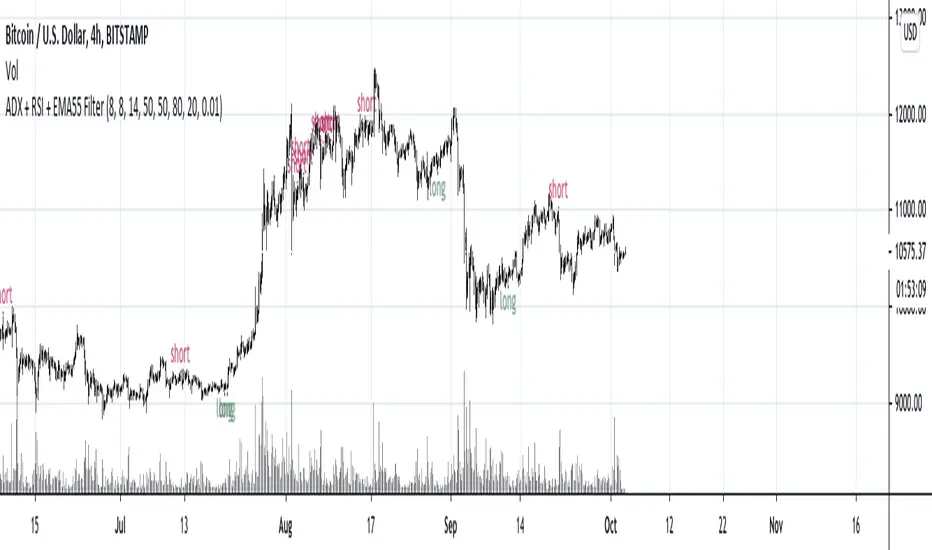
ADX + RSI + EMA55 FilterThis is a kind of trend indicators.
Signal to buy/sell comes when adx surpasses +5/-5 and RSI comes to buy/sell area.
Filtering with distance from ema55 (far above or far below position blocks entries) and with RSI overbought/oversold areas.
Needs to be adjusted for specific timeframes.
Default settings for 4H.
ADX Histogram with DI linesInspired by the user scarf from Tradingview. In contrast with that other indicator, this one instead of a simple moving average (SMA) for the ADX calculations, uses a running moving average (RMA) or also known as Wilder's Average. I like having a histogram for the DI lines over just having lines alone because it makes it easier to see. In addition I made it so that values less than 5 for the DI lines are colored lightly to note that the movement was less significant(might not matter but some might care about it, atleast I do). The ADX has a color fainting effect too, and when it goes above the threshold then it becomes black to note that it is trending, as the indicator suggests.
The advantages with these additions and changes are that it shows a more traditional moving average like the original author Wellers Wilder suggested and you can see the crossings and directional movement changes easier from seeing the colors on the histogram easier than you would by looking at the DI lines alone. The disadvantages are you won't be able to tell when the ADX line is above both DI lines and when the ADX then makes a decrease from there(which can sometimes show a reversal), but personally it doesn't matter too much to me and perhaps to those who care more about seeing the direction than having to focus on all those 3 lines crossing all over the place.

ADX Extrapolation Is calculated by using the formula y(x)=y1+ (x−x1/x2−x1) * (y2−y1). Linear Extrapolation.
You can edit the x1 and x2 coordinate distance, where x is the current point, x1 is the number of periods previous, and x2 is two times the previous periods.
Measures the differences between a line of best fit and average line and issues signals when they exceed a multiplier of the extrapolated values.
It is ADX and +DI and -DI.
The ADX and +DI and -DI is set to be and oscillation as we are not calulating the values themselves, but the difference from the mean/best fit.
DI+ and DI- are simple to read, minus is orange, while plus is aqua. They operate as a normal 14 length DI plotted, but will turn red when they are trending stronger than expected, and green when trending weaker than expected.
The yellow line is the ADX, oscillating around the colored line 0. When the ADX is red it signals that the current trend is significantly stronger than expected and has a high chance of reversal. When the line is green is signifies the trend is significantly weaker than expected. A clear shortcoming is most trends ADX will read to be weaker than normal after a significant blow off or drop.
To make it as simple as possible, I included a large line at 0 under the ADX oscillation so you can just read that if you wish.
Bull Reversals:
green = stronger than extrap ADX and minus ***great signal
blue = stronger than extrap ADX and plus < minus ***good signal
purple = stronger than extrap minus and weaker than expected ADX ***ok signal
Bear Reversals:
red = stronger than extrap ADX and plus ***great signal
orange = stronger than extrap ADX and minus < plus ***good signal
yellow = stronger than extrap plus and weaker than expected ADX ***ok signal
Other than that is treated as normal ADX.

ADX strategy (considering ADX and +DI only )I have been checking the strategies on ADX indicator.
I have found that +DI crossing above ADX line under threshold 30 and exit on crossdown when ADX above 30 has better results than just following crossovers of +DI and -DI , ADX crossing above 30 .
BUY Rule
========
fast ema is above slow ema (default 13 and 55 , you can change these values in settings)
+DI cross above ADX well beloe threshold level (default 30)
Exit reule
========
when +DI cross down ADX , well above on threshold level
Stop Loss
=========
Default is set to 8%
Take a look and let me know how your symbol works with this strategy
Note : Bar color changes to yellow when the BUY condition is met.
Bar color and Background color shows to blue --- if Long position is active
fast ema and long ema doesnt print on the chart -- please add manually to the chart
Warning : for the use of educational purposes only

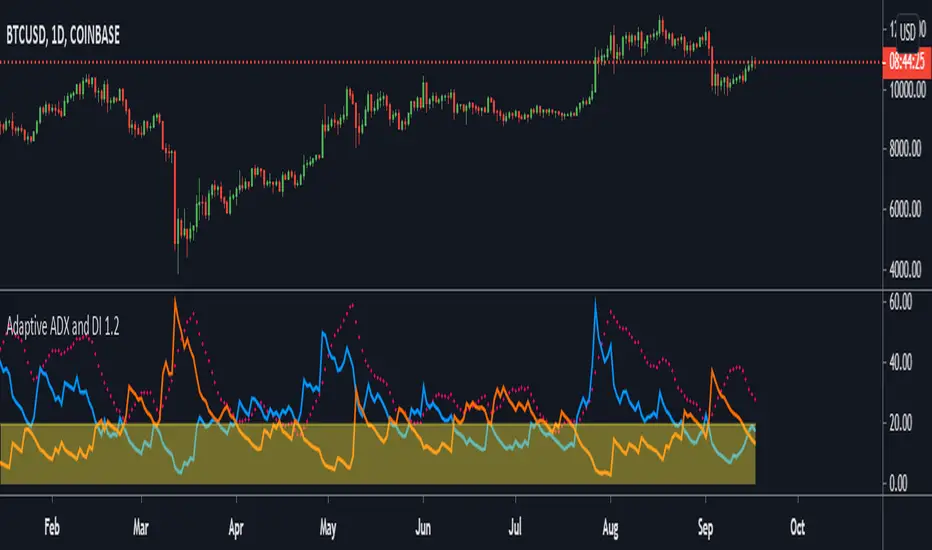
Adaptive ADX and DIThis is part 2 of 11 in the system named Ninetales/Volt V2 you can find on Tradingview.
It simply measures all of the combinations of the defined parameters of a typical ADX + DI , and returns the most logically accurate values.
Use it however you would use a standard ADX + DI, just add your preferred values to test against each other, and set the period you would like for it to backtest.
Standard use would be to wait for ADX(red line) to be above the threshold(yellow shaded area). The short when orange is above the blue line, and long when the blue line is above the orange line.
Volt v2Change your candle view to line or bar.
This script uses the most common strategies for the following indicators. : RSI , Moving Averages, Stochastic , ADX , MACD , VWMA , Support and Resistance , Bollinger Bands , Ichimoku Cloud , Parabolic SAR , and Commodity Channel.
It compares the default values defined by the user to the other values which are specified, determining which has been most effective over the lookback period, which also is defined by the user.
It then groups the most effective settings over the defined period for lagging and leading indicators, and issues a positive or negative score for each individual indicator.
For this iteration there are 4 leading, and 7 lagging indicators.
Green candles show the sum of leading, and also lagging indicator is a positive total greater than 1.
Blue shows a positive sum.
Yellow shows a negative sum.
Red shows a negative sum of leading and also lagging indicators greater than 1.
White shows no defined direction.
Trades are entered on the first red or green candle, and exited on red or yellow for longs, or green or blue for shorts.

ADX and DI Advance [SystemAlpha]Our version of ADX DMI indicator with option to show ADX as histogram or line.

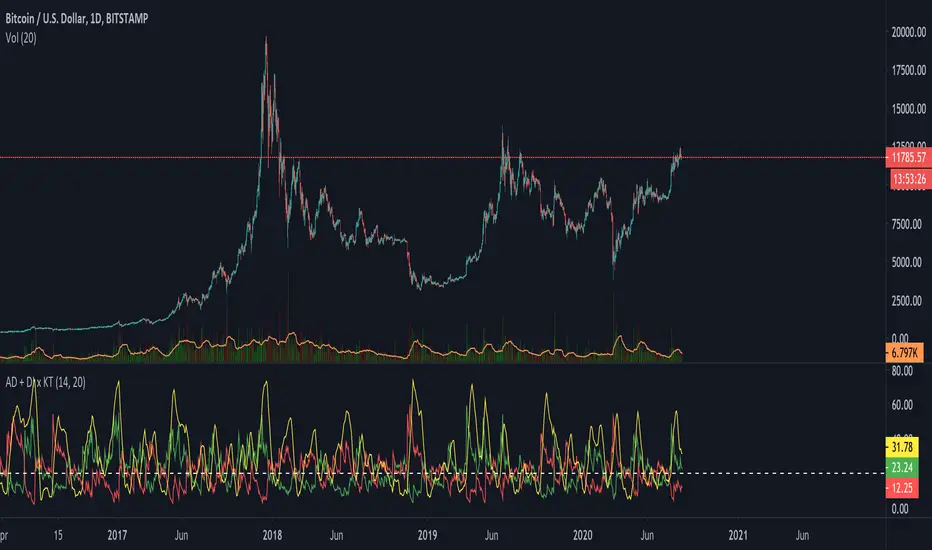
ADX + DI x Upgraded to Pine v4 x KingThiesAverage Directional Movement Index
Momentum based tool to measure trend strength on scale of 1-100
Similar to the aroon but incorporates a 3rd measure, while aroon uses two
The majority of these calculations were pre-existing in older pine scripts but have since been updated
signals are given when -DI and +DI cross, ADX illustrates corresponding strength at time of cross
Full Intro
ADX can help investors to identify trend strengths, as di - di determines the trend direction, while d - d is an impulse indicator. If the ADX is below 20, it can be considered impulsive, while it is above 25 on a trend line.
A trading signal can be generated when the di - DI line is switched to d - d and vice versa. If the di-line crosses and the ADX is above 20 (ideally 25), a potential buy signal could ebb away.
If the ADX is above 20, there is the possibility of potential short selling if the DI crosses over DI. You can also use crosses to get out of the current deal if you need it for a long time.
If the di-line is crossed and the Adx is below 20 (or 25), there may be opportunities to enter the potential for short trading, but only if di are above or below DI or if the price is trendy and may not prove to be the ideal time to start trading.
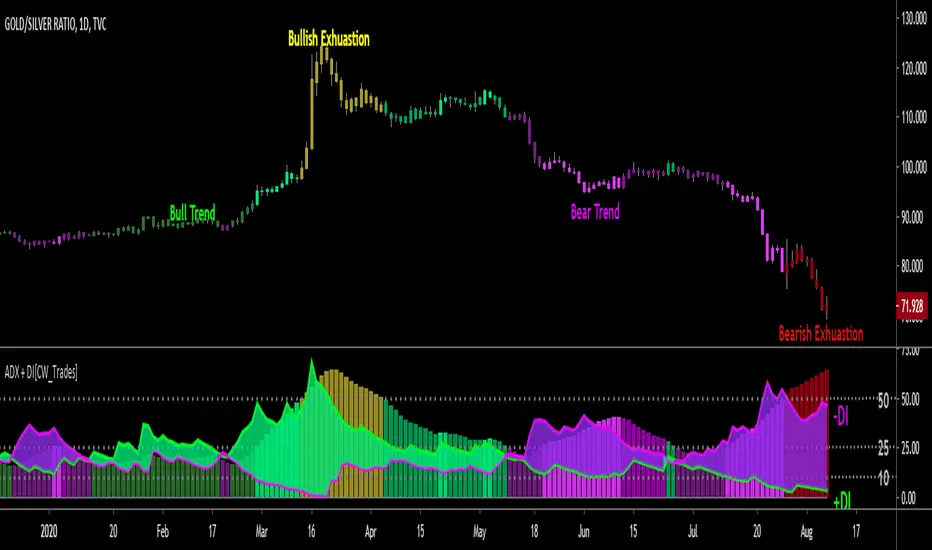
ADX + DI w/ Colored Candles [CW_Trades]The Average Directional Index (ADX) is a technical analysis indicator used to determine price trend and price strength by comparing current price to recent price history. The price trend can be either up or down(bullish/bearish), and this is shown by two accompanying indicators, the Negative Directional Indicator (-DI, purple line) and the Positive Directional Indicator (+DI, green line) which compare price highs to price lows on a 14-period lookback. The strength of the trend is shown by the histogram in the background and also utilizes a 14-period lookback in its calculation.
When the +DI is trending above the -DI it indicates a short-term bullish trend in price. If the histogram is rising while the +DI is above the -DI it indicates strength in the bullish trend. If the histogram is declining while the +DI is above the -DI it indicates weakness in the bullish trend.
When the -DI is trending above the +DI it indicates a short-term bullish trend in price. If the histogram is rising while the -DI is above the +DI it indicates strength in the bearish trend. If the histogram is declining while the -DI is above the +DI it indicates weakness in the bearish trend.
When the +DI is above the -DI the histogram will be colored shades of green. When the -DI is above the +DI the histogram will be colored shades of purple.
The ADX has 3 key levels to watch, and they are 10, 25 and 50.
-When the ADX histogram bars are below 10 it indicates no identifiable strength in the price trend, or neutral. The histogram bars will be colored gray when the ADX is below 10.
-When the ADX histogram bars are between 10 and 25 it indicates a weak trend in price. The histogram bars will be shades of dark green or dark purple when in this zone.
-When the ADX histogram bars are above 25 and below 50 it indicates a strong trend in price. The histogram bars will be shades of medium green/purple or bright green/purple when the ADX is between 25
and 50. Bright green or bright purple indicate that the current histogram bar is higher than the preceding histogram bar, medium shades of either green or purple indicate that the current histogram bar is
lower than the preceding histogram bar. The brighter the shade of green or purple, the stronger the trend.
-When the ADX histogram bars are above 50 it indicates potential trend exhaustion. When the +DI is above the -DI and the ADX is above 50 the histogram will be colored yellow which indicates a potential
end of the bull trend. When the -DI is above the +DI and the histogram bars are above 50 the histogram will be colored red which indicates a potential end of the bearish trend.
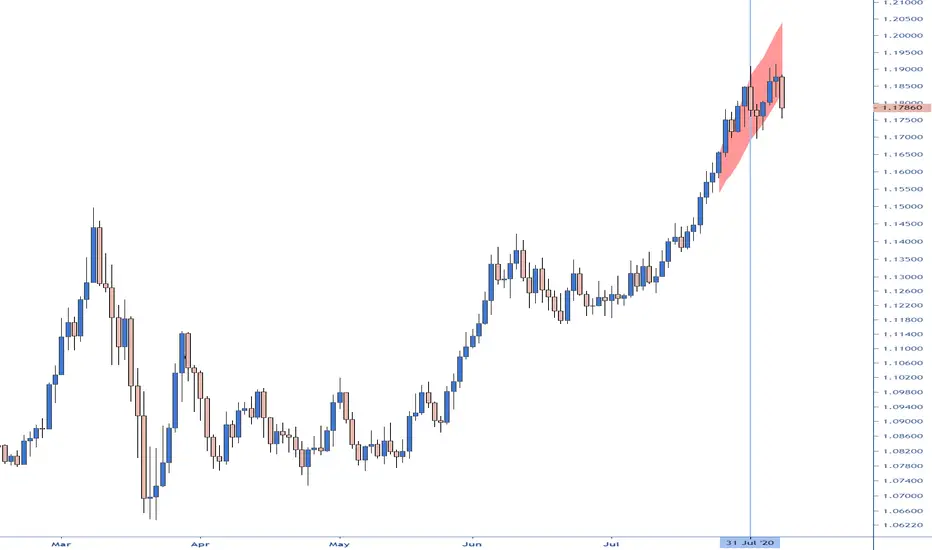
Trend Cloud
The clouds reflect a possible overextension of the trend. Traders could use it as a signal to scale out the positions in the direction of the present trend or avoid scaling in.
The indicator plots the difference between ADX over the 45 level proportionate to the range between an ATR multiplier around MA. By default, the ADX is calculated with a DI length of 14 and an ADX smoothing of 14, an ATR length of 14, MA length of 20 and a multiplier of 2.
On the chart, I have highlighted with the vertical line the candles when the indicator was activated on all four timeframes simultaneously.
indicatorenindicatoren is one non-overlaying indicator with multiple oscillators combined.
indicatoren provides the following functions:
- RSI (Relative Strength Index)
- Stochastics (representation of mathematically calculated momentum)
- Configurable MAcd (Moving Average Convergence Divergence) visually compressed to 0-100 range
- DMI & ADX (Directional Movement Index & Average Directional indeX) with visual lowering option
- Bollinger Bands direction
- COMBI Average
- Hourly, 4Hourly, Daily and Weekly time-indications
The length and appearance for each element can be adjusted. The MAcd has several modes and the brightness
of its elements can be adjusted with one single control.
The COMBI Average consists of a weighted average of the RSI, Stochastics, MAcd, DMI and the BB Direction.
It has its own definable length. Depending on the timeframe used, a visual indication of Hours, 4 Hours,
Days and Weeks might prove handy, especially on shorter timeframes.
Displaying this number of oscillators all at once may look like a carnival, therefore, each function can easily
be switched on or off. indicatoren can be used as just an advanced MAcd for example, or have it show the
combination of functions suiting you the most.
In order to combine a MAcd (+/- infinite scale) with Stochastics or RSI (0-100 scale), the MAcd is being visually
compressed and a Visual Multiplier parameter is provided to make it fit under any circumstances on any timeframe.
The DMI +/- and ADX scale are divided by 2.5 by default. Having the DMI’s on the lower portion of the indicator
does still provide decent info at a glance while it is not in the way of the other oscillators.
Books have been written and many articles and videos have been made about the meaning and possible applications
of these oscillators in trading.
The unique combination of these oscillators within indicatoren , together with the simple, yet useful,
visual options, make it to quite a versatile indicator on every timeframe on any chart.
GuidoN - November 2019, July 2020

[WJ] - ADX v2 [DMI, Alerts, Histogram, Customizable]A handy all-in-one package for DMI and ADX
Color-coordinated line for DMI with an EMA and histogram to gauge momentum, mark potential reversals, and quickly gather all the information you need to make your decisions.
Quick take-aways:
- Color of the ADX line indicates the current trend
- An ADX below the EMA indicates a potentially falling/reversing trend
- Customizable line w/ alerts for ADX crossovers
- Histogram to help catch potential reversals faster, and to gauge the momentum
Please let me know what you think, and in any features you think would increase the effectiveness of this amazing tool.

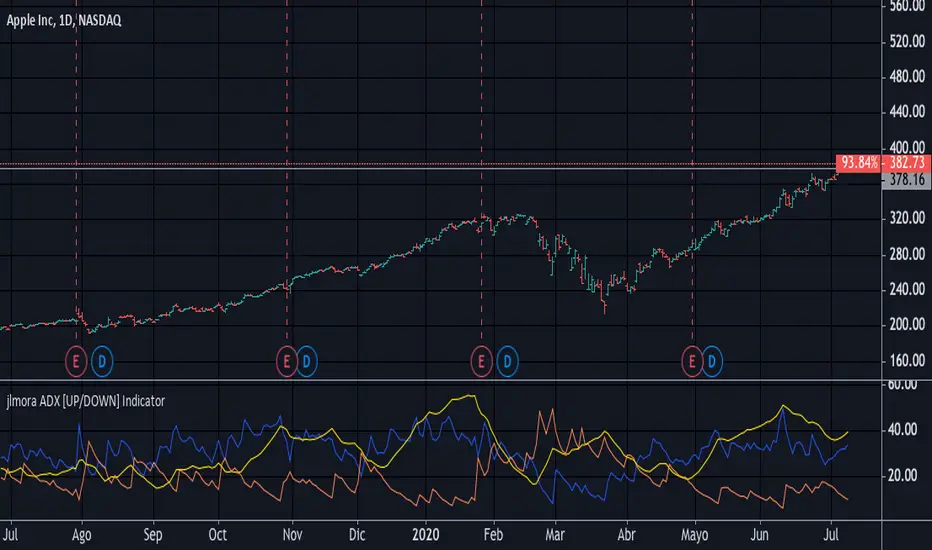
jlmora ADX IndicatorThe ADX also informs us of the prevailing market trend through the positive / negative movement indicators. Being able to determine the existence of a trend in the market and its strength is fundamental, since not all indicators or systems work correctly in different types of markets.
1. Operate only from long positions when the positive directional line is above the negative. Trade only from short positions when the negative directional line is above the positive. The best time to trade is when the ADX is on the rise, showing that the dominant group is strengthening.
2. When the ADX falls, it shows that the market is becoming less discretionary. There are likely to be a few unexpected turns. When the ADX points down, it is preferable not to use trend tracking methods.
3. When the ADX falls below both directional lines, this identifies a flat and sleepy market. Do not use a trend tracking system, but be prepared to trade as major trends emerge from such calm periods.
4. The best individual directional signal is given after the ADX falls below both directional lines. The longer it stays there, the stronger the base of the next move will be. When the ADX rebounds from below both directional lines, it shows that the market is waking up from a calm period. When the ADX grows four or more steps (for example, 9 to 13) from its lowest point below both directional lines, it is "ringing the bell" on a new trend. It shows that a new bull or bear market is emerging, depending on which directional line is above it. When the ADX rebounds above both directional lines, it is identifying an overheated market. When the ADX crosses both directional lines down, it shows that a major trend has entered. It is a good time to collect benefits in a directional operation. If you trade from long positions, you will definitely want to pick up partial gains. Market indicators give strong signals and weak signals. For example, when a moving average changes direction, it is a strong signal. A downward inflection of the ADX is a weak signal. Once you see that the ADX has been turned down, you should be very careful adding to open positions. You should start to collect profits, reduce positions and try to exit.
Directional Movement IndexThis is a standard ADX DMI indicator with Background colour and the option to draw the Background colour of the next higher timeframe.

ADX | DMI Trend StrategyThis strategy takes the ADX Indicator I wrote and applies it to a strategy for back testing purposes.
I've also applied a date filter so you can back test specific date ranges and a moving average filter so you can choose whether to filter your longs/shorts based on a moving average.
LIZ ADX+DMIThe thick lines represent ADX .
When the volatility increases, it faces up and the color changes from gray to green.
When the background is gray and starts to turn green from below the horizontal line of reference value of 20, the volatility increases, indicating that the environment is becoming easier to trade.
When ADX rises and then peaks out, the line goes down and the previously green line changes to gray.
This means that the trend that was going on before is now over.People who hold positions use them to sign off their hands.
Also, those who want to see the trend change and build a new position with a backstop can use it to sign their entries.
When the background is gray (due to the deterioration of ADX ), it indicates that the volatility is low, there is no value width, and the direction is unclear, so it's not a good time to trade.
The two thin lines, red and blue, are DMI.A red line at the top and a blue line at the bottom indicates that the buying power is dominant, and the gap between the two lines is painted red.
On the other hand, if the blue line is up and the red line is down, it shows that the selling power is superior and it is painted blue.
When the two ADX lines intersect, and the color between the lines is changing from red to blue or blue to red, it indicates that the buyer's advantage has changed.
You can look at when the line crosses, and then enter in the new direction of dominance and build a position.
You can also determine that your position is in line with the market flow if it is in line with your current predominance.
However, in the opposite case, it suggests that the position you have is not in the right direction.
When two DMI lines are crossed frequently, it indicates a range or random rate.
In such cases, the background is often gray, indicating that it is difficult to make a profit in trade.
If you are interested in the invitation-only indicator, please contact us on private chat.
太い線はADXを表してます。
ボラティリティーが上昇すると上を向き、色がグレーから緑に変化します。
背景がグレーの期間で、水平線で示す基準値20より低い位置から上を向き緑に変化し始める時、ボラティリティーが上昇し、トレードしやすい環境になりつつある事を示唆しています。
ADXが上昇し、やがてピークアウトするとラインが下を向き、それまで緑だったラインの色がグレーに変わります。これは、それまで続いていたトレンドが一旦終了した事を意味します。
ポジションを持っていた人は、手仕舞いのサインに使います。
また、トレンドの転換を確認し、逆張りで新規ポジションの構築を狙っている人はエントリーのサインに使えます。
ADXが低下しているせいで,背景がグレーになっている時は,ボラティリティーが低下しており、値幅がなく、方向性がはっきりしないという理由で取引に向いていない時期である事を示します。
赤、青2本の細いラインはDMIです。赤いラインが上、青いラインが下の時は買い勢力が優勢である事を示し、2本の線の間が赤に塗られます。
反対に青いラインが上、赤いラインが下の時は売り勢力が優勢である事を示し、青に塗られます。
2本のADXラインが交差し、線の間に塗られた色が、
赤から青、または青から赤に変化する時、買い方売り方の優劣が入れ替わった事を示唆します。
ラインがクロスするタイミングを見て、新しく優勢になった方向にエントリーし、ポジションを構築できます。
また、自分が既に持っているポジションが、現在優勢である方向と一致している時はマーケットの流れに合っていると判断できます。
しかし反対の時は、あなたが持っているポジションの方向が合っていない事を示唆しています。
2本のDMIラインが頻繁にクロスしている時は、レンジ相場やランダム相場である事を示唆します。
そのような時は背景もグレーになっている時が多く、トレードで利益を出すのが難しい環境である事を表しています。
招待専用インジに興味ある方はプライベートチャットに連絡をください。

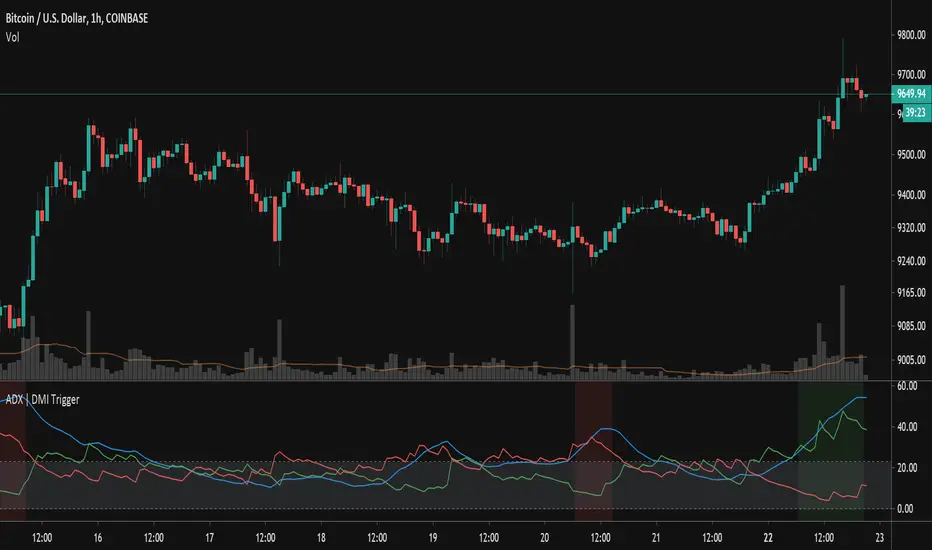
ADX TriggerThis script fires off a buy alert when the ADX is rising and above a user-defined value (default 25). It fires off a sell signal when ADX starts sloping downward. The lookback period to determine if it is sloping up/down (in bars) is also configurable by the user. The plot highlights green when there is a "go" signal. Thanks to @9e52f12edd034d28bdd5544e7ff92e for the idea.
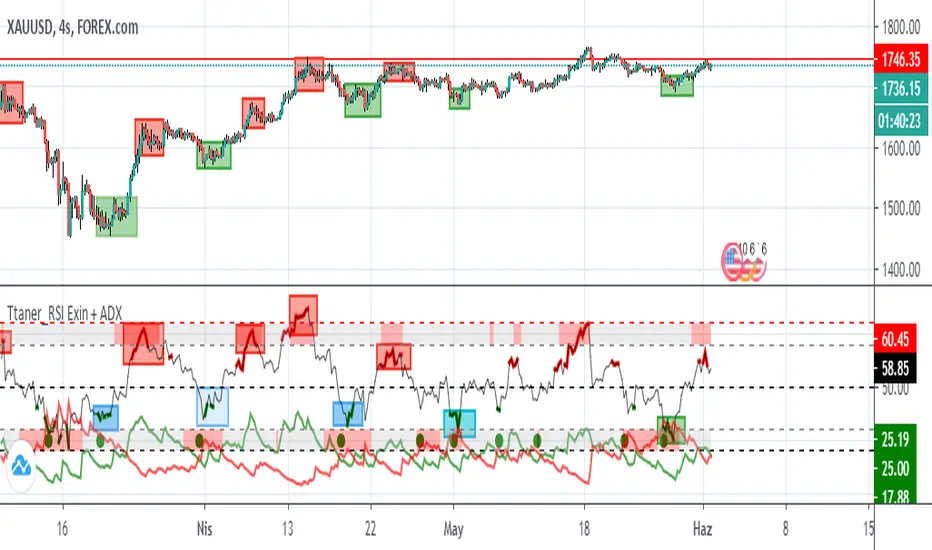
Relative Strength Index Exin + ADX Hello friends, I wish you all the best.
Relative Strength İndex + Adx coding.
I'd like to talk a little bit about how it works
We can say that the ascension action begins when the green line rises above the red line
you can measure the success rate of this indicator from the past.
RSI The green dots at the bottom show reception.
RSI The red dots on the top indicate that sales may come.
RSI means purchase when the bottom is green
When the RSI top line turns red, it means sales
If my sharing has helped you, you can like and support it. Stay tuned to be notified of new analysis and indicators
DMA: ADX L30A modified version of the ADX indicator
Indicator average directional movement ( ADX ) helps traders determine the strength of the trend, not its actual direction. It can be used to determine whether changes in the market or starts a new trend. It refers to the average directional movement Index (DMI), and, in fact, included DMI ADX line . The oscillator ranges from 0 to 100, where high values noted a strong trend and low readings indicate a weak trend. It is often combined with directional indicators. The indicator was developed by Welles Wilder, who has created several leading trading indicators.
Disconnected the lines DI and set the horizontal level 30
-----
Модифицированная версия индикатора ADX .
Индикатор среднего направленного движения ( ADX ) помогает трейдерам определить силу тренда, а не его фактическое направление. Его можно использовать, чтобы выяснить, меняется ли рынок, или начинается новый тренд. Он относится к Индексу направленного движения (DMI) и, фактически, в DMI включена линия ADX . Осциллятор колеблется от 0 до 100, где высокие показания отмечают сильный тренд, а низкие показания указывают на слабый тренд. Он часто комбинируется с направленными индикаторами. Индикатор был разработан Уэллсом Уайлдером, который создал несколько ведущих торговых индикаторов.
Отключены линии DI и установлен горизонтальный уровень на значении 30
