mrD-Volume Profile HeatmapThis indicator combines advanced volume analysis with institutional-grade visualization techniques to provide traders with a comprehensive view of market structure and liquidity zones.
WHAT MAKES THIS UNIQUE:
• Proprietary bidirectional volume profiling algorithm that separates buying and selling pressure using VWAP deviation analysis, not standard volume bars
• Custom heatmap visualization engine with adaptive gradient calculation based on volume-weighted price distribution across multiple timeframes
• Integrated Weekly VWAP with hlc3 weighting for institutional reference levels
• Dynamic POC (Point of Control) detection with fixed-height text boxes for clarity
• Optimized rendering system that handles 500+ bars efficiently without lag
HOW IT WORKS:
The algorithm analyzes volume distribution at each price level within the lookback period, applying a proprietary weighting system that considers:
1. Volume-weighted average price (VWAP) deviation to classify volume as bullish/bearish
2. Price levels are binned into customizable rows (bins) for granular analysis
3. Volume bars extend bidirectionally: positive volume (green) extends left, negative volume (red) extends right
4. Heatmap overlay uses multi-level gradient mapping (6-color spectrum) to highlight high volume nodes
5. Weekly VWAP provides macro trend reference with session-based reset logic
VOLUME PROFILE MECHANICS:
• Calculates volume distribution across price levels using a grid-based binning system
• Each bin accumulates volume when the price touches that level
• Positive/negative classification based on VWAP position (above = bullish, below = bearish)
• POC automatically identifies the price level with maximum volume concentration
• Display shows volume intensity through color gradients and bar lengths
HEATMAP VISUALIZATION:
• Uses exponential gradient multiplier (default 1.9) for enhanced contrast
• Color transitions: Dark Blue (low volume) → Cyan → Green → Yellow (high volume)
• Transparency-adjusted overlays ensure chart readability
• Real-time updates as new volume data arrives
WEEKLY VWAP INTEGRATION:
• Resets at the start of each trading week (request.security logic)
• Uses hlc3 (typical price) as the volume-weighted source
• Provides institutional reference level for swing traders
• Yellow color (#FFEB3B) for easy identification
KEY PARAMETERS:
• Period: Lookback window for volume calculations (default: 500 bars)
• Bins: Number of price levels for volume distribution (default: 150 rows)
• Offset: Horizontal positioning of volume bars (default: 50)
• Heatmap Rows: Granularity of heatmap overlay (default: 250)
• POC displays actual volume numbers for transparency
TRADING APPLICATIONS:
→ Identify high-volume nodes as support/resistance zones
→ Detect liquidity clusters where institutional orders concentrate
→ Spot low-volume areas where price may move quickly (thin zones)
→ Use bidirectional volume to assess buying vs selling pressure
→ Combine with Weekly VWAP for multi-timeframe confluence
→ POC levels often act as price magnets (mean reversion targets)
TECHNICAL IMPLEMENTATION NOTES:
• Optimized for intraday to swing timeframes (1m to Daily charts)
• Volume calculations use session-based accumulation (no future data)
• Box rendering is limited to 500 objects for performance
• Gradient calculations use mathematical power functions for smooth transitions
• VWAP calculation follows institutional standard (volume-weighted hlc3)
RESTRICTIONS:
This is a proprietary algorithm. Redistribution, modification, or commercial use is strictly prohibited. The logic and methods contained herein are confidential and protected intellectual property.
═══════════════════════════════════════════
DISCLAIMER & RISK WARNING
This indicator is provided solely for educational and informational purposes. It is designed to help traders understand market structure, volume distribution, and price action analysis. This tool should be used as part of a comprehensive trading education program.
NOT FINANCIAL ADVICE:
The information and signals provided by this indicator DO NOT constitute financial advice, investment advice, trading advice, or any other sort of advice. You should not treat any of the indicators' content, outputs, or signals as such. Nothing contained in this indicator constitutes a solicitation, recommendation, endorsement, or offer to buy or sell any securities or other financial instruments in this or in any other jurisdiction.
NO GUARANTEED RESULTS:
Past performance is NOT indicative of future results. The historical backtesting results, volume patterns, and statistical data shown by this indicator do not guarantee future performance or success. Market conditions change constantly, and what worked in the past may not work in the future. Trading and investing involve substantial risk of loss.
MARKET VOLATILITY:
Financial markets are inherently volatile and unpredictable. Volume patterns, support/resistance levels, and other technical indicators can fail at any time. No indicator can predict market movements with certainty. Always use proper risk management and position sizing.
By using this indicator, you acknowledge that you have read, understood, and agree to this disclaimer in its entirety. If you do not agree with any part of this disclaimer, you should not use this indicator.
Advance/Decline Volume Line

NinKa• Regression Length (200)
This value represents the reference period used to identify the trend.
A higher value captures broader market movements,
while a lower value makes the indicator respond more sensitively for short-term scalping.
• Normalization (100)
This parameter adjusts how smooth the indicator’s movements appear.
If the value is too low, you will see more noise.
If it is too high, the response becomes slower.
• Signal Line (100)
This line is the threshold for buy and sell signals.
When the indicator crosses above or below this level,
it is interpreted as a signal.
The current settings are optimized for observing stable market trends.
If you prefer more sensitivity for fast scalping entries,
you can reduce the Length value.
Feel free to adjust the parameters according to your trading style,
but using the default settings is perfectly fine as well.

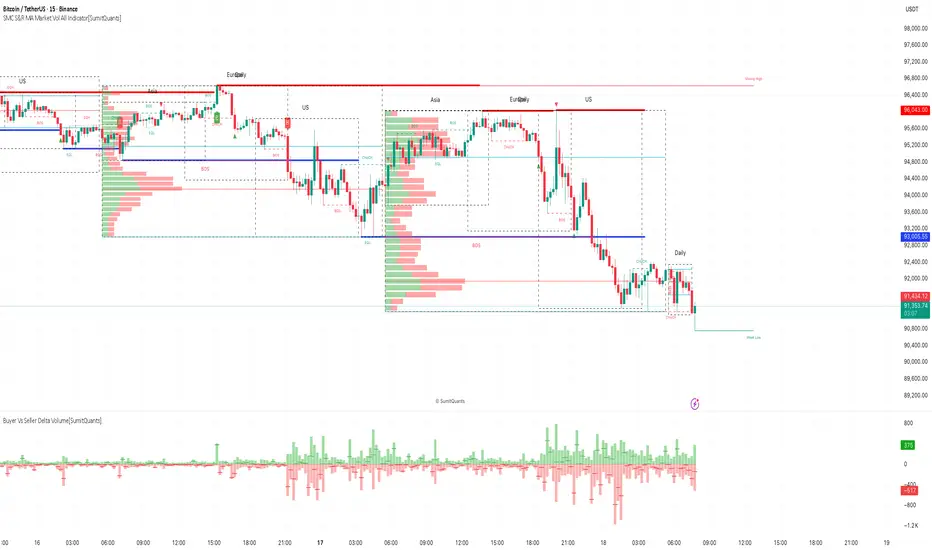
SMC S&R MA Market Vol All Indicator[SumitQuants]🚀 SMC S&R + Market Sessions + Volume Profile + Order Flow Suite
The Only All-In-One Institutional Trading System You’ll Ever Need.
Looking for an indicator that actually brings clarity to chaotic markets?
Meet the SMC S&R MA Market Volume & Sessions Order Flow System — a powerhouse that fuses Smart Money Concepts, Session Profiles, and Dynamic Volume Flow into one ultra-optimized institutional toolkit.
This is not “just another SMC indicator.”
This is your complete trading ecosystem.
💠 What This Indicator Does (In Simple Terms)
It automatically reads the market the way institutions do — and displays it cleanly on your chart with zero clutter.
Below is everything packed inside 👇
🔥 1. Market Sessions + Volume Profile (Real Institutional Map)
✔ Tokyo- Asia | London- Europe | New York- US sessions auto-detected ⏱️
✔ Each session gets its own Volume Profile 📊
✔ See POC, VAH, VAL, Value Area Box for each session
✔ Live Developing Profile in real-time
✔ Wick-based and body-volume distribution for ultra-accurate auctions
✔ Session Boxes that highlight imbalance zones
✔ Perfect for:
High-volume Asia breaks
London volatility expansion
NY reversal traps
👉 Think of it as having pro-level TPO/Volume Profile inside TradingView.
🎯 2. Advanced S&R Strength Engine (Buyer vs Seller Power Meter)
✔ Detects strongest Support & Resistance zones
✔ Measures Buyer Strength & Seller Strength (% based)
✔ Auto-plots S/R Lines + S/R Zones
✔ Detects Bounce signals, Rejection points, Pressure shifts
✔ Zero repaint logic
You get institutional footprints directly on your chart.
📈 3. Smart Money Concepts (Full Automation)
✔ BOS / CHoCH detection
✔ Internal + Swing Structure
✔ Order Blocks (Internal + Swing)
✔ Equal Highs & Equal Lows
✔ Fair Value Gaps (FVG)
✔ Strong/Weak Highs + Lows labeling
✔ Trend coloring (optional)
✔ Premium / Discount Zones
All plotted with precision.
All customizable.
All built to remove guesswork.
💹 4. Multi-MA Engine (5 Fully Configurable MAs)
✔ EMA, SMA, WMA, VWMA, SMMA
✔ Choose length, color, and source
✔ Ideal for trend confirmation + dynamic S/R
Smooth. Clean. Non-laggy.
📊 5. Enhanced Supertrend (Toggles + Filters)
✔ Switch between Line / Histogram / Hidden
✔ Optional background trend coloring
✔ Buy/Sell signals with trend-change alerts
✔ No repaint
Perfect for directional bias.
⚡ 6. Breakout Detection + Volume Confirmation
✔ Auto-detects Support/Resistance Breaks
✔ Confirms breaks through Volume Surge % Oscillator
✔ Detects:
Bullish Breaks
Bearish Breaks
Bullish Rejections
Bearish Rejections
You instantly know when a breakout is real or fake.
📍 7. VWAP System with Multi-Band Zones
✔ Session-based VWAP
✔ Bands via Std Deviation or %
✔ Clean pullback zones
✔ Perfect for intraday institutions-style precision
🧠 8. Fully Integrated Alerts
Alerts for:
✔ BOS / CHoCH (Internal + Swing)
✔ Order Block Breakouts
✔ Equal Highs / Equal Lows
✔ Fair Value Gaps
✔ S/R Zone Interactions
✔ Trend Shifts
✔ Breakouts with Volume Confirmation
✔ Supertrend Reversals
And more.
Never miss major price shifts again.
🎨 9. Clean UI + Auto-Adaptive Watermark
✔ Auto-contrast watermark
✔ Minimalistic but premium
✔ Chart-friendly colors
✔ Built to match dark or light themes
🌍 Who This Indicator Is For?
✔ Intraday traders
✔ Swing traders
✔ SMC traders
✔ Volume/Order Flow traders
✔ Forex, Crypto, Index & Stocks
✔ Anyone wanting a single all-in-one trading system
🔥 Why 90% Traders Love This System
Because it gives you:
🔥 Session Bias
🔥 Volume-backed Zones
🔥 Clean Market Structure
🔥 Trend Bias + Liquidity Areas
🔥 Institutional S/R with Strength Meter
🔥 Accurate Order Flow Reactions
Everything you need to trade like top-tier professionals — without needing 10 indicators.
🛒 Get Full Access
This premium institutional system is available as part of the Courses Section on the official website.
👉 Purchase the indicator as a Course at:
www.ironmindtrader.com
Inside the course, you'll get:
✔ Access instructions
✔ Setup guide
✔ Trading rules
✔ Updates included
Institutional Sessions Volume Order Flow [SumitQuants]Institutional Sessions Volume Order Flow
🔥 Institutional Sessions Volume Order Flow — The all-in-one Pine v6 toolkit that reveals institutional volume order blocks, session structure, VWAP bands and trend ribbon so you can trade with professional conviction.
🎯 See where smart money is active. Institutional Sessions Volume Order Flow surfaces high-volume order blocks, session boxes, VWAP bands, MA ribbon and Supertrend alerts — a single overlay that turns market noise into tradable structure. ⚡📈
✨ Key Features
📦 Institutional Volume Order Blocks: Detects bullish & bearish order blocks by aggregating volume around local highs/lows and plots filled zones with volume-percent labels.
🕒 Session Boxes & Timeline: Auto session boxes for Asia/ Europe / NewYork / Sydney with merge options, open/close lines, pip/% labels and optional candle coloring.
📉 VWAP with Bands: Multi-anchor VWAP (Session/Week/Month/Quarter/Year/Earnings/Dividends/Splits) plus up to 3 configurable bands (SD or % mode) and fills.
🧭 Moving Average Ribbon: 4-MA ribbon (SMA/EMA/SMMA/WMA/VWMA) for trend structure and dynamic S/R.
⚡ Supertrend Overlay: Optional Supertrend with conditional background fill and built-in trend-change alert hooks.
🔔 Prebuilt Alerts: Supertrend flips, session opens, session new highs/lows — ready for automation or notifications.
⚙️ Deep Customization: Colors, styles, lookback, merge behaviors, band multipliers, anchor periods, session times, label sizes, and more.
🛠 Pine v6 Optimized: Modern, overlay-ready Pine Script v6 implementation suitable for intraday and multi-timeframe use.
🧠 Why Traders Buy It
🔍 Institutional context: Volume-weighted order blocks reveal where large participants acted — crucial for high-probability trade planning.
✅ Stacked confirmation: Ribbon → VWAP → order block filters noise and aligns entries with institutional flow.
🌐 Session clarity: Quickly identify which market session is driving price and volatility.
📣 Actionable alerts: Be notified exactly when setups trigger so you don’t miss transitions.
🧩 Versatile: Great for scalpers, intraday momentum traders, swing traders, prop desks and system developers.
🚀 Quick Start (3 steps)
Add Institutional Sessions Volume Order Flow to your chart (Pine v6).
Enable Order Blocks + VWAP + Supertrend to begin.
Tune session times and band/MA settings for your instrument and timeframe. Use Supertrend + ribbon alignment + zone retest for higher-probability entries. 🎛️
🧾 Technical Notes & Compatibility
📜 Pine Script v6 — compatible with TradingView’s current scripting environment.
📌 Overlay indicator — draws directly on price chart.
🔔 Alerts use alertcondition hooks for TradingView notifications.
👤 Author: Created and maintained by SumitQuants.
⚠️ Risk Disclaimer
This tool provides context and signals — not guarantees. Backtest, paper trade, and use responsible risk management. Past performance is not indicative of future results. 📉
🛒 Call to Action (CTA)
Ready to trade with institutional clarity?
👉 Buy Institutional Sessions Volume Order Flow now — or message for a demo, custom tweaks, or a bundle including backtest/strategy code. Quick support and configuration help included. 💬
Reach out to the website and Buy This Indicator in the Courses Section www.ironmindtrader.com

Multi-Timeframe EMA Trend Dashboard with Volume and RSI Filters═══════════════════════════════════════════════════════════
MULTI-TIMEFRAME EMA TREND DASHBOARD
═══════════════════════════════════════════════════════════
OVERVIEW
This indicator provides a comprehensive view of trend direction across multiple timeframes using the classic EMA 20/50 crossover methodology, enhanced with volume confirmation and RSI filtering. It aggregates trend information from six timeframes into a single dashboard for efficient market analysis.
The indicator is designed for educational purposes and to assist traders in identifying potential trend alignments across different time horizons.
═══════════════════════════════════════════════════════════
FEATURES
═══════════════════════════════════════════════════════════
MULTI-TIMEFRAME ANALYSIS
• Monitors 6 timeframes simultaneously: 1m, 5m, 15m, 1H, 4H, 1D
• Each timeframe analyzed independently using request.security()
• Non-repainting implementation with proper lookahead settings
• Calculates overall trend strength as percentage of bullish timeframes
EMA CROSSOVER SYSTEM
• Fast EMA (default: 20) and Slow EMA (default: 50)
• Bullish: Fast EMA > Slow EMA
• Bearish: Fast EMA < Slow EMA
• Neutral: Fast EMA = Slow EMA (rare condition)
• Visual EMA plots with optional fill area
VOLUME CONFIRMATION
• Optional volume filter for crossover signals
• Compares current volume against moving average (default: 20-period SMA)
• Categorizes volume as: High (>1.5x average), Normal (>average), Low (70), oversold (<30), and neutral zones
• Used in quality score calculation
• Optional display toggle
SUPPORT & RESISTANCE DETECTION
• Automatic detection using highest/lowest over lookback period (default: 50 bars)
• Plots resistance (red), support (green), and mid-level (gray)
• Step-line style for clear visualization
• Optional display toggle
QUALITY SCORING SYSTEM
• Rates trade setups from 1-5 stars
• Considers: MTF alignment, volume confirmation, RSI positioning
• 5 stars: 4+ timeframes aligned + volume confirmed + RSI 50-70
• 4 stars: 4+ timeframes aligned + volume confirmed
• 3 stars: 3+ timeframes aligned
• 2 stars: Exactly 3 timeframes aligned
• 1 star: Other conditions
VISUAL DASHBOARD
• Clean table display (position customizable)
• Color-coded trend indicators (green/red/yellow)
• Extended statistics panel (toggleable)
• Shows: Trends, Strength, Quality, RSI, Volume, Price Distance
═══════════════════════════════════════════════════════════
TECHNICAL SPECIFICATIONS
═══════════════════════════════════════════════════════════
CALCULATIONS
Trend Determination per Timeframe:
• request.security() fetches EMA values with gaps=off, lookahead=off
• Compares Fast EMA vs Slow EMA
• Returns: 1 (bullish), -1 (bearish), 0 (neutral)
Trend Strength:
• Counts number of bullish timeframes
• Formula: (bullish_count / 6) × 100
• Range: 0% (all bearish) to 100% (all bullish)
Price Distance from EMA:
• Formula: ((close - EMA) / EMA) × 100
• Positive: Price above EMA
• Negative: Price below EMA
• Warning when absolute distance > 5%
ANTI-REPAINTING MEASURES
• All request.security() calls use lookahead=barmerge.lookahead_off
• Dashboard updates only on barstate.islast
• Historical bars remain unchanged
• Crossover signals finalize on bar close
═══════════════════════════════════════════════════════════
USAGE GUIDE
═══════════════════════════════════════════════════════════
INTERPRETING THE DASHBOARD
Timeframe Rows:
• Each row shows individual timeframe trend status
• Look for alignment (multiple timeframes same direction)
• Higher timeframes generally more significant
Strength Indicator:
• >66.67%: Strong bullish (4+ timeframes bullish)
• 33.33-66.67%: Mixed/choppy conditions
• <33.33%: Strong bearish (4+ timeframes bearish)
Quality Score:
• Higher stars = better confluence of factors
• 5-star setups have strongest multi-factor confirmation
• Lower scores may indicate weaker or conflicting signals
SUGGESTED APPLICATIONS
Trend Confirmation:
• Check if multiple timeframes confirm current chart trend
• Higher agreement = stronger trend confidence
• Use for position sizing decisions
Entry Timing:
• Wait for EMA crossover on chart timeframe
• Confirm with higher timeframe alignment
• Volume above average preferred
• RSI not in extreme zones
Divergence Detection:
• When lower timeframes diverge from higher
• May indicate trend exhaustion or reversal
• Requires additional confirmation
CUSTOMIZATION
EMA Settings:
• Adjust Fast/Slow lengths for different sensitivities
• Shorter periods = more responsive, more signals
• Longer periods = smoother, fewer signals
• Common alternatives: 10/30, 12/26, 50/200
Volume Filter:
• Enable for higher-quality signals (fewer false positives)
• Disable in always-liquid markets or for more signals
• Adjust MA length based on typical volume patterns
Display Options:
• Toggle EMAs, S/R levels, extended stats as needed
• Choose dashboard position to avoid chart overlap
• Adjust colors for visibility preferences
═══════════════════════════════════════════════════════════
ALERTS
═══════════════════════════════════════════════════════════
AVAILABLE ALERT CONDITIONS
1. Bullish EMA Cross (Volume Confirmed)
2. Bearish EMA Cross (Volume Confirmed)
3. Strong Bullish Alignment (4+ timeframes)
4. Strong Bearish Alignment (4+ timeframes)
5. Trend Strength Increasing (>16.67% jump)
6. Trend Strength Decreasing (>16.67% drop)
7. Excellent Trade Setup (5-star rating)
Alert messages use standard placeholders:
• {{ticker}} - Symbol name
• {{close}} - Current close price
• {{time}} - Bar timestamp
═══════════════════════════════════════════════════════════
LIMITATIONS & CONSIDERATIONS
═══════════════════════════════════════════════════════════
KNOWN LIMITATIONS
• Lower timeframe data may not be available on all symbols
• 1-minute data typically limited to recent history
• request.security() subject to TradingView data limits
• Dashboard requires screen space (may overlap on small screens)
• More complex calculations may affect load time on slower devices
NOT SUITABLE FOR
• Highly volatile/illiquid instruments (many false signals)
• News-driven markets during announcements
• Automated trading without additional filters
• Markets where EMA strategies don't perform well
DOES NOT PROVIDE
• Exact entry/exit prices
• Stop-loss or take-profit levels
• Position sizing recommendations
• Guaranteed profit signals
• Market predictions
═══════════════════════════════════════════════════════════
BEST PRACTICES
═══════════════════════════════════════════════════════════
RECOMMENDED USAGE
✓ Combine with price action analysis
✓ Use appropriate risk management
✓ Backtest on historical data before live use
✓ Adjust settings for specific market characteristics
✓ Wait for higher-quality setups in important trades
✓ Consider overall market context and fundamentals
NOT RECOMMENDED
✗ Using as standalone trading system without confirmation
✗ Trading every signal without discretion
✗ Ignoring risk management principles
✗ Trading without understanding the methodology
✗ Applying to unsuitable markets/timeframes
═══════════════════════════════════════════════════════════
EDUCATIONAL BACKGROUND
═══════════════════════════════════════════════════════════
EMA CROSSOVER STRATEGY
The Exponential Moving Average crossover is a classical trend-following technique:
• Golden Cross: Fast EMA crosses above Slow EMA (bullish signal)
• Death Cross: Fast EMA crosses below Slow EMA (bearish signal)
• Widely used since the 1970s in various markets
• More responsive than SMA due to exponential weighting
MULTI-TIMEFRAME ANALYSIS
Analyzing multiple timeframes helps traders:
• Identify alignment between short and long-term trends
• Reduce false signals from single-timeframe noise
• Understand market context across different horizons
• Make informed decisions about trade duration
VOLUME ANALYSIS
Volume confirmation adds reliability:
• High volume suggests institutional participation
• Low volume signals may indicate false breakouts
• Volume precedes price in many market theories
• Helps distinguish genuine moves from noise
═══════════════════════════════════════════════════════════
TECHNICAL IMPLEMENTATION
═══════════════════════════════════════════════════════════
CODE STRUCTURE
• Organized in clear sections with proper commenting
• Uses explicit type declarations (int, float, bool, color, string)
• Constants defined at top (BULLISH=1, BEARISH=-1, etc.)
• Functions documented with @function, @param, @returns
• Follows PineCoders naming conventions (camelCase variables)
PERFORMANCE OPTIMIZATION
• var keyword for table (created once, not every bar)
• Calculations cached where possible
• Dashboard updates only on last bar
• Minimal redundant security() calls
SECURITY IMPLEMENTATION
• Proper gaps and lookahead parameters
• No future data leakage
• Signals finalize on bar close
• Historical bars remain static
═══════════════════════════════════════════════════════════
VERSION INFORMATION
═══════════════════════════════════════════════════════════
Current Version: 2.0
Pine Script Version: 5
Last Updated: 2024
Developed by: Zakaria Safri
═══════════════════════════════════════════════════════════
SETTINGS REFERENCE
═══════════════════════════════════════════════════════════
EMA SETTINGS
• Fast EMA Length: 1-500 (default: 20)
• Slow EMA Length: 1-500 (default: 50)
VOLUME & MOMENTUM
• Use Volume Confirmation: true/false (default: true)
• Volume MA Length: 1-500 (default: 20)
• Show RSI Levels: true/false (default: true)
• RSI Length: 1-500 (default: 14)
PRICE ACTION FEATURES
• Show Price Distance: true/false (default: true)
• Show Key Levels: true/false (default: true)
• S/R Lookback Period: 10-500 (default: 50)
DISPLAY SETTINGS
• Show EMAs on Chart: true/false (default: true)
• Fast EMA Color: customizable (default: cyan)
• Slow EMA Color: customizable (default: orange)
• EMA Line Width: 1-5 (default: 2)
• Show Fill Between EMAs: true/false (default: true)
• Show Crossover Signals: true/false (default: true)
DASHBOARD SETTINGS
• Position: Top Left/Right, Bottom Left/Right
• Show Extended Statistics: true/false (default: true)
ALERT SETTINGS
• Alert on Multi-TF Alignment: true/false (default: true)
• Alert on Trend Strength Change: true/false (default: true)
═══════════════════════════════════════════════════════════
RISK DISCLAIMER
═══════════════════════════════════════════════════════════
This indicator is provided for educational and informational purposes only. It should not be considered financial advice or a recommendation to buy or sell any security.
IMPORTANT NOTICES:
• Past performance does not indicate future results
• All trading involves risk of capital loss
• No indicator guarantees profitable trades
• Always conduct independent research and analysis
• Use proper risk management and position sizing
• Consult a qualified financial advisor before trading
• The developer assumes no liability for trading losses
By using this indicator, you acknowledge that you understand these risks and accept full responsibility for your trading decisions.
═══════════════════════════════════════════════════════════
SUPPORT & CONTRIBUTIONS
═══════════════════════════════════════════════════════════
FEEDBACK WELCOME
• Constructive comments appreciated
• Bug reports help improve the indicator
• Feature suggestions considered for future versions
• Share your experience to help other users
OPEN SOURCE
This code is published as open source for the TradingView community to:
• Learn from the implementation
• Modify for personal use
• Understand multi-timeframe analysis techniques
If you find this indicator useful, please consider:
• Leaving a thoughtful review
• Sharing with other traders who might benefit
• Following for future updates and releases
═══════════════════════════════════════════════════════════
ADDITIONAL RESOURCES
═══════════════════════════════════════════════════════════
RECOMMENDED READING
• TradingView Pine Script documentation
• PineCoders community resources
• Technical analysis textbooks on moving averages
• Multi-timeframe trading strategy guides
• Risk management principles
RELATED CONCEPTS
• Trend following strategies
• Moving average convergence/divergence
• Multiple timeframe analysis
• Volume-price relationships
• Momentum indicators
═══════════════════════════════════════════════════════════
Thank you for using this indicator. Trade responsibly and continue learning!
═══════════════════════════════════════════════════════════

CCI PKTELUGUTRADERThe Commodity Channel Index (CCI) is a momentum oscillator that helps traders identify potential buy and sell opportunities by measuring how far the price of a security deviates from its average price over a specific period. It’s widely used for spotting new trends, overbought and oversold conditions, and possible price reversals in various financial markets.
Description of CCI
The CCI calculates the difference between the current price and its historical average price, normalized by mean deviation. Unlike indicators such as RSI, the CCI is an unbounded oscillator, meaning its values can go above +100 or below -100, providing broader insights into momentum shifts in prices.
The formula for CCI is:
CCI
=
Typical Price
−
SMA of Typical Price
0.015
×
Mean Deviation
CCI=
0.015×Mean Deviation
Typical Price−SMA of Typical Price
where:
Typical Price = (High + Low + Close) / 3
SMA is the Simple Moving Average of the Typical Price over the chosen period
Mean Deviation is the average deviation from the SMA.
Buy and Sell Signals
A buy signal is typically generated when the CCI moves above +100, indicating the start of a strong uptrend.
A sell signal occurs when the CCI drops below -100, signaling a strong downtrend.
Many traders close their buy positions when the CCI falls back below +100 and close their sell positions when it rises above -100, or use price action confirmation to validate signals.
Values above +100 suggest overbought conditions, while below -100 indicate oversold; extreme values (like +200 or -200) suggest even stronger momentum.
CCI divergences (price moves not confirmed by the indicator) may indicate potential reversals.
Summary Table: CCI Signals
CCI Level Market Condition Potential Action
Above +100 Overbought/Uptrend Consider Buying
Below -100 Oversold/Downtrend Consider Selling
Back between -100 and +100 Neutral/Indecision Exit or Wait
The CCI is best used alongside other technical indicators for confirmation, as it can generate false signals during sideways markets.
References:
Guide to Commodity Channel Index
What Is CCI?
CCI Trading Strategies
CCI: Technical Indicator
Commodity channel index

Bullish Breakout - SBStep 1 – Chart Setup
Timeframe: 5-minute
Studies to add:
VWAP (Session VWAP)
EMA 9 & EMA 20 (trend filter)
Bullish Breakout – Clean v6.1
⚙️ Step 2 – Indicator Settings (scalping mode)
Resistance lookback: 15
Volume confirmation: ON, multiplier = 1.2–1.3 (lighter requirement, more signals).
RSI filter: ON, threshold = 55 (looser than intraday swing).
MACD filter: ON
HTF filter: ON → timeframe = 15m, EMA = 50 (so trades align with short-term trend).
Retest check: ON (safer signals).
ATR stop/targets: ON → ATR length 14, Stop = 1.0×ATR, T1 = 0.7×ATR, T2 = 1.4×ATR.
Visuals: Stealth Mode ON (just arrows + compact label).
🎯 Step 3 – Entry Rules
Wait for a green breakout arrow under a 5m bar.
Confirm conditions:
Price is above VWAP.
EMA 9 > EMA 20 (micro trend bullish).
Optional: RSI > 55 and volume above SMA×1.2.
Enter at close of breakout bar.
Aggressive: enter right on arrow.
Conservative: enter only if teal retest dot confirms.
🛡️ Step 4 – Risk/Exit Plan
Stop loss: red ATR line (~1×ATR below entry).
Target 1 (T1): yellow ATR line (~0.7×ATR above entry).
Target 2 (T2): green ATR line (~1.4×ATR above entry).
Management:
Sell 70% at T1, move stop to entry.
Let 30% run to T2 or trail with EMA 9.
🔔 Step 5 – Alerts
Set TradingView alerts for:
Bullish Breakout (green arrow)
Breakout Retest Confirmed (teal dot)
So you don’t miss quick setups during the session.
⚡ Extra Scalping Tips
Focus on liquid tickers (ORCL, MSFT, AAPL, NVDA, etc.) — tight spreads, good volume.
Trade first 2–3 hours after market open for best volatility.
Avoid scalping right before big news (FOMC, earnings).
Don’t overstay: average 10–30 minutes per trade.

Volume Profile AnalysisThe Volume Profile Dashboard is a professional-grade analysis tool built for TradingView. It focuses on displaying a comprehensive volume profile breakdown within a dashboard format directly on the chart. The purpose of this tool is to help traders quickly assess buy versus sell volume dynamics, momentum, and sentiment in order to support informed trading decisions.
Instead of plotting simple bars, this indicator uses a detailed table and visual progress bar to summarize live and historical market activity. By condensing key metrics into a structured format, traders can analyse market behaviour without manually calculating or switching between multiple indicators.
________________________________________
How the Script Works
1. Data Gathering
The script uses lower-timeframe price and volume data to calculate buy volume, sell volume, and total traded volume for the current and previous candles.
2. Volume Allocation
Buy and sell volumes are estimated by looking at the candle’s range (high to low) and how the closing price aligns within that range. The closer the close is to the high, the stronger the buying pressure. The closer the close is to the low, the stronger the selling pressure.
3. Delta and Momentum
o Delta measures the difference between buy and sell volume.
o Volume momentum compares the current candle’s activity to the previous one, showing if interest is rising or fading.
4. Point of Control (POC)
An average of high, low, and close is calculated to give an approximate “point of control” level—an area of balance where buyers and sellers previously agreed on price.
5. Dashboard Visualization
All these calculations are displayed inside a clean dashboard table with separate rows for the current candle, previous candle, and a summary row. Icons, colors, and progress bars make it visually intuitive.
6. On-Chart Progress Indicator
A dynamic horizontal progress bar is plotted on the chart above price, showing the balance between buy and sell volume for the latest activity.
7. Alerts
Built-in alerts trigger when strong buying or selling pressure is detected or when there is a significant spike in total traded volume.
________________________________________
How This Tool Can Be Used
• Intraday Trading: Quickly gauge whether buyers or sellers are in control of the market at any moment.
• Swing Trading: Compare momentum shifts between candles to identify early trend reversals.
• Risk Management: Use delta and sentiment signals to confirm whether to hold or reduce exposure.
• Confirmation: Align the volume profile dashboard with other indicators (such as RSI, MACD, or trendlines) for stronger trading conviction.
________________________________________
Using Mixed Indicators for Decisions
This dashboard alone provides volume insights, but better decisions come when it is combined with other tools:
• Pairing it with an RSI can show whether heavy buying is happening in overbought conditions.
• Combining with a SuperTrend or moving averages can confirm if volume momentum aligns with the price trend.
• Overlaying support/resistance levels can identify whether strong buy/sell signals occur at critical levels.
Mixed indicators prevent relying on one signal alone, reducing false trades.
________________________________________
Importance of This Tool
• Clarity: Condenses complex volume data into a simple, visual format.
• Speed: Traders can react faster with pre-calculated buy/sell percentages.
• Precision: Highlights hidden imbalances that are not obvious from candles alone.
• Professional-grade dashboard: Offers an institutional-style view of market behavior directly within TradingView.
________________________________________
Parameters in the Dashboard Table
• Period: Shows whether the row is for the current or previous candle, along with trend arrows.
• Price Range: The high–low range of the candle.
• Total Volume: The sum of buy and sell activity.
• Buy Volume / Sell Volume: Separated distribution of transactions leaning bullish or bearish.
• Delta: The net difference between buy and sell volumes, highlighting pressure imbalance.
• Buy % / Sell %: The percentage contribution of each side to total volume.
• POC: An average reference level where market consensus was strongest.
• Progress: A graphical bar showing buy vs sell dominance.
• Signal: Simplified output like Strong Buy, Buy, Strong Sell, Sell, Neutral.
• Summary Row: Compares changes between the current and previous candles and gives overall market sentiment.
________________________________________
Stock Market Disclaimer
This tool is for educational and informational purposes only. It does not constitute financial advice, investment advice, or trading recommendations. The stock market and cryptocurrency markets involve high risk. Traders and investors should do their own research and consult licensed financial advisors before making investment decisions. Past performance is not indicative of future results.
________________________________________
Misuse Disclaimer
This script has been developed as per TradingView’s rules and is intended for responsible trading analysis only. Any misuse, redistribution, or modification outside of TradingView’s policies is discouraged. The author and platform are not responsible for financial losses, misinterpretation of signals, or misuse of the code.
________________________________________
Disclaimer
Training & Educational Only — This material and the indicator are provided for educational purposes only. Nothing here is investment advice or a solicitation to buy or sell financial instruments. Past simulated or historical performance does not predict future results. Always perform full back testing and risk management, and consider seeking advice from a qualified financial professional before trading with real capital.
________________________________________

Big Orders Detector - Whale Activity SpotterDetect Institutional & Whale Trading Activity with Volume Analysis
This indicator helps traders identify significant buy/sell orders (whale activity) by analyzing volume spikes and price movements. Perfect for spotting institutional entries and exits.
📊 Key Features:
Volume Spike Detection - Identifies when volume exceeds average by customizable multiplier
Price Movement Analysis - Tracks significant price changes with adjustable threshold
Smart Direction Detection - Distinguishes between big buy and sell orders
Visual Markers - Clear arrows, background highlights, and detailed labels
Flexible Settings - Fully customizable parameters for different trading styles
Statistics Table - Optional real-time order count tracking
Alert System - Built-in alerts for automated notifications
⚙️ How It Works:
The indicator combines volume analysis with price movement detection to identify unusual market activity. When volume significantly exceeds the moving average AND price shows meaningful movement, it marks these as potential whale orders.
🎯 Best Used For:
Crypto markets with high volume activity
Forex pairs during major news events
Stock trading around earnings/announcements
Identifying institutional accumulation/distribution
📈 Settings Guide:
Volume Multiplier (3.0) - How many times above average volume (recommended minimum: 3.0)
Volume Period (20) - Moving average period for volume
Price Threshold (1.5%) - Minimum price change requirement
Visual Options - Toggle arrows, labels, and background highlights
💡 Trading Tips:
Use on liquid markets with consistent volume
Combine with support/resistance levels
Higher timeframes show more significant orders
Adjust sensitivity based on market volatility
⚠️ Important Notes:
Not financial advice - for educational purposes only
Past performance doesn't guarantee future results
Always use proper risk management
Test parameters on your specific markets
Perfect for swing traders, day traders, and anyone looking to spot whale activity in their favorite markets!

Yelober - Market Internal direction+ Key levelsYelober – Market Internals + Key Levels is a focused intraday trading tool that helps you spot high-probability price direction by anchoring decisions to structure that matters: yesterday’s RTH High/Low, today’s pre-market High/Low, and a fast Value Area/POC from the prior session. Paired with a compact market internals dashboard (NYSE/NASDAQ UVOL vs. DVOL ratios, VOLD slopes, TICK/TICKQ momentum, and optional VIX trend), it gives you a real-time read on breadth so you can choose which direction to trade, when to enter (breaks, retests, or fades at PMH/PML/VAH/VAL/POC), and how to plan exits as internals confirm or deteriorate. On top of these intraday decision benefits, it also allows traders—in a very subtle but powerful way—to keep an eye on the VIX and immediately recognize significant spikes or sharp decreases that should be factored in before entering a trade, or used as a quick signal to modify an existing position. In short: clear levels for the chart, live internals for the context, and a smarter, rules-based path to execution.
# Yelober – Market Internals + Key Levels
*A TradingView indicator for session key levels + real‑time market internals (NYSE/NASDAQ TICK, UVOL/DVOL/VOLD, and VIX).*
**Script name in Pine:** `Yelober - Market Internal direction+ Key levels` (Pine v6)
---
## 1) What this indicator does
**Purpose:** Help intraday traders quickly find high‑probability reaction zones and read market internals momentum without switching charts. It overlays yesterday/today’s **automatic price levels** on your active chart and shows a **market breadth table** that summarizes NYSE/NASDAQ buying pressure and TICK direction, with an optional VIX trend read.
### Key features at a glance
* **Automatic Price Levels (overlay on chart)**
* Yesterday’s High/Low of Day (**yHoD**, **yLoD**)
* Extended Hours High/Low (**yEHH**, **yEHL**) across yesterday AH + today pre‑market
* Today’s Pre‑Market High/Low (**PMH**, **PML**)
* Yesterday’s **Value Area High/Low** (**VAH/VAL**) and **Point of Control (POC)** computed from a volume profile of yesterday’s **regular session**
* Smart de‑duplication:
* Shows **only the higher** of (yEHH vs PMH) and **only the lower** of (yEHL vs PML) to avoid redundant bands
* **Market Breadth Table (on‑chart table)**
* **NYSE ratio** = UVOL/DVOL (signed) with **VOLD slope** from session open
* **NASDAQ ratio** = UVOLQ/DVOLQ (signed) with **VOLDQ slope** from session open
* **TICK** and **TICKQ**: live cumulative ratio and short‑term slope
* **VIX** (optional): current value + slope over a configurable lookback/timeframe
* Color‑coded trends with sensible thresholds and optional normalization
---
## 2) How to use it (trader workflow)
1. **Mark your reaction zones**
* Watch **yHoD/yLoD**, **PMH/PML**, and **VAH/VAL/POC** for first touches, break/retest, and failure tests.
* Expect increased responsiveness when multiple levels cluster (e.g., PMH ≈ VAH ≈ daily pivot).
2. **Read the breadth panel for context**
* **NYSE/NASDAQ ratio** (>1 = more up‑volume than down‑volume; <−1 = down‑dominant). Strong green across both favors long setups; red favors short setups.
* **VOLD slopes** (NYSE & NASDAQ): positive and accelerating → broadening participation; negative → persistent pressure.
* **TICK/TICKQ**: cumulative ratio and **slope arrows** (↗ / ↘ / →). Use the slope to gauge **near‑term thrust or fade**.
* **VIX slope**: rising VIX (red) often coincides with risk‑off; falling VIX (green) with risk‑on.
3. **Confluence = higher confidence**
* Example: Price reclaims **PMH** while **NYSE/NASDAQ ratios** print green and **TICK slopes** point ↗ — consider break‑and‑go; if VIX slope is ↘, that adds risk‑on confidence.
* Example: Price rejects **VAH** while **VOLD slopes** roll negative and VIX ↗ — consider fade/reversal.
4. **Risk management**
* Place stops just beyond key levels tested; if breadth flips, tighten or exit.
> **Timeframes:** Works best on 1–15m charts for intraday. Value Area is computed from **yesterday’s RTH**; choose a smaller calculation timeframe (e.g., 5–15m) for stable profiles.
---
## 3) Inputs & settings (what each option controls)
### Global Style
* **Enable all automatic price levels**: master toggle for yHoD/yLoD, yEHH/yEHL, PMH/PML, VAH/VAL/POC.
* **Line style/width**: applies to all drawn levels.
* **Label size/style** and **label color linking**: use the same color as the line or override with a global label color.
* **Maximum bars lookback**: how far the script scans to build yesterday metrics (performance‑sensitive).
### Value Area / Volume Profile
* **Enable Value Area calculations** *(on by default)*: computes yesterday’s **POC**, **VAH**, **VAL** from a simplified intraday volume profile built from yesterday’s **regular session bars**.
* **Max Volume Profile Points** *(default 50)*: lower values = faster; higher = more precise.
* **Value Area Calculation Timeframe** *(default 15)*: the security timeframe used when collecting yesterday’s highs/lows/volumes.
### Individual Level Toggles & Colors
* **yHoD / yLoD** (yesterday high/low)
* **yEHH / yEHL** (yesterday AH + today pre‑market extremes)
* **PMH / PML** (today pre‑market extremes)
* **VAH / VAL / POC** (yesterday RTH value area + point of control)
### Market Breadth Panel
* **Show NYSE / NASDAQ / VIX**: choose which series to display in the table.
* **Table Position / Size / Background Color**: UI placement and legibility.
* **Slope Averaging Periods** *(default 5)*: number of recent TICK/TICKQ ratio points used in slope calculation.
* **Candles for Rate** *(default 10)* & **Normalize Rate**: VIX slope calculation as % change between `now` and `n` candles ago; normalize divides by `n`.
* **VIX Timeframe**: optionally compute VIX on a higher TF (e.g., 15, 30, 60) for a smoother regime read.
* **Volume Normalization** (NYSE & NASDAQ): display VOLD slopes scaled to `tens/thousands/millions/10th millions` for readable magnitudes; color thresholds adapt to your choice.
---
## 4) Data sources & definitions
* **UVOL/VOLD (NYSE)** and **UVOLQ/DVOLQ/VOLDQ (NASDAQ)** via `request.security()`
* **Ratio** = `UVOL/DVOL` (signed; negative when down‑volume dominates)
* **VOLD slope** ≈ `(VOLD_now − VOLD_open) / bars_since_open`, then normalized per your setting
* **TICK/TICKQ**: cumulative sum of prints this session with **positives vs negatives ratio**, plus a simple linear regression **slope** of the last `N` ratio values
* **VIX**: value and slope across a user‑selected timeframe and lookback
* **Sessions (EST/EDT)**
* **Regular:** 09:30–16:00
* **Pre‑Market:** 04:00–09:30
* **After Hours:** 16:00–20:00
* **Extended‑hours extremes** combine **yesterday AH** + **today PM**
> **Note:** All session checks are done with TradingView’s `time(…,"America/New_York")` context. If your broker’s RTH differs (e.g., futures), adjust expectations accordingly.
---
## 5) How the algorithms work (plain English)
### A) Key Levels
* **Yesterday’s RTH High/Low**: scans yesterday’s bars within 09:30–16:00 and records the extremes + bar indices.
* **Extended Hours**: scans yesterday AH and today PM to get **yEHH/yEHL**. Script shows **either yEHH or PMH** (whichever is **higher**) and **either yEHL or PML** (whichever is **lower**) to avoid duplicate bands stacked together.
* **Value Area & POC (RTH only)**
* Build a coarse volume profile with `Max Volume Profile Points` buckets across the price range formed by yesterday’s RTH bars.
* Distribute each bar’s volume uniformly across the buckets it spans (fast approximation to keep Pine within execution limits).
* **POC** = bucket with max volume. **VA** expands from POC outward until **70%** of cumulative volume is enclosed → yields **VAH/VAL**.
### B) Market Breadth Table
* **NYSE/NASDAQ Ratio**: signed UVOL/DVOL with basic coloring.
* **VOLD Slopes**: from session open to current, normalized to human‑readable units; colors flip green/red based on thresholds that map to your normalization setting (e.g., ±2M for NYSE, ±3.5×10M for NASDAQ).
* **TICK/TICKQ Slope**: linear regression over the last `N` ratio points → **↗ / → / ↘** with the rounded slope value.
* **VIX Slope**: % change between now and `n` candles ago (optionally divided by `n`). Red when rising beyond threshold; green when falling.
---
## 6) Recommended presets
* **Stocks (liquid, intraday)**
* Value Area **ON**, `Max Volume Points` = **40–60**, **Timeframe** = **5–15**
* Breadth: show **NYSE & NASDAQ & VIX**, `Slope periods` = **5–8**, `Candles for rate` = **10–20**, **Normalize VIX** = **ON**
* **Index futures / very high‑volume symbols**
* If you see Pine timeouts, set `Max Volume Points` = **20–40** or temporarily **disable Value Area**.
* Keep breadth panel **ON** (it’s light). Consider **VIX timeframe = 15/30** for regime clarity.
---
## 7) Tips, edge cases & performance
* **Performance:** The volume profile is capped (`maxBarsToProcess ≤ 500` and bucketed) to keep it responsive. If you experience slowdowns, reduce `Max Volume Points`, `Maximum bars lookback`, or disable Value Area.
* **Redundant lines:** The script **intentionally suppresses** PMH/PML when yEHH/yEHL are more extreme, and vice‑versa.
* **Label visibility:** Use `Label style = none` if you only want clean lines and read values from the right‑end labels.
* **Futures/RTH differences:** Value Area is from **yesterday’s RTH** only; for 24h instruments the RTH period may not reflect overnight structure.
* **Session transitions:** PMH/PML tracking stops as soon as RTH starts; values persist as static levels for the session.
---
## 8) Known limitations
* Uses public TradingView symbols: `UVOL`, `VOLD`, `UVOLQ`, `DVOLQ`, `VOLDQ`, `TICK`, `TICKQ`, `VIX`. If your data plan or region limits any symbol, the corresponding table rows may show `na`.
* The VA/POC approximation assumes uniform distribution of each bar’s volume across its high–low. That’s fast but not a tick‑level profile.
* Works best on US equities with standard NY session; alternative sessions may need code changes.
---
## 9) Troubleshooting
* **“Script is too slow / timed out”** → Lower `Max Volume Points`, lower `Maximum bars lookback`, or toggle **OFF** `Enable Value Area calculations` for that instrument.
* **Missing breadth values** → Ensure the symbols above load on your account; try reloading chart or switching timeframes once.
* **Overlapping labels** → Set `Label style = none` or reduce label size.
---
## 10) Version / license / contribution
* **Version:** Initial public release (Pine v6).
* **Author:** © yelober
* **License:** Free for community use and enhancement. Please keep author credit.
* **Contributing:** Open PRs/ideas: presets, alert conditions, multi‑day VA composites, optional mid‑value (`(VAH+VAL)/2`), session filter for futures, and alertable state machine for breadth regime transitions.
---
## 11) Quick start (TL;DR)
1. Add the indicator and **keep default settings**.
2. Trade **reactions** at yHoD/yLoD/PMH/PML/VAH/VAL/POC.
3. Use the **breadth table**: look for **green ratios + ↗ slopes** (risk‑on) or **red ratios + ↘ slopes** (risk‑off). Check **VIX** slope for confirmation.
4. Manage risk around levels; when breadth flips against you, tighten or exit.
---
### Changelog (public)
* **v1.0:** First community release with automatic RTH levels, VA/POC approximation, breadth dashboard (NYSE/NASDAQ/TICK/TICKQ/VIX) with normalization and adaptive color thresholds.

NYSE Advancing Issues & Volume RatiosOverview
This comprehensive market breadth indicator tracks two essential NYSE ratios that provide deep insights into market sentiment and internal strength:
NYSE Advancing Issues Ratio
NYSE Advancing Volume Ratio
Dual Ratio Analysis
Issues Ratio: Measures the percentage of NYSE stocks advancing vs. total issues
Volume Ratio: Measures the percentage of NYSE volume flowing into advancing stocks
Both ratios displayed as easy-to-read percentages (0-100%)
Customizable Display Options
Toggle each ratio on/off independently
Choose from multiple moving average types (SMA, EMA, WMA)
Adjustable moving average periods
Custom color schemes for better visualization
Reference Levels
50% Line: Market neutral point (gray dashed)
10% Line: Extremely bearish breadth (red dotted)
90% Line: Extremely bullish breadth (green dotted)
Optional background highlighting for extreme readings
Smart Alerts
Cross above/below 50% (neutral) for both ratios
Extreme readings: Above 90% (strong bullish) and below 10% (strong bearish)
Real-time notifications for key market breadth shifts
📈 How to Interpret
Bullish Signals
Above 50%: More stocks/volume advancing than declining
Above 90%: Extremely strong market breadth (rare occurrence)
Divergence: Price making new highs while breadth weakens (potential warning)
Market Timing
Extreme readings (10%/90%) often coincide with market turning points
Breadth thrusts from extreme levels can signal powerful moves
Use with other technical indicators for enhanced timing

Instant Breakout Strategy with RSI & VWAPInstant Breakout Strategy with RSI & VWAP
This TradingView strategy (Pine Script v6) trades breakouts using pivot points, with optional filters for volume, momentum, RSI, and VWAP. It’s optimized for the 1-second timeframe.
Overview
The strategy identifies breakouts when price crosses above resistance (pivot highs) or below support (pivot lows). It can use basic pivot breakouts or add filters for stronger signals. Take-profit and stop-loss levels are set using ATR, and signals are shown on the chart.
Inputs
Left/Right Pivot Bars: Bars to detect pivots (default: 3). Lower values increase sensitivity.
Volume Surge Multiplier: Volume threshold vs. 20-period average (default: 1.5).
Momentum Threshold: Minimum % price change from bar open (default: 1%).
Take-Profit ATR Multiplier: ATR multiplier for take-profit (default: 9.0).
Stop-Loss ATR Multiplier: ATR multiplier for stop-loss (default: 1.0).
Use Filters: Enable/disable volume, momentum, RSI, and VWAP filters (default: off).
How It Works
1. Pivot Detection
Finds pivot highs (resistance) and lows (support) using ta.pivothigh and ta.pivotlow.
Tracks the latest pivot levels.
2. Volume Surge
Compares current volume to a 20-period volume average.
A surge occurs if volume exceeds the average times the multiplier.
3. Momentum
Measures price change from the bar’s open.
Bullish: Price rises >1% from open.
Bearish: Price falls >1% from open.
4. RSI and VWAP
RSI: 3-period RSI. Above 50 is bullish; below 50 is bearish.
VWAP: Price above VWAP is bullish; below is bearish.
5. ATR
14-period ATR sets take-profit (close ± atr * 9.0) and stop-loss (close ± atr * 1.0).
Trading Rules
Breakout Conditions
Bullish Breakout:
Price crosses above the latest pivot high.
With filters: Volume surge, bullish momentum, RSI > 50, price > VWAP.
Without filters: Only the crossover is needed.
Bearish Breakout:
Price crosses below the latest pivot low.
With filters: Volume surge, bearish momentum, RSI < 50, price < VWAP.
Without filters: Only the crossunder is needed.
Entries and Exits
Long: Enter on bullish breakout. Set take-profit and stop-loss. Close any short position.
Short: Enter on bearish breakout. Set take-profit and stop-loss. Close any long position.
Visuals
Signals: Green triangles (bullish) below bars, red triangles (bearish) above bars.
Pivot Levels: Green line (resistance), red line (support).
Indicators: RSI (blue, separate pane), VWAP (purple, on chart).
How to Use
Apply to a 1-second chart in TradingView for best results.
Adjust inputs (e.g., pivot bars, multipliers). Enable filters for stricter signals.
Watch for buy/sell triangles and monitor RSI/VWAP.
Use ATR-based take-profit/stop-loss for risk management.
Notes
Best on 1-second timeframe due to fast RSI and responsiveness.
Disable filters for more signals (less confirmation).
Backtest before live trading to check performance.
This strategy uses pivots, volume, momentum, RSI, and VWAP for clear breakout trades on the 1-second timeframe.

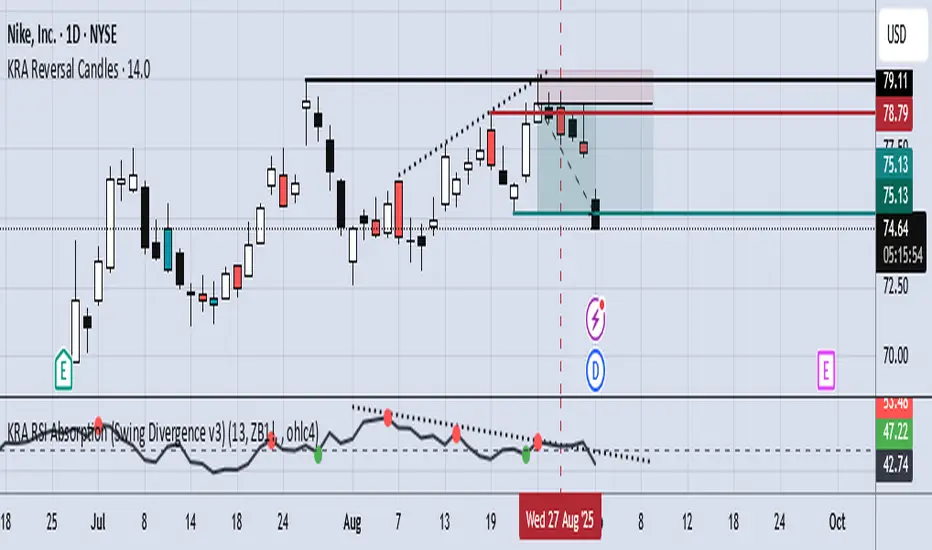
KRA Valuation ToolThe KRA valuation tool adds volume and market context (DXY) to RSI, making it more selective and potentially more reliable for reversals—but it trades fewer signals than a plain RSI. Essentially, it favors quality over quantity.
Pros:
Multi-factor confirmation – Combines RSI with volume and DXY trend to filter weak signals.
Contrarian alignment – Only triggers buys when RSI is oversold and DXY falling, sells when RSI is overbought and DXY rising, improving reversal accuracy.
Volume filter – Reduces false signals by ignoring low-volume periods.
50% midline – Helps identify neutral zones and trend shifts more clearly.
Visual signals – Bull/bear markers make it easier to spot setups at a glance.
Customizable – Inputs for RSI length, volume MA, and DXY symbol allow adaptation to different markets.
Accumulation Phase DetectorClean Accumulation Phase Indicator — Description
This TradingView indicator visually identifies the Accumulation Phase in price action, based on the Wyckoff methodology and volume-price analysis. The Accumulation Phase is where insiders or "smart money" gradually build positions before a significant price breakout.
Key Features:
Range Detection: The indicator calculates a price range over a configurable period (Range Length). It marks this range on the chart with red horizontal lines representing support and resistance.
Volume Spike Identification: It detects unusually high volume relative to the average volume over the same period (Volume Spike Multiplier). These spikes highlight potential insider buying activity.
Accumulation Phase Highlighting: When price action remains within the detected range and volume spikes occur, the indicator considers the market to be in an accumulation phase. Volume bars during this phase are colored blue for easy visualization.
Campaign Start & End Labels: The indicator places a "Campaign starts" label at the beginning of the accumulation phase and a "Campaign ends - warehouse full" label when the accumulation ends. This mimics the idea that insiders fill their “warehouses” before a breakout.
Breakout Detection: Once accumulation ends, the indicator monitors for a price breakout above the resistance level and places a "Breakout" label at the breakout bar.
How to Use:
Adjust the Range Length and Volume Spike Multiplier inputs to suit the timeframe and instrument you’re analyzing.
Watch for the blue volume bars within the red range lines to identify the accumulation phase.
Use the campaign labels to identify when the phase starts and ends.
Watch for the breakout label as a potential entry signal.

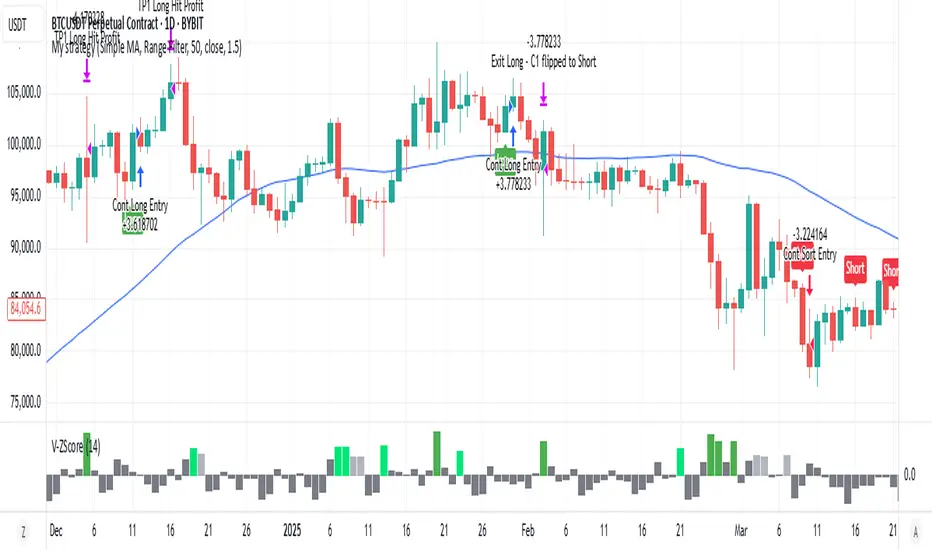
Volume Z-Score [T2][T69]🧠 Overview
This indicator calculates the Z-Score of volume to identify unusual trading activity, particularly those associated with whale-like behavior. It helps traders detect aggressive accumulation, distribution, or breakout setups based on volume anomalies relative to historical norms.
🔍 Features
Z-Score plot of volume using a configurable lookback.
Dynamic bar coloring based on Z-Score magnitude.
🐋 Small Whale marker appears when Z-Score exceeds +3.
Supports manual adjustment of sensitivity through lookback bars input.
🧪 Risk Level & Behavior Reference
🔥 Aggressive (10–14) - Fast signal, high sensitivity to volume spikes. Suitable for scalping or altcoin breakouts.
⚖️ Moderate (20–30) - Balanced filtering of noise vs real movement. Recommended for most swing traders.
🛡️ Conservative (40–60+) - Filters out noise. Reacts only to sustained large volume anomalies. Ideal for longer timeframes or large-cap coins.
⚙️ How to Use (NON DIRECTIONAL INDICATOR)
Use the Z-Score to gauge the strength of volume relative to recent history.
When Z-Score > 1.5 → Considered above-average activity.
When Z-Score > 3 → Marks a 🐋 Small Whale Move, potential for high-volatility follow-through.
Combine with price action, support/resistance, or OBV for confirmation.
⚠️ Limitations
This is a statistical signal, not directional.
Works best when paired with context: supply zones, trend bias, or large candle patterns.
🧠 Advanced Tips
Use multiple risk settings (e.g., 14 vs 50) on stacked indicators to track retail vs whale behavior separately.
Works well with low-float tokens and high-leverage exchange pairs like BTC/USDT (Bybit).
📝 Disclaimer
This script is provided for educational and analytical purposes only. Do your own research and manage your risk responsibly.
Intraday Bullish Scanner - Profit Ping📊 Intraday Bullish Scanner – Profit Ping Only
This custom-built TradingView script identifies high-probability intraday BUY signals on the 15-minute chart, confirmed by volume, momentum, and price action. It uses:
✅ EMA 7/14 crossovers
✅ Bullish candlestick patterns (Engulfing, Piercing, etc.)
✅ Volume spikes above 20-MA
✅ RSI between 55–65
✅ MACD histogram flip from red to green
✅ Cross-confirmation with the 30-minute trend
Once in a trade, it activates a dynamic trailing stop (starting at 2%, tightening to 1% as profit and volume increase). SELL signals are confirmed only with:
❌ MACD turning red
❌ Bearish RSI movement or drop below 50
❌ EMA 7 crossing below EMA 14
❌ A bearish candlestick (Engulfing or Piercing)
❌ Volume spike on a red candle
💰 When all SELL conditions align, a yellow triangle appears. BUYs are marked with a white triangle. Alerts can be connected directly to Python/webhook systems for full automation with IBKR.
Volume MA Breakout T3 [Teyo69]🧭 Overview
Volume MA Breakout T3 highlights volume bars that exceed a dynamic moving average threshold. It helps traders visually identify volume breakouts—periods of significant buying or selling pressure—based on user-selected MA methods (SMA, EMA, DEMA).
🔍 Features
Volume Highlighting: Green bars indicate volume breakout above the MA; red bars otherwise.
Custom MA Options: Choose between SMA, EMA, or Double EMA for volume smoothing.
Dynamic Threshold: The moving average line adjusts based on user-defined length and method.
⚙️ Configuration
Length: Number of bars used for the moving average calculation (default: 14).
Method: Type of moving average to use:
"SMA" - Simple Moving Average
"EMA" - Exponential Moving Average
"Double EMA" - Double Exponential Moving Average
📈 How to Use
Apply to any chart to visualize volume behavior relative to its MA.
Look for green bars: These suggest volume is breaking out above its recent average—potential signal of momentum.
Red bars indicate normal/subdued volume.
⚠️ Limitations
Does not provide directional bias—use with price action or trend confirmation tools.
Works best with additional context (e.g., support/resistance, candle formations).
🧠 Advanced Tips
Use shorter MAs (e.g., 5–10) in volatile markets for more responsive signals.
Combine with OBV, MFI, or accumulation indicators for confluence.
📌 Notes
This is a volume-based filter, not a signal generator.
Useful for breakout traders and volume profile enthusiasts.
📜 Disclaimer
This script is for educational purposes only. Always test in a simulated environment before live trading. Not financial advice.
High Volume Buyers/Sellers+High Volume Buyers/Sellers+
This indicator helps traders spot bars where unusually high or extreme volume occurs, indicating strong buying or selling pressure.
How it works:
Calculates a volume moving average (SMA) over a user-defined period.
Marks bars where the current volume exceeds:
High Volume Multiplier → small green circle (bullish) or red circle (bearish).
Extreme Volume Multiplier → small green up-triangle (bullish) or red down-triangle (bearish).
Settings:
Volume MA Period → Number of bars used to calculate the average volume.
High Volume Multiplier → Threshold to define high volume.
Extreme Volume Multiplier → Threshold to define extreme volume.
Show Extreme Volume Signals → Option to enable or disable extreme volume markers.
Usage tips:
Apply this indicator on a clean chart to visually highlight momentum bursts or exhaustion points.
It works well for both intraday and swing trading strategies where volume confirmation matters.
⚠ Note: This script only displays on-chart markers and does not plot any lines or indicators.

Volume-Time Imbalance (VTI)Volume-Time Imbalance (VTI) – Indicator Description
This indicator measures the imbalance between traded volume and the time elapsed between bars to identify unusual spikes in volume per second (volume per unit of time). Its purpose is to highlight volume movements that may indicate moments of strong interest, acceleration, or reversal in the market.
How it works:
It calculates the traded volume divided by the time (in seconds) elapsed since the previous bar — thus obtaining the volume per second.
An EMA (exponential moving average) of this volume per second is calculated to smooth the data.
The VTI value is the ratio between the current volume per second and this moving average, showing if the current volume is above what is expected for that pace.
The higher the VTI, the greater the imbalance between volume and time, indicating possible bursts of activity.
Settings:
VTI Moving Average Length: The period of the moving average used to smooth the volume per second (default is 20).
Alert Thresholds: Alert levels to identify moderate and high imbalances (defaults are 1.5 and 2.0).
Show VTI Histogram: Displays the VTI histogram in the indicator window.
Color Background: Colors the indicator background based on the strength of the imbalance (orange for moderate, red for high).
Show Alert Arrows: Shows arrows below the chart when a strong volume spike occurs (high alert).
Interpretation:
VTI values above the moderate level (1.5) indicate an unusual increase in volume relative to time.
Values above the high level (2.0) signal strong spikes that may anticipate significant moves or trend changes.
Use the colors and arrows as visual confirmations to quickly identify these moments.

HMA PLANz1. High Liquidity Candle Detection:
The indicator looks for candles with high liquidity (identified by comparing the current candle's volume with the highest volume of the last 10 candles).
If a candle has high liquidity, it is highlighted in yellow.
2. Midpoint Calculation of the Candle:
The midpoint of the candle is calculated by averaging the High and Low prices of the candle:
Midpoint
=
High
+
Low
2
Midpoint=
2
High+Low
3. Draw a Line at the Midpoint of the High Liquidity Candle:
A horizontal line is drawn at the calculated midpoint value of the high liquidity candle and continues for the next five candles.
4. Change Line Color Based on Price vs. Midpoint:
If the current price is above the midpoint, the line is drawn in green.
If the current price is below the midpoint, the line is drawn in red.
5. Moving Averages (MA):
In addition to liquidity analysis, the indicator calculates and plots two moving averages on the chart.
Users can choose between EMA, SMA, WMA, or HMA for each moving average.
Users can also select the source for the moving averages (Close, High, Low).
The length for each moving average is customizable.
6. Display Moving Averages with Labels:
The moving average lines are plotted on the chart.
Labels are displayed above each moving average to show its type and source (e.g., "MA - HMA (Close)").
Summary of Key Features:
High Liquidity Candle Detection: Highlighted in yellow.
Draw a Horizontal Line at the Midpoint of the high liquidity candle: The line color changes based on price relation to the midpoint.
Moving Averages: Allows customization of types and lengths.
Labels: Shows details of the moving averages.

Volume Pressure Histogram (Normalized)Overview
The Volume Pressure Histogram is designed to help traders analyze buying and selling pressure using real volume data.
Unlike traditional momentum indicators that rely solely on price movements, VPH measures the strength of bullish and bearish volume, providing insights into market participation.
How It Works
The histogram represents the difference between buying and selling volume over a selected period.
Green bars indicate strong buying pressure, while red bars signal strong selling pressure.
Lime and orange bars (if enabled) represent moderate buying and selling activity.
A white signal line smooths volume data to track momentum shifts over time.
How to Use It
Trend Confirmation: When price is rising and green bars increase, the trend is supported by real buying pressure.
Reversal Detection: If price makes a new high but green bars shrink, buyers may be losing strength.
Breakout Strength: A breakout with rising volume pressure confirms strong participation, while weak volume pressure suggests a potential fake move.
Divergence Signals: If price moves higher, but volume pressure declines, the move may lack conviction and could reverse.
Customization Options
Threshold Multiplier (default = 20) controls when green and red bars appear, filtering out weaker signals.
Log Scale Option helps normalize extreme volume spikes.
Adjustable Smoothing Length for both the histogram and signal line.
Why Use This Indicator
Provides a volume-based approach to analyzing market trends.
Can confirm or contradict price movements, helping identify strong or weak trends.
Works across multiple markets, including stocks, forex, crypto, and indices.
This indicator is designed for educational and informational purposes only and does not provide financial advice.

Delta SMA 1-Year High/Low Strategy### Summary:
This Pine Script code implements a trading strategy based on the **Delta SMA (Simple Moving Average)** of buy and sell volumes over a 1-year lookback period. The strategy identifies potential buy and sell signals by analyzing the relationship between the Delta SMA and its historical high/low thresholds. Key features include:
1. **Delta Calculation**:
- The Delta is calculated as the difference between buy volume (when close > open) and sell volume (when close < open).
- A 14-period SMA is applied to the Delta to smooth the data.
2. **1-Year High/Low Thresholds**:
- The strategy calculates the 1-year high and low of the Delta SMA.
- Buy and sell conditions are derived from thresholds set at 70% of the 1-year low and 90% and 50% of the 1-year high, respectively.
3. **Buy Condition**:
- A buy signal is triggered when the Delta SMA crosses above 0 after being below 70% of the 1-year low.
4. **Sell Condition**:
- A sell signal is triggered when the Delta SMA drops below 60% of the 1-year high after crossing above 90% of the 1-year high.
5. **Visualization**:
- The Delta SMA and its thresholds are plotted on the chart for easy monitoring.
- Optional buy/sell signals can be plotted as labels on the chart.
This strategy is designed to capture trends in volume-based momentum over a long-term horizon, making it suitable for swing or position trading.

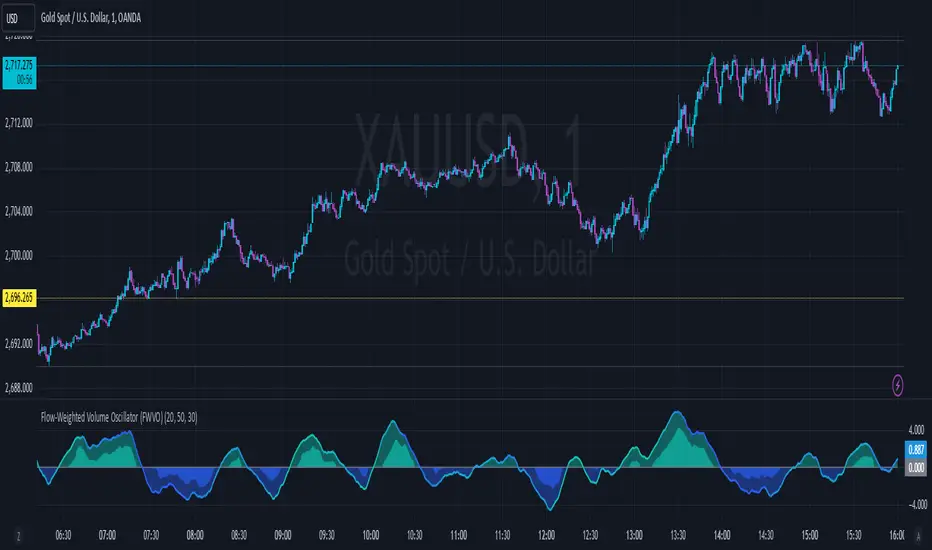
Flow-Weighted Volume Oscillator (FWVO)Volume Dynamics Oscillator (VDO)
Description
The Volume Dynamics Oscillator (VDO) is a powerful and innovative tool designed to analyze volume trends and provide traders with actionable insights into market dynamics. This indicator goes beyond simple volume analysis by incorporating a smoothed oscillator that visualizes the flow and momentum of trading activity, giving traders a clearer understanding of volume behavior over time.
What It Does
The VDO calculates the flow of volume by scaling raw volume data relative to its highest and lowest values over a user-defined period. This scaled volume is then smoothed using an exponential moving average (EMA) to eliminate noise and highlight significant trends. The oscillator dynamically shifts above or below a zero line, providing clear visual cues for bullish or bearish volume pressure.
Key features include:
Smoothed Oscillator: Displays the direction and momentum of volume using gradient colors.
Threshold Markers: Highlights overbought or oversold zones based on upper and lower bounds of the oscillator.
Visual Fill Zones: Uses color-filled areas to emphasize positive and negative volume flow, making it easy to interpret market sentiment.
How It Works
The calculation consists of several steps:
Smoothing with EMA: An EMA of the scaled volume is applied to reduce noise and enhance trends. A separate EMA period can be adjusted by the user (Volume EMA Period).
Dynamic Thresholds: The script determines upper and lower bounds around the smoothed oscillator, derived from its recent highest and lowest values. These thresholds indicate critical zones of volume momentum.
How to Use It
Bullish Signals: When the oscillator is above zero and green, it suggests strong buying pressure. A crossover from negative to positive can signal the start of an uptrend.
Bearish Signals: When the oscillator is below zero and blue, it indicates selling pressure. A crossover from positive to negative signals potential bearish momentum.
Overbought/Oversold Zones: Use the upper and lower threshold levels as indicators of extreme volume momentum. These can act as early warnings for trend reversals.
Traders can adjust the following inputs to customize the indicator:
High/Low Period: Defines the period for volume scaling.
Volume EMA Period: Adjusts the smoothing factor for the oscillator.
Smooth Factor: Controls the responsiveness of the smoothed oscillator.
Originality and Usefulness
The VDO stands out by combining dynamic volume scaling, EMA smoothing, and gradient-based visualization into a single, cohesive tool. Unlike traditional volume indicators, which often display raw or cumulative data, the VDO emphasizes relative volume strength and flow, making it particularly useful for spotting reversals, confirming trends, and identifying breakout opportunities.
The integration of color-coded fills and thresholds enhances usability, allowing traders to quickly interpret market conditions without requiring deep technical expertise.
Chart Recommendations
To maximize the effectiveness of the VDO, use it on a clean chart without additional indicators. The gradient coloring and filled zones make it self-explanatory, but traders can overlay basic trendlines or support/resistance levels for additional context.
For advanced users, the VDO can be paired with price action strategies, candlestick patterns, or other trend-following indicators to improve accuracy and timing.