The "Velocity and Acceleration Signals" indicator is a versatile tool designed to provide traders with valuable insights into price momentum and acceleration. By harnessing the power of mathematics and visualization, this indicator helps traders make informed decisions in the fast-paced world of financial markets.
Crunching the Numbers: How It Works
At its...
I created the Velocity Acceleration Convergence Divergence Indicator, and it is quite a mouthful if I do say so. I based this script on my two previous scripts: Velocity Indicator and Velocity Acceleration Indicator . This acts like a typical MACD but is much faster with the responses. This indicator is created by finding the difference between the Velocity...
The Velocity Acceleration Indicator was created by Scott Cong (Stocks and Commodities Sep 2023, pgs 8-15). This is another personal variation of his formula designed to capture the overall velocity acceleration of the underlying stock by applying the velocity formula to the original indicator to find the acceleration of the underlying velocity. I changed a few...
I have designed a "Price Acceleration" Indicator (PAI). It tracks the second derivative in price movements. This is different from ROC as that one measures Price Velocity rather than Acceleration. This Indicator should give you an idea of when the steam has come out of a move, or when one is getting started. For example, if RSI is reaching overbought, and PAI is...
Hello traders,
I developed this indicator while working on a trading strategy using moving average slope and acceleration, and I found the concept interesting enough to share it.
Let me briefly explain this indicator.
----About White Plot----
1. Calculate the first derivative approximation at the current point of the Moving Average, and then calculate the...
The Leavitt Convolution Slope indicator was created by Jay Leavitt (Stocks and Commodities Oct 2019, page 11), who is most well-known for creating the Volume-Weighted Average Price indicator. This indicator didn't have a good explanation or description so I custom-coded most of it. The way it works is it will give trend spikes in the direction of the underlying...
This is initially based on the MA Speed indicator from TradeStation () and expanded upon greatly. This implements 3 different variable MAs and calculates and plots both speed and acceleration of each. Also, a single line composite option is included for both speed and acceleration that changes color based on directional confluence of each MA's speed/acceleration....
The following oscillator is a twist on momentum, incorporating a 2nd derivative "acceleration" to help determine changes in momentum. Both are plotted directly accessing previous series values rather than using a moving average.
The script has an option to divide so the formula is d(Price)/d(Time), like a derivative. The script also provides options for the user...
Acceleration Bands
Description:
Acceleration Bands serve as a trading envelope that factor in an assets typical volatility over standard settings of 20 or 80 bars. They can be used across any time period, though traders prefer to use them most across weekly and monthly timeframes as breakout indicators outside these bands.
Using the shorter time frames can...
Volume is one piece of information that is often neglected, however, learning to interpret volume brings many advantages and could be of tremendous help when it comes to analyzing the markets. In addition to technicians, fundamental investors also take notice of the numbers of shares traded for a given security.
What is Volume?
The volume represents all the...
The script draws a moving average which responds to trend changes extraordinary fast!
It's calculated using Momentum, Acceleration and Probability (Psychological Effect) by interfering the Golden Ratio!
I got the idea thanks to Tradingview user DGT (dgtrd) and his/her excellent descriptions.
The indicator is simplified for users and the default settings work...
Hello folks!
In my search for new ways to get faster and better market responses, I found this brilliant Indicator here on Trading View.
I rewrite all the code with my own functions and styles.
So... This is my adaptation to excellent script "Momentum adjusted Moving Average by DGT" from the user dgtrd
In dgtrd's words: "A brand new Moving Average,...
A brand new Moving Average , calculated using Momentum, Acceleration and Probability (Psychological Effect).
Momentum adjusted Moving Average(MaMA) is an indicator that measures Price Action by taking into consideration not only Price movements but also its Momentum, Acceleration and Probability. MaMA, provides faster responses comparing to the regular Moving...
Renko is a very useful charting method for analyzing stock movement. It does a great job of filtering out all the excess noise so that all we're left with is pure price action. But, what about time? Time is a fundamental part of chart analysis and we are only seeing part of the picture. After all, shouldn't we take a very different approach to trading signals from...
Leavitt Projection, Convolution, & Acceleration by Cryptorhythms
Intro
Bringing you another open source Gem this time from the January 2020 Issue of TASC.
Description
In the article in the Oct 2019 TASC issue titled "An interplanetary marriage" author Jay Leavitt describes the evolution process required in strategy design by introducing his Mars strategy....
The Volatility Combo Bands are made from 4 separate volatility bands- two Bollinger Bands (10 and 20 period) and two Price Headley Acceleration Bands (10 and 20 period). The Volatility Combo Bands plot the innermost upper and lower points from these bands and then plots a mid-line. By default, only the standard 20 period Bollinger Bands and Combo Bands with...
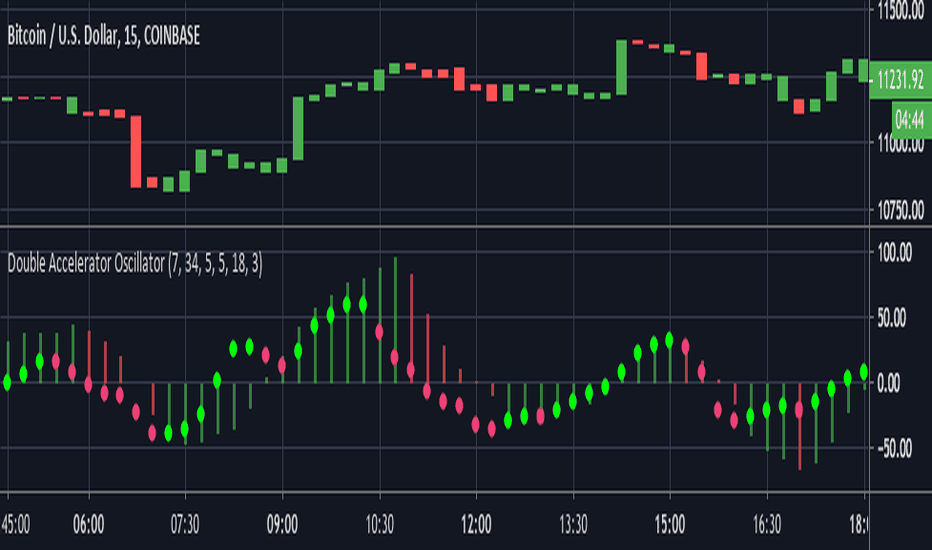
This is a modified version of Bill Williams' Accelerator. The Accelerator measures the difference between the Awesome Oscillator(another Williams indicator) and its 5 day SMA.
This script plots 2 accelerators rather than 1. Users can define the lengths of the fast and slow SMA's used in the Awesome Oscillator calculation by adjusting the options in the input...


![AAPL: Velocity Acceleration Convergence Divergence Indicator [CC]](https://s3.tradingview.com/o/omqgeClf_mid.png "Velocity Acceleration Convergence Divergence Indicator [CC]")

![AAPL: Velocity Acceleration Indicator [CC]](https://s3.tradingview.com/c/cQ6WRpbD_mid.png "Velocity Acceleration Indicator [CC]")


![AAPL: Leavitt Convolution Acceleration [CC]](https://s3.tradingview.com/5/5x8iM9U6_mid.png "Leavitt Convolution Acceleration [CC]")