Scalping Acciones PRO (Entradas + TP + SL) leo
How to use it correctly
• Timeframe: 1m or 5m
• High-volume stocks (SPY, AAPL, TSLA, NVDA…)
• Take Profit (TP): VWAP or EMA 21
• Stop Loss (SL): low/high of the signal candle
⸻
If you want, in the next message I can:
• 🔧 add automatic Stop Loss and Take Profit
• 🚀 convert it into a strategy (Strategy Tester)
• 🎯 filter only strong reversals (fewer false signals)
Indikatoren und Strategien

Gold Smart Scalper AI V21. The "Red Zone" (News Management)
The strategy logic does not "know" when the Federal Reserve is speaking.
Rule: Disable the strategy or stop taking signals 15 minutes before and after high-impact news (CPI, NFP, FOMC).
Why: During these times, Gold can move $30 in seconds. Slippage will cause your $1.50 Stop Loss to execute much further away, leading to massive drawdown.
2. Session Selection
Gold "Scalping" requires high liquidity and tight spreads.
Discretionary Filter: Only trade during the London/New York overlap (13:00 – 17:00 UTC).
Avoid: The late Asian session or Sunday market open. Spreads often widen to $0.50–$1.00, meaning you are already down 30-50% of your Stop Loss the moment you enter.
3. Market "Mood" (Trend vs. Range)
Trend Context: If the 50 EMA (the White line) is completely flat, the market is in a "Bracket." In this state, EMA crossovers generate many false signals.
The Adjustment: Discretionary traders wait for the 50 EMA to show a clear slope (up or down) before trusting the 9/21 crossover signals.

Hosoda ZHosoda’s Clouds is a trend-following strategy designed to trade only long positions in traditionally trending markets with a strong bullish bias: SPY(D); DJI (D); NDX (D); XAUUSD (D); Tesla (D, H4, H1); AAPL (D, H4, H1); GOOG (D, H4); META (D, H4); NVDA (D, H4); AMZN(D, H4).
Strategy Parameters
Initial Capital: $10,000 USD.
Position Size: Risks 10% of your equity per trade.
Commission: 0.1%
Indicators
The strategy combines two main technical tools:
A. Ichimoku Cloud This is the core of the strategy. It calculates the classic lines:
• Tenkan-sen (Fast Line): Average of the highest high and lowest low of the last 9 periods.
• Kijun-sen (Base Line): Average of the last 26 periods.
• Cloud (Senkou Span A and B): Projects future support/resistance.
B. EMA 500 (Trend Filter)
• A 500-period Exponential Moving Average is calculated.
• Function: Serves as a very long-term trend filter. If the price is above the EMA 500, the market is considered bullish in the long term.
Entry Rules
• Bullish Cross (Bull Cross): The fast line (Tenkan) crosses above the base line (Kijun). This is the classic Ichimoku entry signal.
• Trend Filter (Optional):
•If you check the "Enable EMA Filter" box in the options, the system will only buy if the closing price is above the EMA 500.
•If the box is unchecked, it will ignore the EMA and buy based solely on the Ichimoku cross.
Exit Rules
A. Stop Loss (Loss Protection) It is a dynamic Stop Loss based on market structure, not a fixed percentage.
• At the moment of entry, the code looks back 12 bars (configurable in sl_bars_back) and finds the lowest price (low).
• It places the Stop Loss at that minimum level.
• Visual: Draws a dotted red line on the chart showing where your Stop Loss is.
B. Technical Take Profit (Exit due to Weakness) Lets profits run until the trend shows weakness.
• Condition: Closes the trade if the Tenkan line crosses below the bottom of the Cloud .
• This means short-term momentum has been lost and the price has entered or crossed below the cloud.
Statistics Panel
In the top right corner, the code draws a table (Panel) that updates in real-time or at the end of Backtesting. It shows:
• Total P&L: Net profit or loss in dollars.
• Win Rate: Percentage of winning trades.
• Trades: Total number of trades executed.
Summary
1. The script waits for the blue line (Tenkan) to cross over the red line (Kijun).
2. It verifies if the price is above the orange line (EMA 500) (if the filter is active).
3. If so, it BUYS.
4. It immediately places a Stop Loss at the low of the last 12 candles (red dotted line).
5. It keeps the trade open until the Stop Loss is hit or until the Tenkan line drops below the Cloud.
Customizable Settings
• Whether to use the EMA filter or not.
• The EMA length (default is 500).
• The Ichimoku periods (9, 26, 52 are standard).
• How many bars to look back to set the Stop Loss.

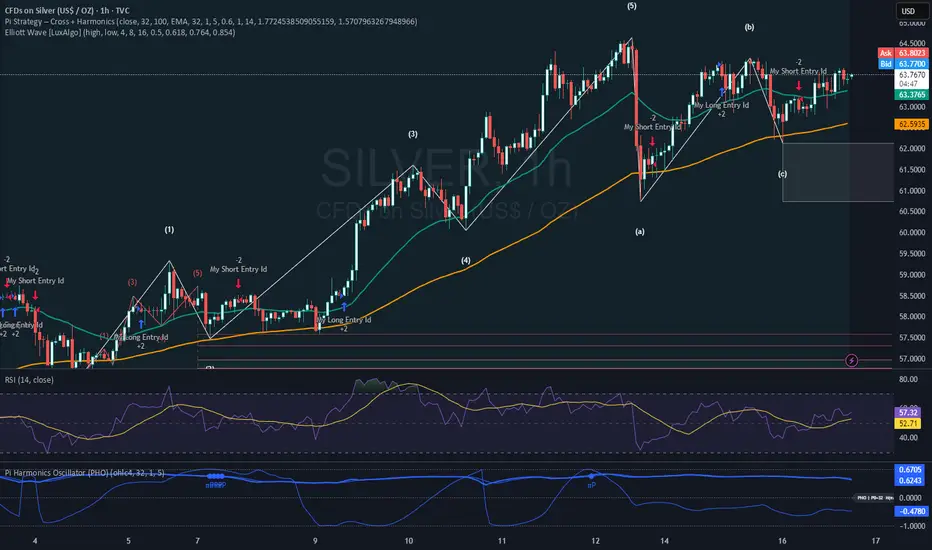
Pi Strategy Cross Harmonicsstill customizing this one, buy and sell seems to off on alternate time settings.
a work in progress, see if this works for anyone.
thanks again.
HSI Long & Short: BG + EMA330Strategy: HSI 5-min mean-reversion with EMA10/20 crossover and EMA330 filter.
Background green (EMA10 > EMA20) or red (EMA10 < EMA20).
Long entry: Background turns green AND price below EMA330.
Short entry: Background turns red AND price above EMA330.
Exit long: Background turns red.
Exit short: Background turns green.
No new entries 15:01–16:00 HKT.
Reverses position on signals; 100% equity per trade.

Buy the dips StrategyThis strategy getting in long position only after the price drop- Buy the dips
The % of the drop is Determined by SMA for the first trade
The inputs of SMA and % of the drop can be adjust from the User
After that Strategy start taking safe trades if not take profit from the first trade
The safe trades are Determined by step down deviation % and by quantity
There is no Stop loss is not for one with small tolerance to getting under
if any question ask

ZLSMA AO Session Strategy by kernchentradingStrategy Logic
Trend Filter:
The ZLSMA is used to determine the prevailing short-term direction. Long signals are only considered when price is above the ZLSMA, while short signals are only considered when price is below it.
Momentum Confirmation:
The Awesome Oscillator is used to detect momentum shifts. Entries occur only when a multi-period sequence of rising or falling AO values is present, indicating the start of a new impulse.
Entries:
Long: Positive momentum in the AO combined with price trading above the ZLSMA
Short: Negative momentum in the AO combined with price trading below the ZLSMA
Only one position per direction is held at any time.
Exits:
Positions are closed when momentum weakens according to the AO or when a predefined pip threshold is reached.
Trading Hours:
The strategy uses a time filter and trades only during specified hours to avoid periods of low liquidity.
Parameters
ZLSMA length and offset
Position size (volume)
Timeframe and Notes:
I trade Gold using this strategy on the 5-minute and 15-minute charts. In flat, sideways market conditions, the ZLSMA has weaknesses. In such cases, it can be helpful to use an additional trend strength indicator (e.g., TSI). In general, the greater the distance between price and the ZLSMA, the more reliable the signal tends to be.

Third eye Strategy v3.1 DogeThird eye • Strategy v3.1 Doge Third eye • Strategy v3.1 Doge Third eye • Strategy v3.1 Doge
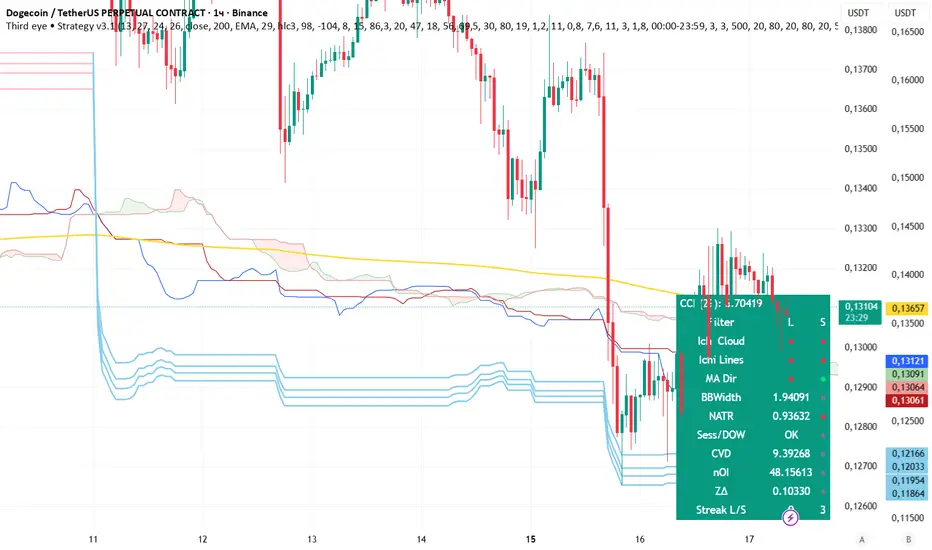
Third eye Strategy v3.1Third eye Strategy v3.1 DogeThird eye Strategy v3.1 DogeThird eye Strategy v3.1 Doge

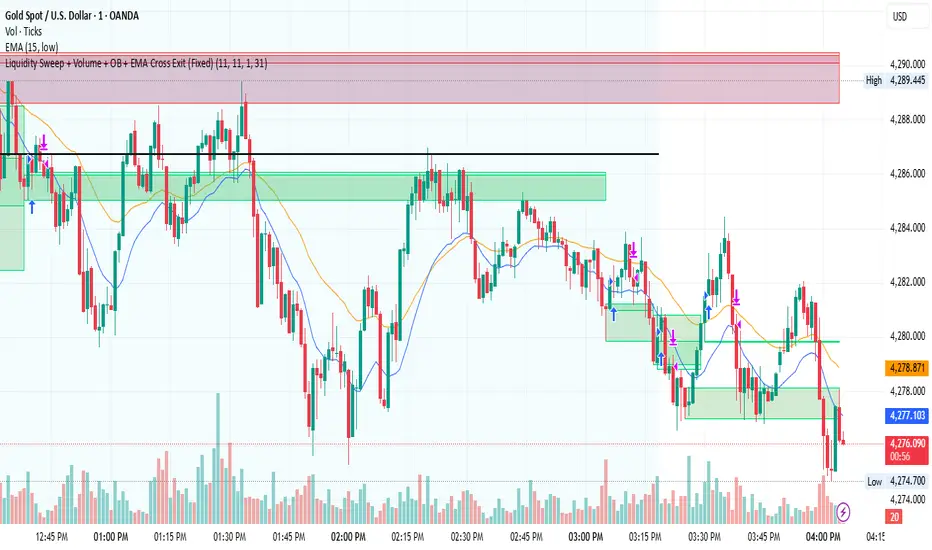
Liquidity Sweep + Volume + OB + EMA Cross Exit This strategy is a smart-money–inspired trading system designed to capture high-probability reversals after liquidity is taken from the market.
It combines liquidity sweeps, volume confirmation, order block validation, and a dynamic EMA-based exit to control risk and let profits run.
Core Concept
Institutions first take liquidity, then move price in the real direction.
This strategy aims to enter after liquidity is swept and price shows confirmation.
1️⃣ Liquidity Sweep Detection
2️⃣ Volume Confirmation
3️⃣ Order Block Identification
4️⃣ EMA Trend Filter (Optional Entry Bias)
5️⃣ Trade Entry Logic
6️⃣ Exit Strategy – EMA Cross Exit
Benefits:
Lets strong trends run
Exits automatically when momentum weakens
Adapts to different market conditions
🛡 Risk & Trade Management
One trade at a time (anti-overtrading logic)
Early exit if trade moves against position after a few bars
Opposite signal forces exit
EMA cross provides trend-based exit
rj's temu perp pair tradeOverview
rj’s temu perp pair trade is a simple, robust pairs-trading strategy designed for crypto perpetual futures, implemented directly on ratio charts (A / B) in TradingView.
The strategy trades mean reversion in relative price using Bollinger Bands, while keeping sizing, execution logic, and diagnostics intentionally simple and transparent.
This script is designed primarily for signal research and pair selection, not for fully accurate two-leg PnL simulation inside TradingView.
Strategy Concept
The strategy operates on a ratio chart:
Asset A / Asset B
The ratio represents relative performance between two assets.
Core idea
When the ratio deviates significantly from its recent mean, it tends to revert. (if you pick stuff that has very similar drivers and little insider trading flows.
Bollinger Bands provide a simple, robust way to define “too far”.
Entry Logic
Using Bollinger Bands on the ratio price:
Long ratio
Ratio crosses below the lower band
Interpreted as A cheap vs B
Short ratio
Ratio crosses above the upper band
Interpreted as A expensive vs B
Entries are generated on bar close, with fills occurring on the next bar open (TradingView’s internal behavior).
Exit Logic
Positions are closed when any of the following occurs:
Ratio crosses back through the Bollinger midline
Position held longer than maxBarsInTrade (optional)
Fixed % stop based on ratio price (optional)
Each exit is explicitly labeled on the chart:
C → mean reversion
TS → time stop
SL → stop loss
Position sizing and margin
Positions are sized as a percentage of Strategy Tester equity
Default: 10% of equity per trade
This ensures consistent risk within TradingView, even on ratio charts
Mating requirements are set to 1% for long/short to disable margin rejections for research purposes.
What TradingView PnL means (important)
When trading ratio charts, TradingView treats the ratio as a single synthetic instrument.
PnL is reported in the denominator (quote) unit e.g. on UNI / SUSHI, PnL is in SUSHI
Strategy Tester does not simulate two legs
Absolute PnL, Sharpe, and drawdowns are not USDT-accurate
This script intentionally does not attempt to convert PnL into USDT inside TradingView.
Instead:
TradingView is used for signal behavior, regime analysis, and pair comparison
Accurate two-leg USDT PnL should be computed externally
Summary Table
The on-chart summary table reports Strategy Tester-aligned metrics only:
Total PnL (%)
Number of closed trades
Win rate
Average PnL per trade
Sharpe ratio (annualized, based on Strategy Tester equity)
PnL units (syminfo.currency)
These metrics are internally consistent but should be treated as indicative, not execution-accurate.
Recommended workflow
Inside TradingView
Use this script to:
Explore pair behavior
Validate mean-reversion dynamics
Study regime dependence
Compare relative signal quality across pairs
Outside TradingView
Use exported trade data to:
Aggregate daily PnL
Normalize by initial capital
Apply portfolio weights
Vol-target and analyze drawdowns
Add funding, fees, and execution logic
Limitations
This script does not:
Simulate two-leg execution
Account for funding rates
Model fees or slippage per leg
Provide USDT-accurate PnL
It is not a trading system. It is a clean, robust research and signal-generation tool.

GOLD 5m PA ScalperXAUUSD 5-Minute Price Action Scalper with HTF Confirmation
This Pine Script is a trend-following scalping strategy designed specifically for XAUUSD (Gold) on the 1,3,5-minute timeframe.
Its main goal is to reduce noise and false signals by combining lower-timeframe price action with higher-timeframe (15-minute) structure.
CORE IDEA
Trade only in the direction of the dominant trend and only when price reacts from a strong higher-timeframe Order Block.

EURUSD | Yield Curve Flip Strategy (2s10s State Flips)Strategy Core (Concept)
The strategy trades EURUSD exclusively when the US yield curve regime (2Y/10Y) flips into a new, clearly bullish or bearish regime. The core assumption is that re-pricing in the US yield curve (rather than individual data points) is a robust driver of USD strength or weakness and can act as a structural trigger for trend changes.
⸻
Data Basis
• Uses US 2Y Yield (TVC:US02Y) and US 10Y Yield (TVC:US10Y).
• The 2s10s curve is calculated as:
curveUS = US10Y – US2Y
• Regime assessment is based on the N-day change (default: 5 days), calculated on true rates bars (not intraday noise).
⸻
Regime Detection (Correct Bond Logic)
First, the strategy checks whether the curve has significantly steepened or flattened over the lookback period:
• Steepener if Δ(2s10s) > thrCurve (default: +0.10 percentage points = 10 bp)
• Flattener if Δ(2s10s) < −thrCurve
Next, a leg confirmation determines the specific type of steepener/flattener (default thrLeg = 5 bp):
Bull Steepener
• Curve steepens because yields fall, with the 2Y falling more (risk-off / rate-cut pricing)
Bear Steepener
• Curve steepens because yields rise, with the 10Y rising more (reflation / term-premium move)
Bull Flattener
• Curve flattens because yields fall, with the 10Y falling more (growth shock / long-end rally)
Bear Flattener
• Curve flattens because yields rise, with the 2Y rising more (hawkish repricing / front-end up)
Important: By default, a Bear Steepener is not treated as a bearish signal, unless allowBearSteepForShort is enabled.
⸻
State Machine (Memory + Flip Triggers)
The strategy maintains a persistent state variable curveState:
• +1 = bullish
• −1 = bearish
• 0 = neutral
The state is updated only on a new rates bar (daily rates when tfRates = "D"), avoiding intraday noise.
A trade is generated only on a true regime flip:
• flipToBull: new state turns bullish and the previous state was bearish (or neutral, if allowed)
• flipToBear: new state turns bearish and the previous state was bullish (or neutral, if allowed)
The option enterFromNeutral controls whether the first clear regime emerging from neutral is traded.
The option onlyOnNewRatesBar ensures signals occur only when a new rates bar is printed, providing clean timing.
⸻
Trading Rules (Entry / Exit)
There are no stops, targets, or trailing mechanisms. The strategy is a pure regime-switching / reversal system:
• On flipToBull
• Close short (“S”)
• Open long (“L”)
• On flipToBear
• Close long (“L”)
• Open short (“S”)
Positions are therefore held until the next regime flip.
⸻
Parameter Interpretation
• N: Smoothing / inertia. Smaller = faster but noisier; larger = more stable but later.
• thrCurve: Minimum curve move required to define a regime.
• thrLeg: Minimum move of the confirming leg (2Y or 10Y) to reduce misclassification.
• allowBearSteepForShort: Makes the system more aggressive (more bearish signals), but represents a different macro case.
• enterFromNeutral: Increases trade frequency by trading the first regime impulse.
⸻
What You See on the Chart
• Background shading:
• Green for bullish state
• Red for bearish state
• The curve and Δ-curve are plotted but hidden (display=none), mainly for debugging and analysis.

ICT FVG + BPR + Liquidity StrategyICT-Based Strategy combining:
• 4H Fair Value Gaps (FVG) for directional bias
• Balanced Price Range (BPR) zones for entry refinement
• PDH/PDL liquidity sweeps for confirmation
• Daily swing high/low structure
• London session time windows (07:45-11:45 & 14:00-14:45 GMT)
• High-volume liquidity zone detection
• Trailing stops at 1R increments
Features:
✓ 15+ years backtested (2010-2025)
✓ Works on GBPUSD, GBPJPY, USDCAD
✓ Asymmetric risk/reward (1R-10R winners vs -1R losses)
✓ Automated entry/exit signals
✓ Full risk management (1% per trade)
Best for: Personal accounts, swing trading, education
Prop firm modifications included in comments.
Free to use & modify - Share improvements!
Created by: BacktestBay

225 SMA CrossoverWell-known strategy from Zahlengraf from the Mauerstrassenwetten subreddit for you to test yourself.
You can change the length of the SMA and whether to trade long, short or both directions.

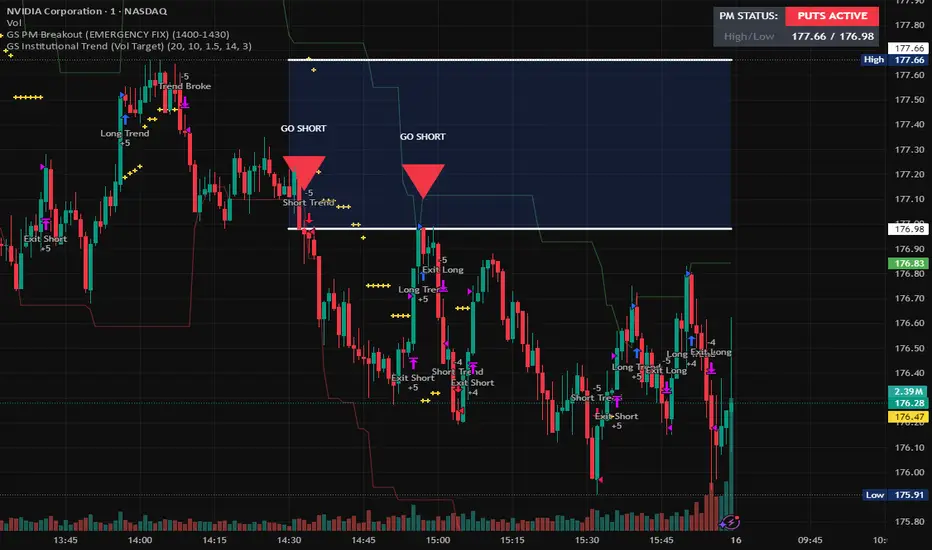
GS Institutional Trend (Vol Target)hedge fund strategy used on a 4 hour chart with a purple bar warning to signal dangerous volitilaty. this strategy will lose money in choppy sideways markets.
Improved Candle Strategy (without daily squared)# Candle Pattern Trading Strategy
## Core Logic
Analyzes the last 5 candlesticks to identify "close at high" and "close at low" patterns, generating long/short signals.
## Trading Conditions
- **Long**: ≥2 bars closed at high in past 5 bars + current bar closes at high → Open long
- **Short**: ≥2 bars closed at low in past 5 bars + current bar closes at low → Open short
- **Filter**: If ≥3 doji patterns detected, skip trading
## Risk Management
- Stop Loss: Based on entry bar's high/low
- Take Profit: Risk × 2x multiplier
- Cooldown: No trading for 2 bars after entry
- Session Filter: No trading for first 5 bars after market open
## Configurable Parameters
- Lookback period, doji threshold, close proximity ratio, TP/SL ratio, cooldown bars, etc.
**Use Cases**: 1-minute and higher timeframes on stocks/futures

Estrategia Momentum Seguro (EMS) Entry and exit signals, this indicator helps or suggests where to enter, exit, or place a stop loss.

Supertrend + EMA + RSI Algo (Low Risk High Accuracy)This is a trend-following + momentum confirmation strategy designed to reduce false signals and control loss.
Supertrend (10,3) → Identifies overall market direction (Buy in uptrend, Sell in downtrend)
EMA 50 & EMA 200 → Confirms strong trend and avoids sideways market
Buy only when EMA 50 is above EMA 200
Sell only when EMA 50 is below EMA 200
RSI (14) → Confirms momentum
Buy when RSI > 55 (strong bullish momentum)
Sell when RSI < 45 (strong bearish momentum)
---
🔹 Entry Logic
BUY: Market is in uptrend + strong momentum
SELL: Market is in downtrend + strong bearish pressure
---
🔹 Risk Management (Most Important)
Stop Loss: Based on ATR (adapts to volatility)
Target: Fixed Risk-Reward ratio (example: 1 : 2.5)
This keeps loss small and profits larger
---
🔹 Best Use Case
Works best in trending markets
Ideal timeframes: 15m, 1h, 4h
Suitable for crypto futures & swing trading
Beginner-friendly if used with low leverage

10>20,p>50 DEMARenders daily EMA, 10, 20 and 50 on any timeframe below 1D
30m timeframe works well.
Use trend of 10 > 20 + price > 50 for long and 10 < 20 + price < 50 for shorts or exits.

BXTrender Strategy Option Test bxtrender strategy.
- shows daily weekly and monthly bxtrender indicator in one go
- monthly and weekly crossover strategy

Tailwind.(BTC)Imagine the price of Bitcoin is like a person climbing a staircase.
The Steps (Grid): Instead of watching every single price movement, the strategy divides the market into fixed steps. In your configuration, each step measures **3,000 points**. (Examples: 60,000, 63,000, 66,000...).
The Signal: We buy only when the price climbs a full step decisively.
The "Expensive Price" Filter: If the price jumps the step but lands too far away (the candle closes too high), we do not buy. It is like trying to board a train that has already started moving too fast; the risk is too high.
Rigid Exits: The Take Profit (TP) and Stop Loss (SL) are calculated from the edge of the step, not from the specific price where you managed to buy. This preserves the geometric structure of the market.
The Code Logic (Step-by-Step)
A. The Math of the Grid (`math.floor`)
pinescript
level_base = math.floor(close / step_size) * step_size
This is the most important line.
What does it do? It rounds the price down to the nearest multiple of 3,000.
Example: If BTC is at 64,500 and the step size is 3,000:
1. Divide: $64,500 / 3,000 = 21.5$
2. `math.floor` (Floor): Removes the decimals $\rightarrow$ remains $21$.
3. Multiply: $21 * 3,000 = 63,000$.
Result: The code knows that the current "floor" is **63,000**, regardless of whether the price is at 63,001 or 65,999.
B. The Strict Breakout (`strict_cross`)
pinescript
strict_cross = (open < level_base) and (close > level_base)
Most strategies only check if `close > level`. We do things slightly differently:
`open < level_base`: Requires the candle to have "born" *below* the line (e.g., opened at 62,900).
`close > level_base`: Requires the candle to have *finished* above the line (e.g., closed at 63,200).
Why? This avoids entering on gaps (price jumps where the market opens already very high) and confirms that there was real buying power crossing the line.
C. The "Expensive Price" Filter (`max_dist_pct`)
pinescript
limit_price_entry = level_base + (step_size * (max_dist_pct / 100.0))
price_is_valid = close <= limit_price_entry
Here you apply the percentage rule:
-If the level is 63,000 and the next is 66,000 (a difference of 3,000).
-If `max_dist_pct` is **60%**, the limit is $63,000 + (60\% \text{ of } 3,000) = 64,800$.
-If the breakout candle closes at **65,000**, the variable `price_is_valid` will be **false** and it will not enter the trade. This avoids buying at the ceiling.
D. TP and SL Calculation (Anchored to the Level)
pinescript
take_profit = level_base + (step_size * tp_mult)
stop_loss = level_base - (step_size * sl_mult)
Note that we use `level_base` and not `close`.
-If you entered because the price broke 63,000, your SL is calculated starting from 63,000.
-If your SL is 1.0x, your stop will be exactly at 60,000.
This is crucial: If you bought "expensive" (e.g., at 63,500), your real stop is wider (3,500 points) than if you bought cheap (63,100). Because you filter out expensive entries, you protect your Risk/Reward ratio.
E. Visual Management (`var line`)
The code uses `var` variables to remember the TP and SL lines and the `line.set_x2` function to stretch them to the right while the operation remains open, providing that visual reference on the chart until the trade ends.
Workflow Summary
Strategy Parameters:
Total Capital: $20,000
We will use 10% of total capital per trade.
Commissions: 0.1% per trade.
TP: 1.4
SL: 1
Step Size (Grid): 3,000
We use the 200 EMA as a trend filter.
Feel free to experiment with the parameters to your liking. Cheers.
