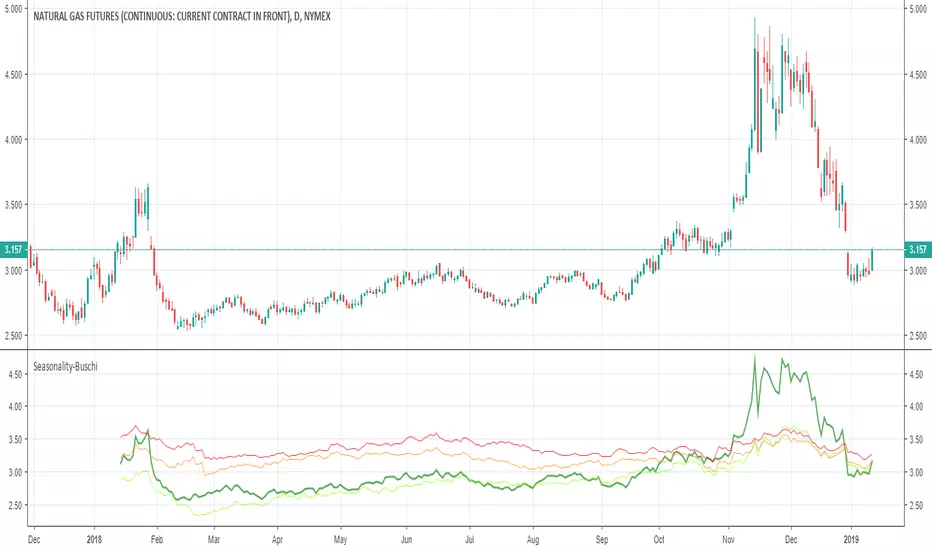
Seasonality-Buschi
English:
This script shows the price development over the last year (default: green) and mean prices over the last three (default: light green), six (default: orange) and nine (default: red) years and is therefore at least some kind of approach towards true seasonality.
Thanks to user "apozdnyakov" for providing most of the code!
Deutsch:
Dieses Skript zeigt den Kursverlauf über das letzte Jahr (Standard: grün) und die durchschnittlichen Verläufe über die letzten drei (Standard: hellgrün), sechs (Standard: orange) und neun (Standard: rot) Jahre und stellt damit zumindest eine Annäherung zu einer echten Saisonalität dar.
Dank an User "apozdnyakov", der den Großteil des Codes zur Verfügung gestellt hat!
[i]price
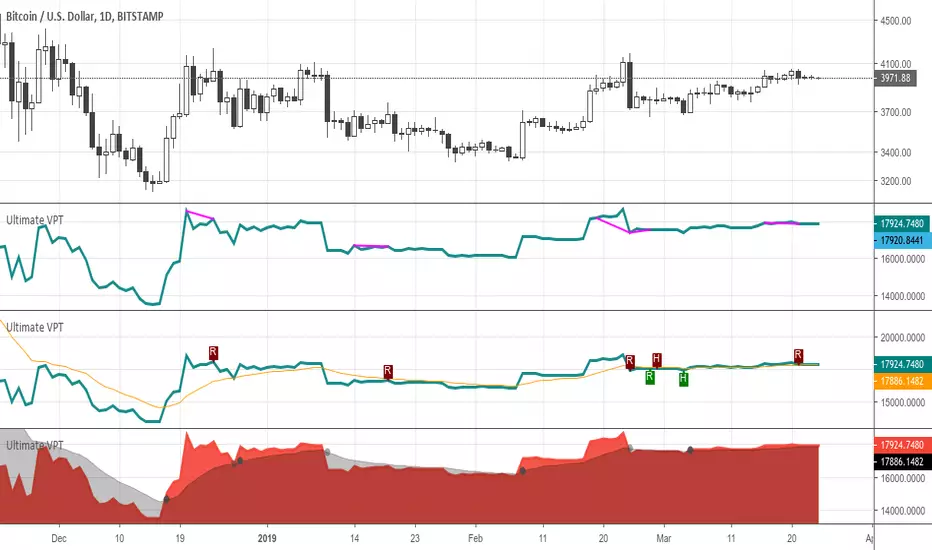
Ultimate Volume Price Trend (VPT)This is a Premium Indicators for Professional Traders willing to dig into Volume-Price Trend (VPT) studies.
The Ultimate VPT indicator allows to source the volume from 5 different sources :
Current Exchange (All markets: crypto and legacy)
Aggregated from Unleveraged Exchanges (check below available markets)
Aggregated from Leveraged Exchanges (check below available markets)
Aggregated from All Exchanges (check below available markets)
Aggregated from Custom Selection of Exchanges (check below available markets)
On this first release you can aggregate the volume from the following markets:
BTCUSD
ETHUSD
ETHBTC
The Ultimate VPT indicator helps to spot divergences (experimental):
Regular divergences
Hidden divergences
Real time potential divergences
Highlight the divergence drawing a line, a dot or a label
Customize the looking of the divergences notification
The Ultimate VPT indicator also allows plotting a signal line :
Create a Signal Line based by smoothing the oscillator
Select between multiple smoothing methods: SMA, EMA, DEMA, TEMA, WMA, VWMA, SMMA, HULLMA, TMA
Customize the Signal Line Period
Highlight the crosses between the Oscillator and the Signal Line
The Ultimate VPT indicator includes preset tradingview alerts :
Custom alerts to notify crosses with Signal Line
Custom alerts to notify divergences
The Ultimate VPT indicator includes preset tradingview alerts :
Custom alerts to notify crosses with Signal Line
Custom alerts to notify divergences
Additional features:
Full customization of the look and feel of the indicator
Hinting of Low volatility
Label of the line for better reference
This indicator is meant to be used by a private group of professional traders. If you would like to subscribe, please send me a private message.
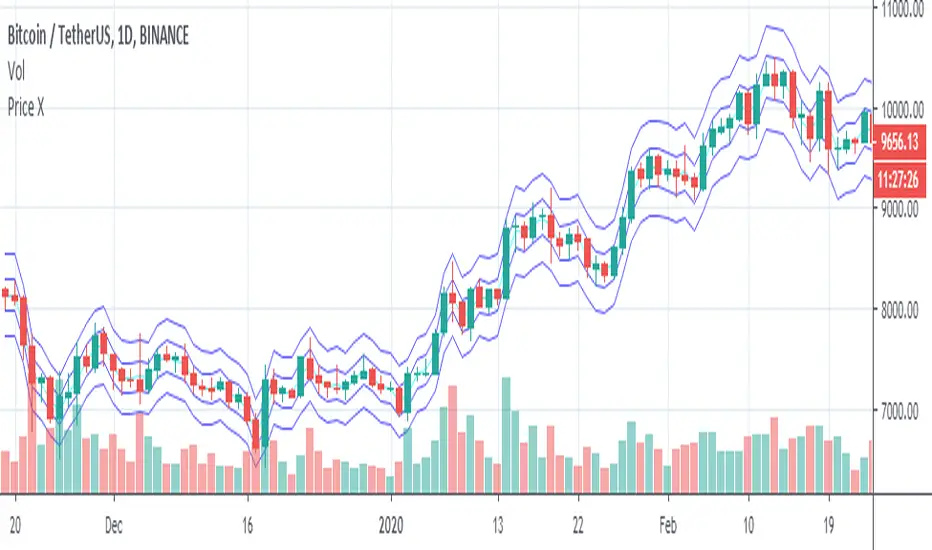
Priceit plots
ema - you can choose length
it plots a custom price say x
it plots price x*factors >
1.0005* price
1.001* price
0.9995* price
0.999* price
1.002* price
1.004* price
1.006* price
1.008* price
1.010* price
1.012* price
you can edit these , the scrip is open source
it plots ohlc4 and ohlc4* factors
1.0005* ohlc4
1.001* ohlc4
0.9995* ohlc4
0.999* ohlc4
you can edit these , the scrip is open source
Blockchain Rhythms by Cryptorhythms🎼 Blockchain Rhythms v1.0 by Cryptorhythms
This indicator and data plot suite is for bitcoin BTCUSD analysis over longer periods and higher time frames. 🚨For this to plot anything you must use on Daily or higher timeframe🚨 .
You want to have an alternative to the typical technical indicators you see everywhere? This is it. Seen crypto twitter talking about/using all sorts of indicators you have never seen before on tradingview? Here you go. Are you a long term investor and not a short term speculator?... I think you get the picture...
With the wealth of data here, I cannot go into a fully detailed analysis for every indicator. Please make liberal use of google and as always DYOR before trading on a system you have never used.
These indicators are best observed versus a logarithmic price scale. If I have missed any indicators you think should be in here let me know! Let me preempt that by saying MVRV and UTXO Age Distribution are not possible to create on Tradingview at this time.
🚧Error Screen:
If you see this you need to choose a data-point or indicator to plot!
⌚If you are loading this indicator with alot of chart history shown (as in the example screenshots) it may take up to a minute to load.
Please note: some of the screenshots below show chart title plots which I subsequently had to remove due to limitations. If you would like a title for all the plot, simple use the Indicator Labels checkbox option located in the scales tab of chart settings.
[b📊 Fundamental Blockchain Indicators
NVT Signal & Ratio
Both are related. NVT / NVT Signal can be interpreted as the strength of market confidence in the means of payment / settlement layer narrative. A “measure of the chain’s strength as a payment network compared to its market value — a low NVT may suggest that a network is undervalued compared to the service it is providing as a settlement layer” (Matteo Leibowitz).
💰NVT Ratio:
NVT Ratio (Network Value to Transactions Ratio) is similar to the PE Ratio used in equity markets.
When Bitcoin`s NVT is high, it indicates that its network valuation is outstripping the value being transmitted on its payment network, this can happen when the network is in high growth and investors are valuing it as a high return investment, or alternatively when the price is in an unsustainable bubble.
🚦NVT Signal:
NVT Signal (NVTS) is a derivative of NVT Ratio created by Dimitry Kalichkin. This indicator provides more emphasis on predictive signaling ahead of price peaks.
🚀Bitcoin Velocity
Velocity is a measure of how quickly money is circulating in the economy. Is bitcoin trending towards savings or payments? This can help you decide. It is similar to Bitcoin Network Momentum, except this takes into account bitcoins increasing supply.
🏃Bitcoin Network Momentum
Network Momentum is a view created by PositiveCrypto which looks into the value transmitted through the Bitcoin blockchain denominated in BTC value plotted against Bitcoin's price. It serves as a leading indicator to bitcoin price, in that we need high levels of value throughput to drive the bull market. This indicator is experimental.
Both daily transaction values and price exhibit cyclical patterns, but not in sync with each other. A hypothesis to explain the mismatch is that short-term mindset traders (using exchanges) heavily influence price; but long-term mindset investments (more likely to be directly recorded on-chain) have a greater contribution to the daily transaction value recorded in the ledger.
An alternative to the NVT / NVT Signal - tracks the relationship between Bitcoin’s price and BTC volume flowing through the blockchain network.
Ⓜ Mayer Multiple
Introduced by Trace Mayer as a way to gauge the current price of Bitcoin against its long range historical price movements (200 day SMA by default), the Mayer Multiple highlights when Bitcoin is overbought or oversold in the context of longer time frames.
It`s worth noting as the market becomes larger and less volatile, the peaks are becoming less exaggerated. This is because a 200 day moving average baseline is a static yardstick against an ever growing, more stable, Bitcoin market. We should eventually re-calibrate what constitutes the overbought/oversold extremes on this chart accordingly.
A more fully featured Mayer Multiple version available here:
💲 BTC Marketcap and Thermocap
We are all familiar with marketcap, but it does come with its disadvantages.
A more appropriate measure of network value was recently put forth by Nic Carter. Remember capital flows in crypto generally do not come in via exchanges (miners notably like to sell OTC). Every buy in an exchange is matched by a sell. Money that comes in = money that goes out.
True inflows (in Bitcoin, at least) are the aggregate of resources spent by miners¹. And a good proxy for that is the amount these folks are earning back from networks they support in return for their investments. That’s aggregate security spend (or Thermocap): what was actually paid out to miners (transactions * their price in USD at the time they were mined).
There is an option to deduct lost coins, genesis (Satoshi's) coins, and dead HODL'ers coins from the marketcap. This information was taken from ChainAnalysis' 2017 report
This shows both plots for comparison on a logrithmic scale:
⛏Mining Indicators & Data
⛏ Petahash Dollar Ratio
Bitcoin’s Hashrate (Daily PetaHashes) to Daily Mining Earnings (PetaHashDollar) is a robust metric to asses the day to day mining profitability. In addition, when plotted over the past five years, its overall trend represents a good way to quantify and visualize the relative progress in efficiency of ASICs (more specifically the inverse of that metric: 1/relative mining efficiency).
⛏Unmined Coins Marketcap
A simple statistic I created to plot the value of the unmined BTC still waiting to be extracted. If you find any interesting value for analysis please message me and let me know.
⛏Percentage of Total BTC Mined
I hope this one doesnt need an explanation. 😅
#️⃣ Network Hash Rate
A network's hashrate is the most important data point in blockchain tech. It indicates to the world how secure its network is. The hashrate is the "bridge" between the analog world, and the digital world. Essentially, the hashrate describes how much computing power (called hashing power in blockchain speak) is being thrown at the network, by users all across the world. These "miners" are running servers with dedicated processing chips to solve random, cryptographic math problems. The reason miners do this constant computing is that it betters their chances to reap a "block reward." The block reward entitles them to:
1.)Newly "mined" coins, and
2.)Transaction fees
Both of these are typically paid out with each new block. This rewards miners for their “proof-of-work.” It signals to the world that real "work" and resources, like electricity, have been spent on the Bitcoin network.
As more and more miners compete for the block reward, the hashrate, mining calculations and block difficulty will increase. This increase in the network's hashrate over time means an increase in the network’s security. Much better detail on this is available elsewhere, but primarily, this process solves digital money's vulnerability to attacks and the "double spend" problem.
I like to plot it directly on the price chart (click on the indicator and drag it up)
⛏ Revenue Per Transaction
A chart showing miners revenue divided by the number of transactions.
Fee Per Block Kilobyte
A measure of how much it costs per kilobyte of blockchain block size.
⛏Return Per TeraHash (TH)
Revenue per TH of mining hash power.
Can also be plotted on price chart and looks nice:
Cost Per TX (CPT) and Cost % Per TX Volume
CPT - A chart showing miners revenue divided by the number of transactions
C%PRV - A chart showing miners revenue as percentage of the transaction volume
Blockchain Statistics & Data Plots
🏋Network Difficulty
A relative measure of how difficult it is to find a new block. The difficulty is adjusted periodically as a function of how much hashing power has been deployed by the network of miners.
I like plotting this one on price chart as well:
Daily Output Value
The total value of all transaction outputs per day (includes coins returned to the sender as change).
🔢Number of Unique Addresses Used
Addresses are kind of like bank accounts.
Unlike bank accounts, addresses on the blockchain can be generated by anyone, anywhere and one single person could have thousands.
The plot shows bitcoins growth of addresses which are both unique and active per day, smoothed out over 14 days for clarity (using a zero lag ema). As you can see bull runs typically lead to more unique addresses the assumption being that more new money is drawn into the market due to the news cycle.
This is another one I prefer to plot on the price chart.
🔢Number of Transactions (NoTX) and NoTX - Exchange Wallets
Number of TX's on the chain (green line) and NoTX minus (-) Exchange Wallets (blue line).
⏳ Median Confirmation Time
The median time for a transaction to be accepted into a mined block and added to the public ledger (note: only includes transactions with miner fees). Displayed in minutes.
🔊Volume Dominance (Liquidity to Transaction Volume Ratio)
Volume Dominance is another metric I invented simply to show the ratio between spot exchange TXs (liquidity/speculation) and blockchain TXs (utility/HODLing). Its shows percent of volume attributed to blockchain TXs.
🙃 We REALLY hope you enjoy and find this indicator useful. I certainly enjoyed creating it and learned quite a bit myself manipulating the data! I welcome any suggestions or ideas you may have to further extend, or create new indicators.
👍 Enjoying this indicator or find it useful? Please give me a like and follow! I post crypto analysis, price action strategies and free indicators regularly.
💬 Questions? Comments? Want to get access to an entire suite of proven trading indicators? Come visit us on telegram and chat, or just soak up some knowledge. We make timely posts about the market, news, and strategy everyday. Our community isn't open only to subscribers - everyone is welcome to join.

Multi-period Simple Moving Average trenderA plot of 6 SMA's grouped by 3's for short and long views of trading patterns.
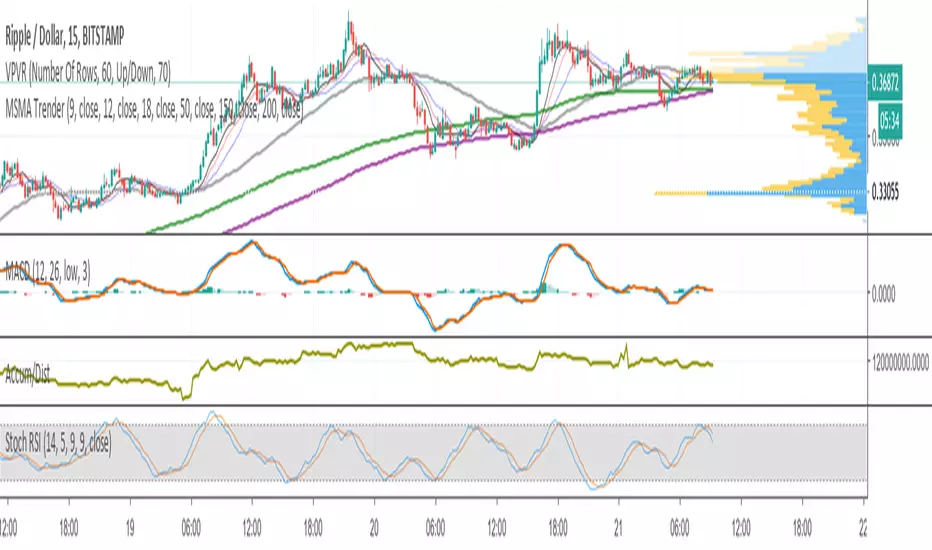
inwCoin Price Diff AlertJust simple alert script to compare candle with current candle for price change with leverage.

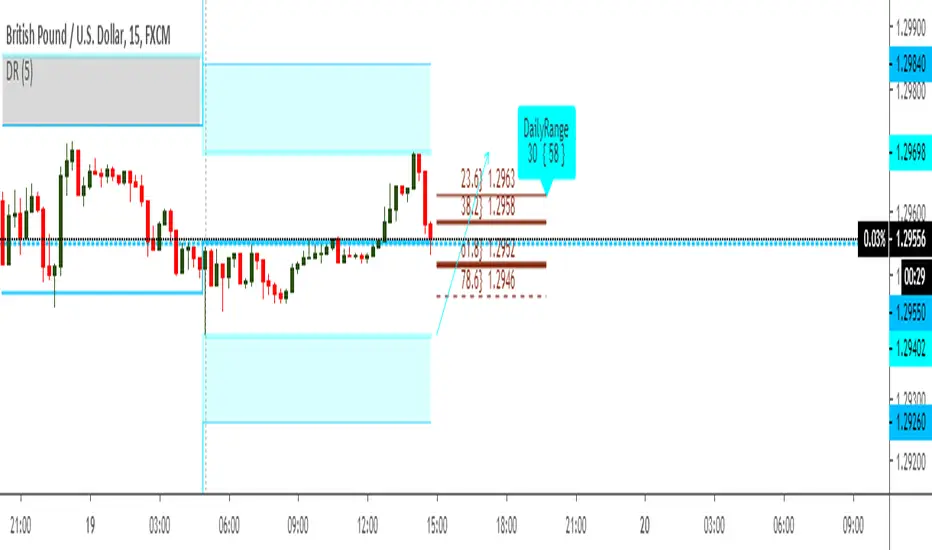
WeekendIt is tracking Previous candle high and Previous candle low. It is an important script to trail PDH PDL system (and more importantly to create alerts) which is rampantly used by price action traders.

Average buyer/seller priceThis script shows average buyer or seller price since the last bar you define.
The bar is defined by the condition low/high less or greater than specific value.
Recommended to use 15/30 or 1h timerame (the less the better).
The error is about 1%.
Blue - Buyer
Red - Seller.

Price Volume - Development BranchPrice*volume.
Not going to give out access, this is for development recording only, please don't ask. Eventually to be merged to OSI.

Trader Set - Ergodic MomentumThis is a price momentum indicator that is based on Ergodic formula (TSI), but the formula is tweaked and different types of averaging is allowed. by changing the type of average calculation and some predefined values (totally different from what is suggested by now) we get a nasty indicator that can easily be used both for cycle observation side by side with momentum of the price itself !
Please don't contact me for getting access, these tools are available for my students only. These are part of my "methodology" that I teach. The English version of the website and learning material is under development and I will announce it under each related script when they are ready so that those who are interested can participate in the course.

The Normalizer [BVCC]The Normalizer adds an indicator to your chart with the option to view regular Volume, normalized Volume or normalized price.
Normalized Volume divides the current Volume bar into a moving average and multiplies by 100. The resulting plot is a histogram showing how far above or below the moving average that volume bar was.
Normalized Price does the exact same thing, but uses the close price of the current candle.
The result of a normalized bar chart is that sometimes activities of unusually low or high patterns can be seen that are not obvious when looking at the standard data points.
Customizable Settings include;
1) Check/Uncheck the first box to set the view to Volume or Price
2) Check 'Normalize' when on Volume to toggle between standard Volume and Normalized Volume
3) Price is always Normalized
4) Normalization is calculated from the SMA and the default is set to 9 - John Bollinger suggest setting this to 50
5) Normalization period can be set with the 'Period' option
This indicator was created for members of the BVCC trading community as an example of the normalization methods described in John Bollinger's "Bollinger on Bollinger Bands". Mr. Bollinger talks extensively about normalization and specifically volume normalization. I added the price normalization as a fun bonus just because. :)

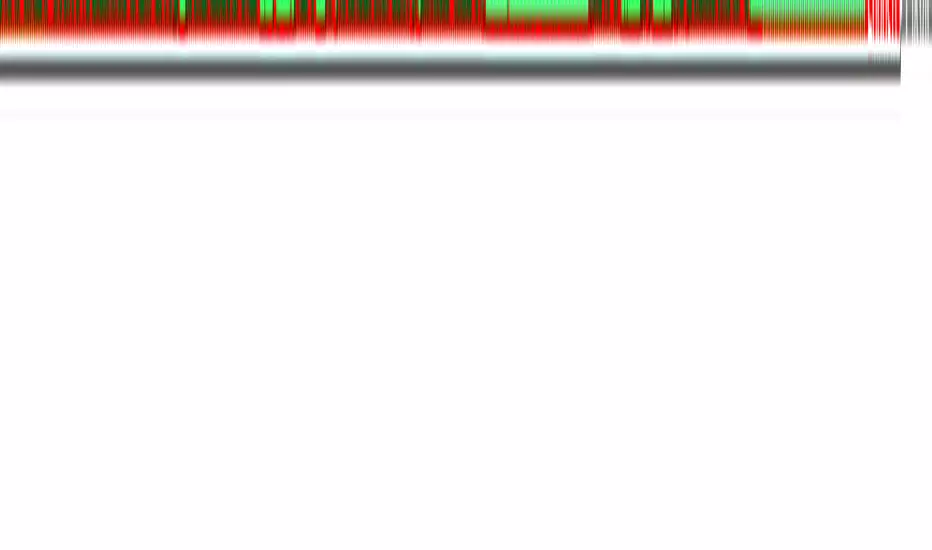
Weekdays HeatmapA utility tool for getting interesting weekdays statistics.
Features
26 sources (standard prices, volumes, ranges)
Readable and optimized code
How to interpret
The darker the color, the stronger the weekday dominance
Supported sources/metrics
open
high
low
close
oo2 , (open + previous open) / 2
oh2 , (open + high) / 2
ol2 , (open + low) / 2
oc2 , (open + close) / 2
hh2 , (high + previous high) / 2
hl2 , median price
hc2 , (high + close) / 2
ll2 , (low + previous low) / 2
lc2 , (low + close) / 2
cc2 , (close + previous close) / 2
hlc3 , typical price
ohlc4
weighted close , (2 * close + high + low) / 4
true range
double true range , by Cynthia Kase
open/close range
high/low range
volume
tick volume
net volume
on balance volume
acc/dist , accumulation/distribution line
price volume trend
trade value , volume * close * pipvalue
How to get access
PM me for more details

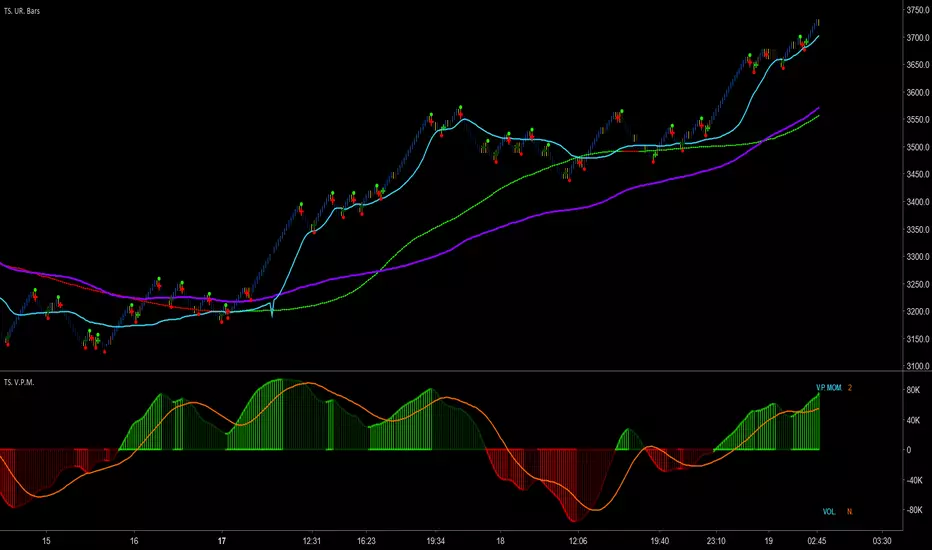
Trader Set - Volume Price MomentumThis is the latest tool in my methodology, a momentum indicator that combines PRICE and VOLUME.
There are two modes that you can use this : Normal, and Power Of Two. In the picture, the top one is set to normal, as you can see, it goes in the negative zone on each retrace, on the bottom one, we set it to the power of two mode, it still shows the same divergence in momentum vs price move but there is no negative section, instead, it only shows the POWER of the momentum without any direction indication.
Please don't contact me for getting access to these tools, they are only available to my students. Right now, the English version of the website and learning material is under development. The moment they are ready, I will announce it under every related script in the comment section.
Earnings Support and Resistance Levels [NeoButane]Inspired by @LazyBear's/@timwest's script:
Usage: support and resistance levels based on averaging price around earnings and quarterly opens.
What it is plotting:
1. A horizontal level whenever earnings occur. If actual earnings is higher than estimated, the line turns green, else red.
2. A horizontal level every quarterly open, colored black.
3. An average between the two mentioned above, colored orange.
4. 5% moves away from 3M open and earnings
5. Misc: 5% move away from that 5% move away, then 10% move away from the 2nd 5% move away.
By default, 4 and 5 are off to reduce visual noise.
Idea: Traders panic around certain dates that always happen, and traders always panic in the wrong direction. The market is composed of traders trading in the wrong direction at the same time, all the time. That means price will bounce back and forth as the gambling dens colloquially known as 'forex brokerages' or 'stock exchanges' take your money in the form of fees, time, and liquidations. So I put two lines on the chart and put one right in between, because it always goes back. I hope you can find it useful!
Note: This was a part of the old fundamental data indicators and is not officially for use, so while it should work on most U.S. stocks and a couple of other exchanges, it is not perfect.

[IE] RSI - BEAR/BULL - DivergencesDetect divergences in price and RSI.
Also mark overbought and oversold RSI.
Useful for scalps.
Contact in private for access
Ultimate Money Flow (UMF), Stoch, Multi Time Frame (MTF) [cI8DH]This indicator adds stochastic, multi time frame, signal line, histogram, and bar coloring options to my previous indicators. It can also replicate standard Money Flow Index ( MFI ), Chaikin's Accumulation/Distribution Line ( ADL ), On Balance Volume ( OBV ) and Price-Volume Trend ( PVT ). This indicator can be used for analyzing momentum, buy/sell pressure, overbought/oversold conditions, and trendiness/choppiness, as well as identifying swings (stoch). Chart below shows example multi-TF setup with bar coloring.
For analyzing price, I made a similar indicator based on Absolute and Relative Strength Indices, which you can find in the link below.
Equation
Here is part of the code used in the script: pastebin.com
Standard MFI, OBV, ADL and PVT
To validate the calculations, I stacked UMF on MFI, OBV, ADL, and PVT in the chart below (100% overlaps validate the calculations). It also shows how you can replicate these indicator if you'd like to use them, or if you want to make your own custom indicator by combining features from different indicators. I do not recommend MFI, ADL or OBV; read "why invent a new indicator" section below. (bear in mind that MFI scale is 0-100, while UMF scales is -100 to 100)
Money Flow based on "Balance of Power" (this is the default mode)
Balance of Power (BoP) equation is: (close - open) / (high - low)
In my opinion, BoP is the most accurate equation to measure the amount of volume accumulated or distributed. I used BoP in my previous open source indicators ADV , ADL , ADP and ADMF . I applied the "True Range" fix to BoP equation similar to what Twiggs did on CMF .
Aggregation Method
By changing aggregation methods, you can replicate my previous indicators which are also linked at the bottom of this page. Please read more about their applications in their respective pages.
aggregation method = Cumulative => ADL indicator: accumulation/distribution (price factoring should be turned off)
aggregation method = MA => ADMF indicator: accurate buy/sell pressure, momentum and divergence
aggregation method = MA Percent => ADP indicator: overbought/oversold conditions, buy/sell pressure, momentum and divergence, failure swings
Smoothing, signal line and histogram to detect trend and choppiness
You can apply additional smoothing to UMF. Also, you can add a signal line and histogram (histogram is the difference between main line and signal line). To do so, set the signal length to a number greater than one. Signal line can help you detect changes in trend similar to the signal line on MACD. If signal line criss-crosses UMF, it shows market is choppy. The worst case is when this criss-crossing coincides with UMF flattening near neutral line and histogram height is short; that means market is ded (until it is not; expansion following a contraction period is a common phenomena)! (Bear in mind that histogram will not show in stoch mode.)
Stochastic
To enable stoch, change the stoch length to a number greater than 1 (default stoch length for the built-in stoch RSI is 14). This length should be calibrated depending on TF and asset. If done correctly, it can be a powerful tool for identifying swings. Stoch can be combined with any aggregation method. I recommend using stoch with MA or cumulative aggregation methods. For conventional uses of stochastic, please read www.tradingview.com(STOCH) and www.tradingview.com(STOCH_RSI).
Experimental Bar coloring Feature
There is an option to color bars depending on UMF's position relative to the signal line. If both TFs are used in coloring and they are in disagreement, the TF with greater histogram height wins. There are two shades of green and red. The darker shade means both TFs agree. If you use the signal line, bar coloring can help with calibrating the indicator (play with parameters until you see a good looking chart i.e. a lot of green candles followed by a lot of red candles in a row). Please note that bar colors might change until candle(s) close(s). The bar coloring rules will most likely change in the future.
Notes
- Uncheck "Factor Price" for Bitmex or any other exchange that shows volume in terms of money.
- UMF is a replacement to ADP , ADMF and ADL , so no more updates for the old indicators!
- Smooth MA length N = EMA length 2*N-1
- Combined tickers, e.g. (COINBASE:BTCUSD+BITSTAMP:BTCUSD+KRAKEN:XBTUSD)/3, can mitigate inconsistency issues between different exchanges (I recommend not mixing USD and USDT pairs together)
Why invent a new indicator
I have spent a great deal of time to find the best equation that represents accumulation/distribution. Each of the well-known methods have a major flaw.
- Winner-take-all problem
MFI, OBV and to some extent Williams AD assign accumulation or distribution based on the direction of change in price. They don't account for the amount of change. That means the indicator does not differentiate between a full candle and a doji candle.
- Extreme divergence problem
Chaikin tried to avoid winner-take-all problem. However, he ended up with a solution that, in my opinion, is even worse. A big flaw of Chaikin's indicators is that they can diverge too much from price. Most responsive indicators in this class, require at least two candles to diverge from price, but CMF/ADL can diverge in a single candle. Chaikin used the same component ( aka Chaikin's money flow multiplier) in both CMF and ADL. CMF 's flaws may not be as visible because it is a normalized oscillator. However, this common flaw is more evident in accum/dist indicator which keeps all past information in its memory. As you can see in the chart below, accum/dist is constantly rising during an obviously distribution period.
ADV (Volume)
ADP
ADMF
ADL
Please give a like, and share the interesting configurations you find in the comments.

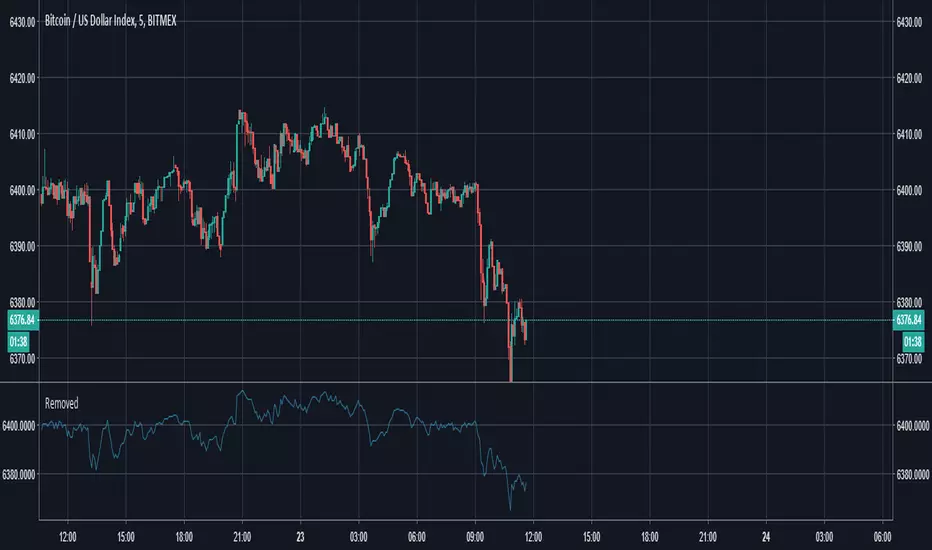
Real Price for Heikin Ashi ChartsThe indicator is in the top left of the screen! That's all there is, by design.
This is a super simple indicator that allows you to see what the real price of a candle was when using Heikin Ashi charts, while not cluttering up your screen.
HA charts are a great way to help those who can be spooked by the chaos of the markets (I'm one!), but they have a big drawback in that the price you see on a HA candle is often significantly different from the real price that you would trade on. This brings issues of unrealistic expectations of profits/losses, and also makes back testing a strategy very difficult. I still wouldn't recommend ever using TradingView's "strategy" tool when using HA charts, but using this indicator you can do accurate manual back tests.
There's nothing plotted on the screen given that there's no real point in it, but you can make the lines appear if you wish - just go into settings and change the transparency.
The order of the numbers on the indicator match the OHLC (Open, High, Low, Close) format.
There's also settings to turn off one or more of the OHLC values, simply open the settings and go to Inputs. This could be useful for some people, as the High and Low values of HA candles are the same as regular candles. Only the Open and Close are different.
Any queries let me know.
DreamsDefined

.BXBT Bitcoin Price Index for BitMEX - Gyro.BXBT script as seen on the BitMEX built-in chart.
This is not created by, authorized by or in any type of affiliation with BitMEX whatsoever.
This is not financial advice. Use at your own risk.
Tips are appreciated if you find this useful:
BTC: 15BtFGxY8Q4jybcnpVAc3r8yJDyRrPre1n
LTC: LhR5LW8qQ5byZvYkUeRR4njBDTxtCZynuk
Thanks

Bitcoin Studies (NVT et. al) [NeoButane]Currently studying the effect of NVT on price action and volume.

Matrix. PA tool for analyzing the time on charts that can come in and out of the last time for open price, high, low, close and trading volume.
The idea began with the phrase, "Our past is our future."

Volatility IndicatorThe Volatility Index measures the market volatility by plotting a smoothed average of the True Range.
Based on HPotter's idea (),
it returns an average of the TrueRange over a specific number of bars.
Here the result is passed through the Fisher's transform and normalized to 0/1-range.
This indicator may be used to identify stretches in the price movements, suitable for entry.