OPEN-SOURCE SCRIPT
Aktualisiert Camarilla Fibonachi Breakout Indicator with Alerts
This Script can be used for Intraday Only.
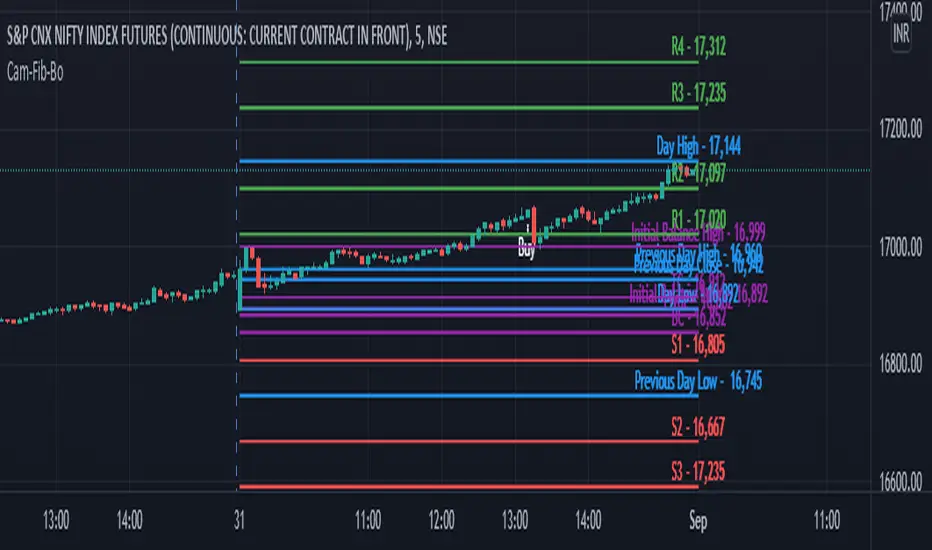
This Script will Plot the following Lines in the Chart
1. VWAP (Colour will be ploted as per the following condition)
VWAP Line will Plotted in Green if Open Price is Greater Than Close
VWAP Line will Plotted in Red if Open Price is Less Than Close
2. VWMA (VWMA Period used 14)
3. Atr Trailing Stoploss
(ATR Period 5, ATR Multiplier 2.5 is used to plot the Lines)
4. 15 Min High Low of the day will be plotted as dotted Purple lines
5. H4 as BuyAbove Level
6. H3 as Buy Stop Loss Level
7. H5 as Buy Target 1 Level
8. H6 as Buy Target 2 Level
9. H7 as Buy Target 3 Level
10. H8 as Buy Target 4 Level
11. H9 as Buy Bonus 1 Level
12. H10 as Buy Bonus 2 Level
13. H11 as Buy Bonus 3 Level
14. H12 as Buy Bonus 4 Level
15. L4 as Sell Below Level
16. L3 as Sell Stop Loss Level
17. L5 as Sell Target 1 Level
18. L6 as Sell Target 2 Level
19. L7 as Sell Target 3 Level
20. L8 as Sell Target 4 Level
21. L9 as Sell Bonus 1 Level
22. L10 as Sell Bonus 2 Level
23. L11 as Sell Bonus 3 Level
24. L12 as Sell Bonus 4 Level
This script will generate Buy signal on he following condition
1.Close Must be Greater than H4
if Calculate Inside Camarilla is Enabled then the Script will check whether Yesterdays H4 is Less than Todays H4
2.Close Must be Greater than VWAP
3.Volume Must be Greater Than 20 Period Simple Moveing Average
4.Buy Signal will be Displayed only Once for a Day.
This script will generate Sell signal on he following condition
1.Close Must be Less than L4
if Calculate Inside Camarilla is Enabled then the Script will check whether Yesterdays L4 is Less than Todays L4
2.Close Must be Less than VWAP
3.Volume Must be Greater Than 20 Period Simple Moveing Average
4.Sell Signal will be Displayed only Once for a Day.
and the Alert Message will be Generated for Buy and Sell
Versionshinweise
Improvements in this Version 1. Initial Balance Period can be Set by the User
2. Show/Hide Initial Balance High/Low
3. Show/Hide Standard Pivot Points
4. Show/Hide Previous Day High/Low/Close
Versionshinweise
in this version you can choose the way indicator values are plotted, i.e.
if you choose default then values will be plotted in the chart as per tradingview default settings
if you choose continues plot then values will be plotted as a line upto the days end in the morning itself.
Versionshinweise
in this version previous day values are also covered under continuous line format while plotting the indicator valuesVersionshinweise
In This Version Initial Balance is also Covered in continuous line plotting style.Open-source Skript
Ganz im Sinne von TradingView hat dieser Autor sein/ihr Script als Open-Source veröffentlicht. Auf diese Weise können nun auch andere Trader das Script rezensieren und die Funktionalität überprüfen. Vielen Dank an den Autor! Sie können das Script kostenlos verwenden, aber eine Wiederveröffentlichung des Codes unterliegt unseren Hausregeln.
Haftungsausschluss
Die Informationen und Veröffentlichungen sind nicht als Finanz-, Anlage-, Handels- oder andere Arten von Ratschlägen oder Empfehlungen gedacht, die von TradingView bereitgestellt oder gebilligt werden, und stellen diese nicht dar. Lesen Sie mehr in den Nutzungsbedingungen.
Open-source Skript
Ganz im Sinne von TradingView hat dieser Autor sein/ihr Script als Open-Source veröffentlicht. Auf diese Weise können nun auch andere Trader das Script rezensieren und die Funktionalität überprüfen. Vielen Dank an den Autor! Sie können das Script kostenlos verwenden, aber eine Wiederveröffentlichung des Codes unterliegt unseren Hausregeln.
Haftungsausschluss
Die Informationen und Veröffentlichungen sind nicht als Finanz-, Anlage-, Handels- oder andere Arten von Ratschlägen oder Empfehlungen gedacht, die von TradingView bereitgestellt oder gebilligt werden, und stellen diese nicht dar. Lesen Sie mehr in den Nutzungsbedingungen.