OPEN-SOURCE SCRIPT
Frank-Setup EMA, RS & RSI ✅
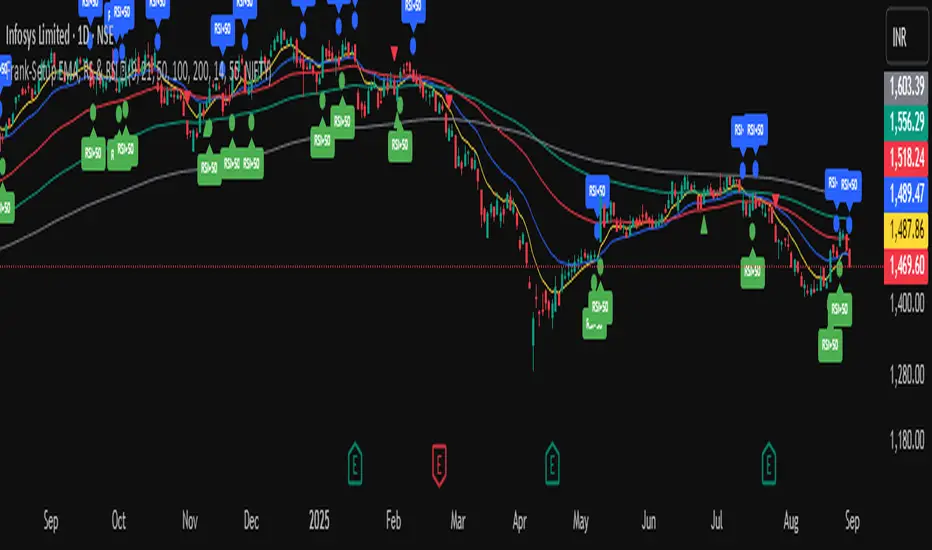
It is a clean and simple indicator designed to identify weakness in stocks using two proven methods: RSI and Relative Strength (RS) vs. a benchmark (e.g., NIFTY).
🔹 Features
RSI Weakness Signals
Plots when RSI crosses below 50 (weakness begins).
Plots when RSI moves back above 50 (weakness ends).
Relative Strength (RS) vs Benchmark
Compares stock performance to a chosen benchmark.
Signals when RS drops below 1 (stock underperforming).
Signals when RS recovers above 1 (strength resumes).
Clear Visual Markers
Circles for RSI signals.
Triangles for RS signals.
Optional RSI labels for clarity.
Built-in Alerts
Get notified instantly when RSI or RS weakness starts or ends.
No need to constantly watch charts.
🎯 Use Case
This tool is built for traders who want to:
Spot shorting opportunities when a stock shows weakness.
Track underperformance vs. the index.
Manage risk by exiting longs when weakness appears.
Open-source Skript
Ganz im Sinne von TradingView hat dieser Autor sein/ihr Script als Open-Source veröffentlicht. Auf diese Weise können nun auch andere Trader das Script rezensieren und die Funktionalität überprüfen. Vielen Dank an den Autor! Sie können das Script kostenlos verwenden, aber eine Wiederveröffentlichung des Codes unterliegt unseren Hausregeln.
Haftungsausschluss
Die Informationen und Veröffentlichungen sind nicht als Finanz-, Anlage-, Handels- oder andere Arten von Ratschlägen oder Empfehlungen gedacht, die von TradingView bereitgestellt oder gebilligt werden, und stellen diese nicht dar. Lesen Sie mehr in den Nutzungsbedingungen.