OPEN-SOURCE SCRIPT
Robot eVe Colorbox

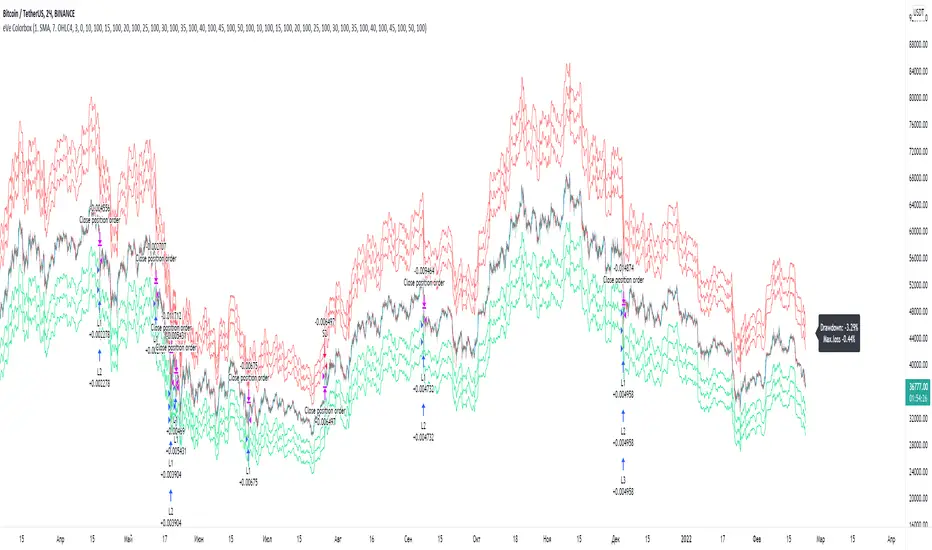
A script to test the Colorbox strategy of the trading robot eVe.
Lines
The blue line is the moving average and the reference point for the other lines.
Lime lines - a shifted moving average for opening a long position using a limit order.
Red lines - a shifted moving average for opening a short position using a limit order.
Strategy
Long positions are opened by a limit order at the price of the lime line.
Short positions shall be opened by a limit order at the price of the red line.
Any positions shall be closed by a market order.
If a long position is open, the position shall be exited upon the occurrence of any rising bar (green bar).
If a position is short, the position is exited on any falling bar (red bar).
This is a counter-trend strategy.
Exchange fees
A maker is used to enter.
A taker is used to exit.
The amounts for a maker and a taker are always equal.
For the backtest, the average commission = (maker_fee + taker_fee) / 2
Symbols
This is a very versatile strategy. It can be profitable on any trading pairs, on any asset class, and on any timeframe. But it requires the right parameters to perform well (see recommendations below).
Recommendations
The more volatile the asset, the better the strategy will work.
The more volatility , the more you need to set a slider for your orders.
The larger the time frame, the greater the number of slots required for orders.
Short positions are less profitable and more risky.
Short positions can be disabled altogether, it can be useful.
The strategy works very well for Crypto/Crypto trading pairs (e.g. ETH/BTC , DOGE/ETH, etc)
Open-source Skript
Ganz im Sinne von TradingView hat dieser Autor sein/ihr Script als Open-Source veröffentlicht. Auf diese Weise können nun auch andere Trader das Script rezensieren und die Funktionalität überprüfen. Vielen Dank an den Autor! Sie können das Script kostenlos verwenden, aber eine Wiederveröffentlichung des Codes unterliegt unseren Hausregeln.
Haftungsausschluss
Die Informationen und Veröffentlichungen sind nicht als Finanz-, Anlage-, Handels- oder andere Arten von Ratschlägen oder Empfehlungen gedacht, die von TradingView bereitgestellt oder gebilligt werden, und stellen diese nicht dar. Lesen Sie mehr in den Nutzungsbedingungen.