OPEN-SOURCE SCRIPT
Aktualisiert Force Index with Buy on Dip strategy
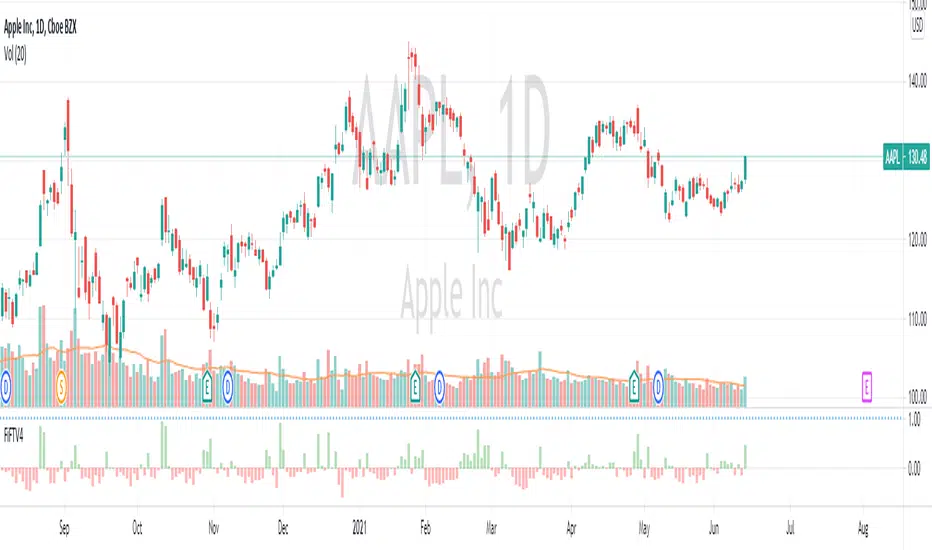
This charts has 2 indicators
1 - Force Index
This indicator is based on Dr Alexander Elder ForceIndex indicator with relate price to volume by multiplying net change and volume.
- GREEN Bar indicates Bull is in control
- RED Bar indicates Bear is in control.
LENGTH of the bar indicate the strength of Bull or Bear.
Normally there's potential BUY if the RED bar turned GREEN and SELL if GREEN to RED.
2 - Stochastic momentum
Stochastic momentum is to detect potential Reversal where BLUE bar will appear if :-
- Oversold - Stochastic less than 35
- Closing price is higher than last 2 High (Fast Turtle)
// Note : Best use with "EMA Indicators with BUY sell Signal"
Versionshinweise
*****************************************************************************************Description :-
This indicator is based on Dr Alexander Elder ForceIndex indicator
with relate price to volume by multiplying net change and volume.
1 - GREEN Bar and GREEN background indicates Bull is in control
2 - RED Bar and RED background indicates Bear is in control.
LENGTH of the bar indicate the strength of Bull or Bear.
Normally there's potential BUY if the RED bar turned GREEN and SELL if GREEN to RED.
On top of that, it's also include information about Stochastic momentum to detect
potential Reversal. BLUE bar will appear if :-
1 - Oversold - Stochastic less than 35 (Default value set at 35)
2 - Closing price is higher than last 2 High
Note : Best use with "EMA Indicators with BUY sell Signal"
Versionshinweise
New Update :-Change background color of the FiFT indicator to indicate BULL or BEAR force.
1 - GREEN Bar and GREEN background indicates Bull is in control
2 - RED Bar and RED background indicates Bear is in control.
LENGTH of the bar indicate the strength of Bull or Bear.
Normally there's potential BUY if the RED bar turned GREEN and SELL if GREEN to RED.
On top of that, it's also include information about Stochastic momentum to detect
potential Reversal. BLUE bar will appear if :-
1 - Oversold - Stochastic less than 35 (Default value set at 35)
2 - Closing price is higher than last 2 High
Note : Best use with "EMA Indicators with BUY sell Signal"
Versionshinweise
Remove Star from -ve FiFT BOD signal. Versionshinweise
Bug fix : FiFT change with different candle type.Standardize signal to avoid confusion : OB = Overbought, OS = Oversold.
Versionshinweise
Code Clean upVersionshinweise
Simplify the code to focus on volume only instead of integrating Volume and PirceOpen-source Skript
Ganz im Sinne von TradingView hat dieser Autor sein/ihr Script als Open-Source veröffentlicht. Auf diese Weise können nun auch andere Trader das Script rezensieren und die Funktionalität überprüfen. Vielen Dank an den Autor! Sie können das Script kostenlos verwenden, aber eine Wiederveröffentlichung des Codes unterliegt unseren Hausregeln.
Contact me to learn Turtle Trading System, MCDX and other indicators (t.me/SgxFx)
tradingview.com/script/mbiUr95n-MCDX-Plus/
tradingview.com/script/mcAidXIT-FiFT-Pro/
tradingview.com/script/viAR3Ilo-Trend-Sign
tradingview.com/script/mbiUr95n-MCDX-Plus/
tradingview.com/script/mcAidXIT-FiFT-Pro/
tradingview.com/script/viAR3Ilo-Trend-Sign
Haftungsausschluss
Die Informationen und Veröffentlichungen sind nicht als Finanz-, Anlage-, Handels- oder andere Arten von Ratschlägen oder Empfehlungen gedacht, die von TradingView bereitgestellt oder gebilligt werden, und stellen diese nicht dar. Lesen Sie mehr in den Nutzungsbedingungen.
Open-source Skript
Ganz im Sinne von TradingView hat dieser Autor sein/ihr Script als Open-Source veröffentlicht. Auf diese Weise können nun auch andere Trader das Script rezensieren und die Funktionalität überprüfen. Vielen Dank an den Autor! Sie können das Script kostenlos verwenden, aber eine Wiederveröffentlichung des Codes unterliegt unseren Hausregeln.
Contact me to learn Turtle Trading System, MCDX and other indicators (t.me/SgxFx)
tradingview.com/script/mbiUr95n-MCDX-Plus/
tradingview.com/script/mcAidXIT-FiFT-Pro/
tradingview.com/script/viAR3Ilo-Trend-Sign
tradingview.com/script/mbiUr95n-MCDX-Plus/
tradingview.com/script/mcAidXIT-FiFT-Pro/
tradingview.com/script/viAR3Ilo-Trend-Sign
Haftungsausschluss
Die Informationen und Veröffentlichungen sind nicht als Finanz-, Anlage-, Handels- oder andere Arten von Ratschlägen oder Empfehlungen gedacht, die von TradingView bereitgestellt oder gebilligt werden, und stellen diese nicht dar. Lesen Sie mehr in den Nutzungsbedingungen.