OPEN-SOURCE SCRIPT
Anchored SMA
This is not your usual single moving average (SMA) indicator. It is an anchored SMA indicator. The anchored SMA does what other SMAs cannot--it stays at an anchored timeframe and presents that SMA relative to the timeframe you are in. For example, standard SMA indicators adjust to the timeframe you are viewing in your chart. So if you set it to a 20 day SMA while in the 1 Day timeframe, when you switch to the 5 minute timeframe, your 20 day SMA now becomes a 100 minute SMA indicator--that is it is only calculating the SMA for 20 ticks at 5 minutes each rather than holding the 20 day indicator at the higher timeframe. However, with the anchored SMA, the indicator would have held at the 20 day SMA while you were in the 5 minute timeframe.
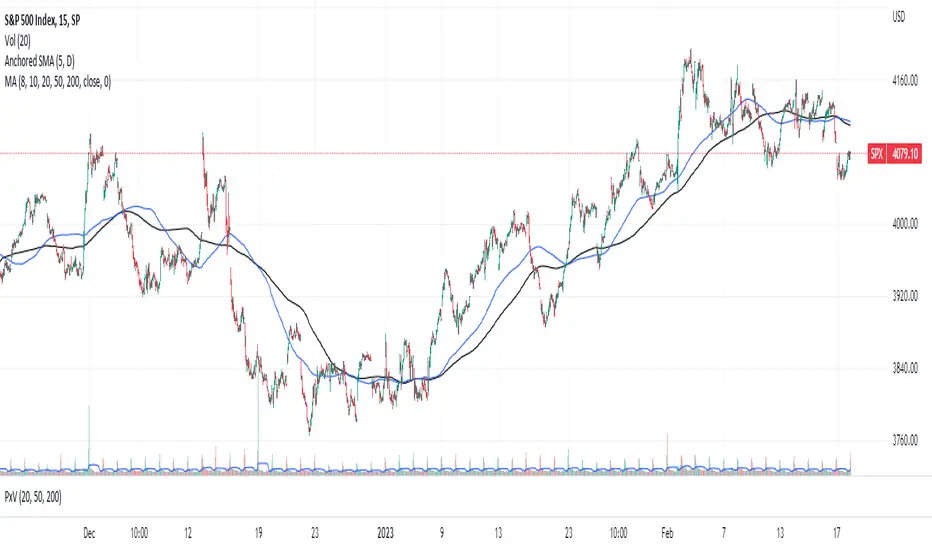
The default setting is for the anchored SMA is the five day SMA. This can be adjusted in the settings to be any amount of ticks in any timeframe you choose from 1 minute to 1 week. The indicator does not hold accurately at timeframes outside of this range. The accompanying chart is the SPX in the 15 minute timeframe with the default anchored SMA settings in blue and the standard 200 tick SMA in black. Now, you could manually adjust the ticks to 130 SMA to fit the same blue line, but why do so when the anchored SMA does it for you?
This brings us to a very important note--this indicator is set to standard market hours at 6.5 hours per day. This means this indicator would not give the same results in markets with different hours, such as futures, FOREX, or Crypto markets. This only holds for equity markets. However, that is not to say it cannot be used in these other markets, it's that it wouldn't be the same result. Anyway, enjoy!
Open-source Skript
Ganz im Sinne von TradingView hat dieser Autor sein/ihr Script als Open-Source veröffentlicht. Auf diese Weise können nun auch andere Trader das Script rezensieren und die Funktionalität überprüfen. Vielen Dank an den Autor! Sie können das Script kostenlos verwenden, aber eine Wiederveröffentlichung des Codes unterliegt unseren Hausregeln.
Haftungsausschluss
Die Informationen und Veröffentlichungen sind nicht als Finanz-, Anlage-, Handels- oder andere Arten von Ratschlägen oder Empfehlungen gedacht, die von TradingView bereitgestellt oder gebilligt werden, und stellen diese nicht dar. Lesen Sie mehr in den Nutzungsbedingungen.