OPEN-SOURCE SCRIPT
Aktualisiert Trading Range Aggression Histogram

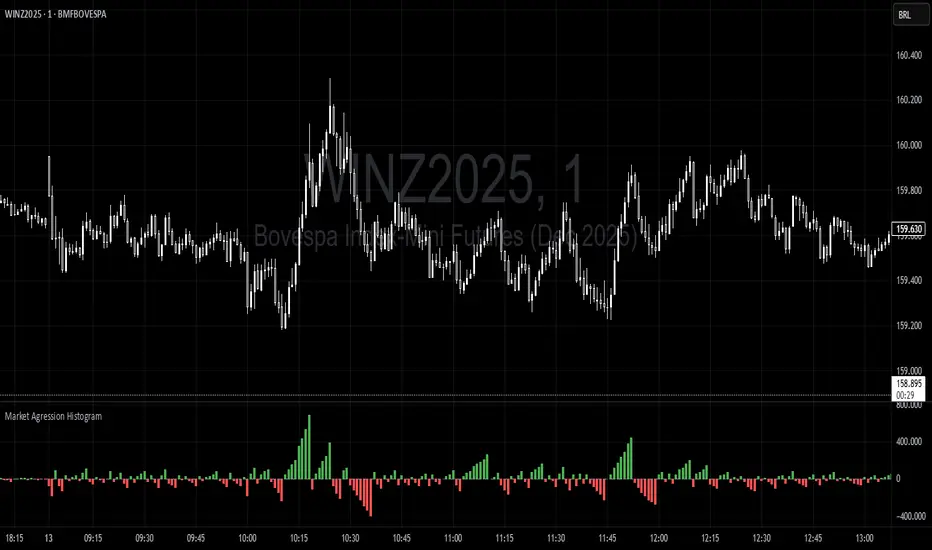
This indicator is a histogram that accumulates the net volume of aggressive buying and selling per candle, representing the dominant market pressure within defined time-frame.
The indicator works by continuously summing volumes as long as the aggression remains in the same direction, resetting and reversing the accumulation when the pressure changes sides.
This creates visual waves that facilitate the perception of phases dominated by buyers and sellers over time. The tool is useful to identify moments of strength, weakness, and potential reversals in a dynamic market, especially in short-term trading.
Versionshinweise
This indicator is a histogram that accumulates the net volume of aggressive buying and selling per candle, representing the dominant market pressure within defined time-frame.The indicator works by continuously summing volumes as long as the aggression remains in the same direction, resetting and reversing the accumulation when the pressure changes sides.
This creates visual waves that facilitate the perception of phases dominated by buyers and sellers over time. The tool is useful to identify moments of strength, weakness, and potential reversals in a dynamic market, especially in short-term trading.
Open-source Skript
Ganz im Sinne von TradingView hat dieser Autor sein/ihr Script als Open-Source veröffentlicht. Auf diese Weise können nun auch andere Trader das Script rezensieren und die Funktionalität überprüfen. Vielen Dank an den Autor! Sie können das Script kostenlos verwenden, aber eine Wiederveröffentlichung des Codes unterliegt unseren Hausregeln.
Haftungsausschluss
Die Informationen und Veröffentlichungen sind nicht als Finanz-, Anlage-, Handels- oder andere Arten von Ratschlägen oder Empfehlungen gedacht, die von TradingView bereitgestellt oder gebilligt werden, und stellen diese nicht dar. Lesen Sie mehr in den Nutzungsbedingungen.