PROTECTED SOURCE SCRIPT
Aktualisiert Market Profile
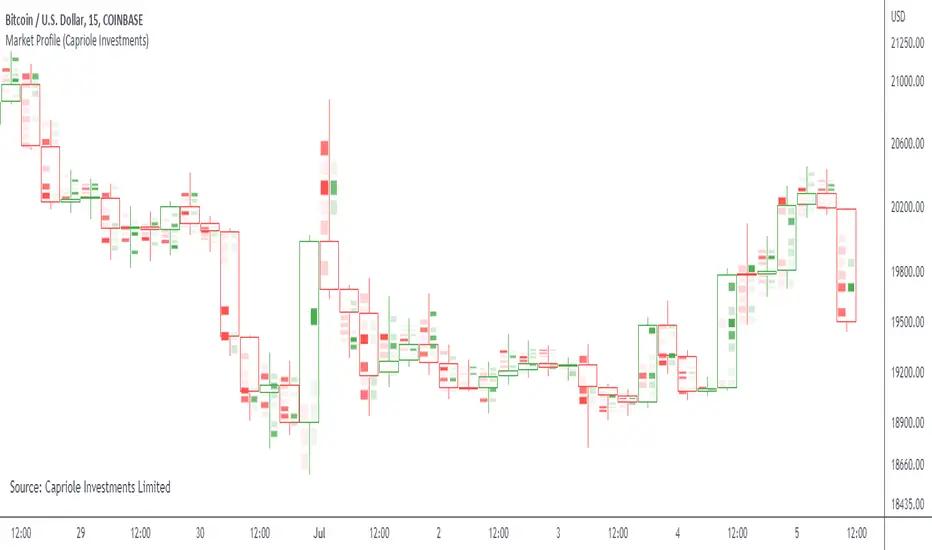
Simple "Market Profile" script to help visualize where high volume nodes are occurring on higher-time frame candles.
Historical lookback is visually limited based on the number of candles TradingView provides on the chosen timeframe.
The script calculates the buy/sell pressure on the timeframe chosen, and aggregates volume up to the higher timeframe of choice (default: 4hr).
The volume for each candle is then normalized to assess how many standard deviations away from the mean it is. The color gradient on the chart is stronger for readings with more extreme z-scores.
Readings which are less than 2-standard deviations from the mean are not colored (white) - making it easier to visualize where the extremities of volume occur only.
Recommend using on default settings, on the 5-min of 15-min chart. Then hide the normal price data by clicking the "eye" symbol.
If you want to visualize historic periods, you can change the lookback settings.
Versionshinweise
Sourcing updateGeschütztes Skript
Dieses Script ist als Closed-Source veröffentlicht. Sie können es kostenlos und ohne Einschränkungen verwenden – erfahren Sie hier mehr.
Haftungsausschluss
Die Informationen und Veröffentlichungen sind nicht als Finanz-, Anlage-, Handels- oder andere Arten von Ratschlägen oder Empfehlungen gedacht, die von TradingView bereitgestellt oder gebilligt werden, und stellen diese nicht dar. Lesen Sie mehr in den Nutzungsbedingungen.
Geschütztes Skript
Dieses Script ist als Closed-Source veröffentlicht. Sie können es kostenlos und ohne Einschränkungen verwenden – erfahren Sie hier mehr.
Haftungsausschluss
Die Informationen und Veröffentlichungen sind nicht als Finanz-, Anlage-, Handels- oder andere Arten von Ratschlägen oder Empfehlungen gedacht, die von TradingView bereitgestellt oder gebilligt werden, und stellen diese nicht dar. Lesen Sie mehr in den Nutzungsbedingungen.