PROTECTED SOURCE SCRIPT
VP demo(Rolling period)
Introduction
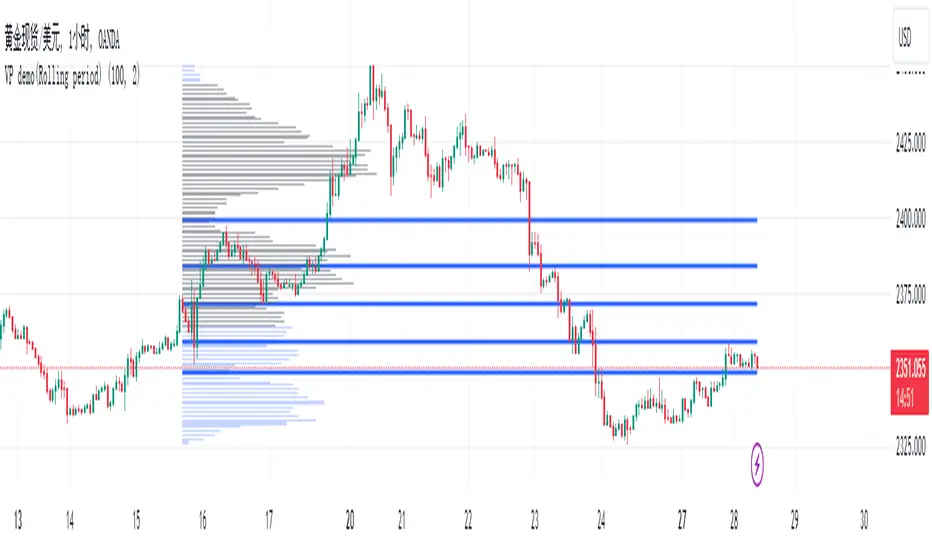
In the native VP (Volume Profile), the commonly referenced parameters are POC (Point of Control), VAH (Value Area High), and VAL (Value Area Low). However, since VAH and VAL are calculated by extending outward from the POC, their values heavily depend on the shape of the VP and the parameter settings of the value area ratio. This means their significance in identifying support and resistance in the market is limited. Based on VP, my algorithm is designed with two additional methods to identify low-volume points within a rolling time period, using them as reference points for support and resistance.
Current Algorithm Issues
When the candles update, you might notice overlapping support and resistance lines on the chart, or multiple lines appearing near the same location. This is due to TradingView's rendering issue, where old support and resistance lines that have been deleted in the code are not promptly removed from the chart. You only need to refer to the support and resistance lines that extend to the latest candle. If some lines remain at previous candles, it indicates that these points are outdated. As new candles continue to form, these lagging support and resistance lines will automatically disappear once the number of new candles reaches a certain threshold. Additionally, during significant market movements, you may see a large number of red lines. This is because the algorithm does not yet fully recognize abnormal market conditions. Future versions will gradually improve this aspect.
Geschütztes Skript
Dieses Script ist als Closed-Source veröffentlicht. Sie können es kostenlos und ohne Einschränkungen verwenden – erfahren Sie hier mehr.
Haftungsausschluss
Die Informationen und Veröffentlichungen sind nicht als Finanz-, Anlage-, Handels- oder andere Arten von Ratschlägen oder Empfehlungen gedacht, die von TradingView bereitgestellt oder gebilligt werden, und stellen diese nicht dar. Lesen Sie mehr in den Nutzungsbedingungen.