OPEN-SOURCE SCRIPT
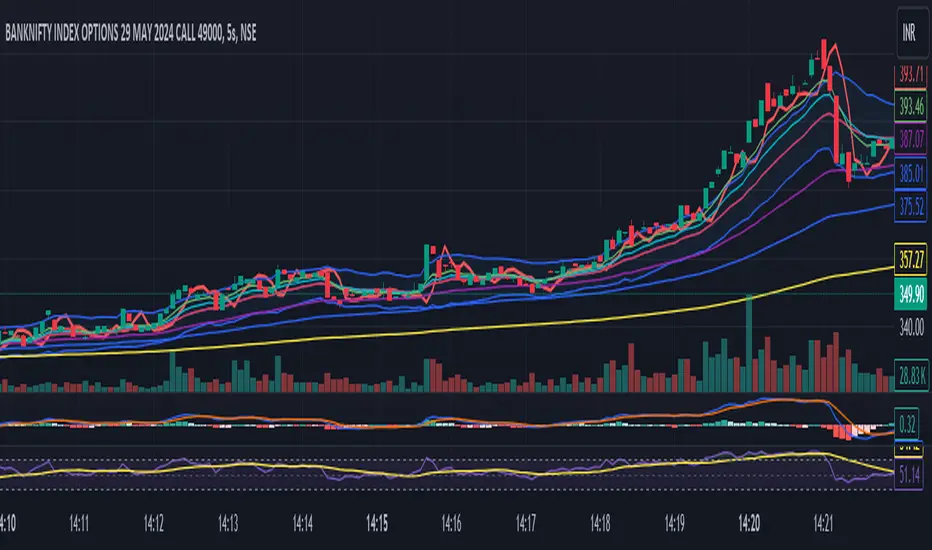
Linear Regression Intercept

Linear Regression Intercept (LRI) is a statistical method used to forecast future values based on past data. Financial markets frequently employ it to identify the underlying trend and determine when prices are overextended. Linear regression utilizes the least squares method to create a trendline by minimizing the distance between observed price data and the line. The LRI indicator calculates the intercept of this trendline for each data point, providing insights into price trends and potential trading opportunities.
Calculation and Interpretation of the LRI
The linear regression intercept is calculated using the following formula:
LRI = Y - (b * X)
Where Y represents the dependent variable (price), b is the slope of the regression line, and X is the independent variable (time). To determine the slope b, you can use the formula:
b = Σ[(X - X_mean) * (Y - Y_mean)] / Σ(X - X_mean)^2
Once you have computed the LRI, it can be interpreted as the point at which the regression line intersects the Y-axis (price) when the independent variable (time) is zero. A positive LRI value indicates an upward trend, while a negative value suggests a downward trend. Traders can adjust the parameters of the LRI by modifying the period over which the linear regression is computed, which can impact the indicator’s sensitivity to recent price changes.
How to Use the LRI in Trading
To effectively use the LRI in trading, traders should consider the following:
Understanding the signals generated by the technical indicator: A rising LRI suggests an upward trend, whereas a falling LRI indicates a downward trend. Traders may use this information to help determine the market’s direction and identify reversals.
Combining the technical indicator with other indicators: The LRI can be used in conjunction with other technical indicators, such as moving averages, the Relative Strength Index (RSI), or traditional linear regression lines, to obtain a more comprehensive view of the market. In the case of traditional linear regression lines, the LRI helps traders identify the starting point of the trend, providing additional context to the overall trend direction.
Using the technical indicator for entry and exit signals: When the LRI crosses above or below a specific threshold, traders may consider it a potential entry or exit point. For example, if the LRI crosses above zero, it might signal a possible buying opportunity.
Open-source Skript
Ganz im Sinne von TradingView hat dieser Autor sein/ihr Script als Open-Source veröffentlicht. Auf diese Weise können nun auch andere Trader das Script rezensieren und die Funktionalität überprüfen. Vielen Dank an den Autor! Sie können das Script kostenlos verwenden, aber eine Wiederveröffentlichung des Codes unterliegt unseren Hausregeln.
Haftungsausschluss
Die Informationen und Veröffentlichungen sind nicht als Finanz-, Anlage-, Handels- oder andere Arten von Ratschlägen oder Empfehlungen gedacht, die von TradingView bereitgestellt oder gebilligt werden, und stellen diese nicht dar. Lesen Sie mehr in den Nutzungsbedingungen.