OPEN-SOURCE SCRIPT
Aktualisiert Average price in candle
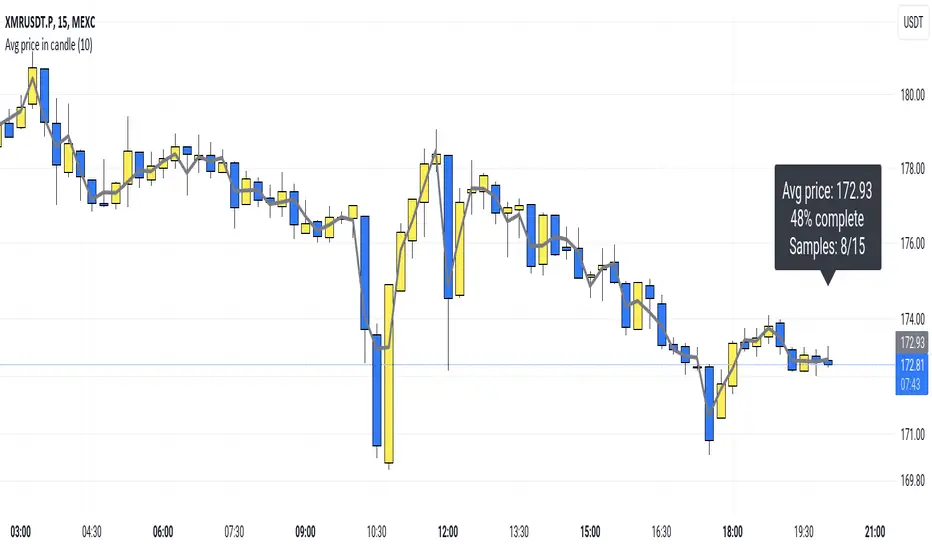
Plots the average price a security had within a candle.
So, for example: If you have a 15m candle, and price stayed near the candle's high for 10 out of the 15 minutes, you would expect the average price top be near the candle's high as well. And that's actually how it is.
(Blue 10:30 candle in the screenshot.)
I think this "average in-candle price" could be a useful thing to know. You can't gather this information from the normal chart (as you would need to go to a lower timeframe). Plus this plot can be smoother than plots of, say, closing price or hl2.
The calculation happens in a lower timeframe which is selected automatically. There is a precision selector which allows you to influence this. By default, at least 10 values are sampled for each candle.
If you have TradingView Premium, the script is able to use second-based intervals to look inside 1m candles. (Tick the corresponding checkbox to enable this.)
How it works: I collect timestamps and hl2 values from the lower timeframe. (I figure hl2 is the best choice here because a close is so arbitrary. If we don't have further information, our guess is the average is simply exactly in the middle of the candle's range.)
Then I throw the last close and current close (from the CHART timeframe) into the mix and calculate an average of the prices we collected weighted by the duration that price was in effect.
tl;dr; It's just math baby
Versionshinweise
Made the line slightly transparent (nice if you put it in front of the candles)Open-source Skript
Ganz im Sinne von TradingView hat dieser Autor sein/ihr Script als Open-Source veröffentlicht. Auf diese Weise können nun auch andere Trader das Script rezensieren und die Funktionalität überprüfen. Vielen Dank an den Autor! Sie können das Script kostenlos verwenden, aber eine Wiederveröffentlichung des Codes unterliegt unseren Hausregeln.
Haftungsausschluss
Die Informationen und Veröffentlichungen sind nicht als Finanz-, Anlage-, Handels- oder andere Arten von Ratschlägen oder Empfehlungen gedacht, die von TradingView bereitgestellt oder gebilligt werden, und stellen diese nicht dar. Lesen Sie mehr in den Nutzungsbedingungen.
Open-source Skript
Ganz im Sinne von TradingView hat dieser Autor sein/ihr Script als Open-Source veröffentlicht. Auf diese Weise können nun auch andere Trader das Script rezensieren und die Funktionalität überprüfen. Vielen Dank an den Autor! Sie können das Script kostenlos verwenden, aber eine Wiederveröffentlichung des Codes unterliegt unseren Hausregeln.
Haftungsausschluss
Die Informationen und Veröffentlichungen sind nicht als Finanz-, Anlage-, Handels- oder andere Arten von Ratschlägen oder Empfehlungen gedacht, die von TradingView bereitgestellt oder gebilligt werden, und stellen diese nicht dar. Lesen Sie mehr in den Nutzungsbedingungen.