OPEN-SOURCE SCRIPT
Candle Height in Percentage - Columns
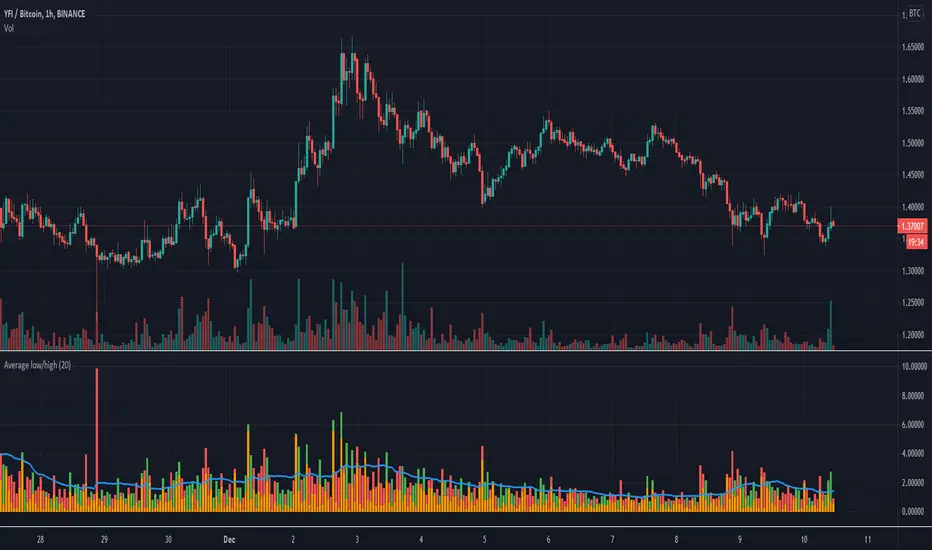
This indicator calculates the difference in percentage between lows and highs of a candle. The orange bars show the height of the candle body (open/close) and the red/green on top show the percentage of the wicks (high/low). This assists in understanding the volatility of an asset. Showing this in percentages is more helpful in crypto. It also shows the Simple Moving Average of this data with the blue line.
Open-source Skript
Ganz im Sinne von TradingView hat dieser Autor sein/ihr Script als Open-Source veröffentlicht. Auf diese Weise können nun auch andere Trader das Script rezensieren und die Funktionalität überprüfen. Vielen Dank an den Autor! Sie können das Script kostenlos verwenden, aber eine Wiederveröffentlichung des Codes unterliegt unseren Hausregeln.
Haftungsausschluss
Die Informationen und Veröffentlichungen sind nicht als Finanz-, Anlage-, Handels- oder andere Arten von Ratschlägen oder Empfehlungen gedacht, die von TradingView bereitgestellt oder gebilligt werden, und stellen diese nicht dar. Lesen Sie mehr in den Nutzungsbedingungen.