OPEN-SOURCE SCRIPT
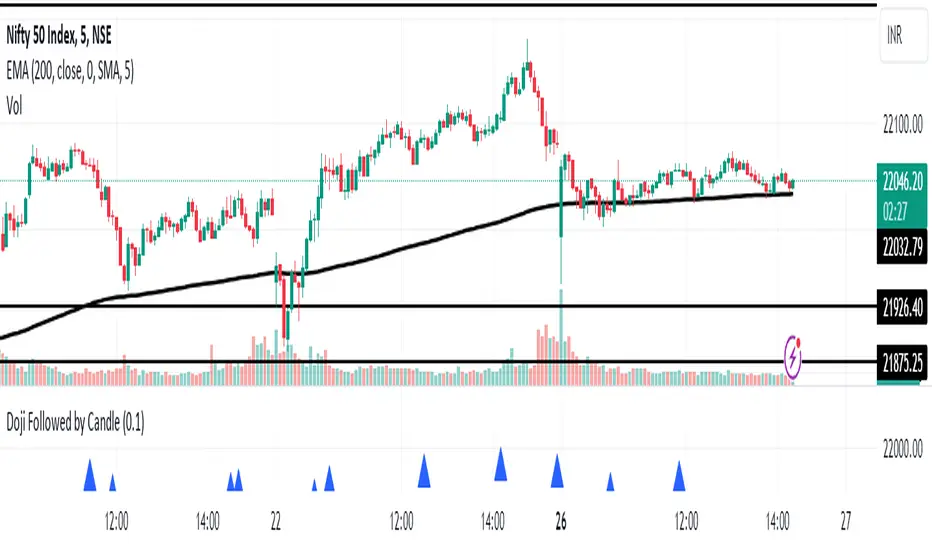
Doji Followed by Bullish or Bearish Candle

This indicator identifies instances where a doji candlestick pattern is followed by either a bullish or bearish candle, indicating potential reversal or continuation signals in the market.
Features:
Doji Detection: Utilizes the concept of doji candlesticks, where the difference between the open and close prices is minimal compared to the candle's overall range.
Candlestick Identification: Determines whether the following candle is bullish (close > open) or bearish (close < open).
Customizable Threshold: Allows users to adjust the sensitivity of the doji detection by modifying the doji body factor parameter.
Alerts: Generates alerts when a doji candle is followed by a bullish or bearish candle, signaling potential trading opportunities.
How to Use:
When a blue triangle appears below a candle, it indicates that a doji candle was followed by a bullish or bearish candle.
Traders can interpret these signals as potential entry or exit points in their trading strategies.
Note: This indicator should be used in conjunction with other technical analysis tools and indicators for comprehensive market analysis.
Open-source Skript
Ganz im Sinne von TradingView hat dieser Autor sein/ihr Script als Open-Source veröffentlicht. Auf diese Weise können nun auch andere Trader das Script rezensieren und die Funktionalität überprüfen. Vielen Dank an den Autor! Sie können das Script kostenlos verwenden, aber eine Wiederveröffentlichung des Codes unterliegt unseren Hausregeln.
Haftungsausschluss
Die Informationen und Veröffentlichungen sind nicht als Finanz-, Anlage-, Handels- oder andere Arten von Ratschlägen oder Empfehlungen gedacht, die von TradingView bereitgestellt oder gebilligt werden, und stellen diese nicht dar. Lesen Sie mehr in den Nutzungsbedingungen.