OPEN-SOURCE SCRIPT
The RSP/VOO indicator
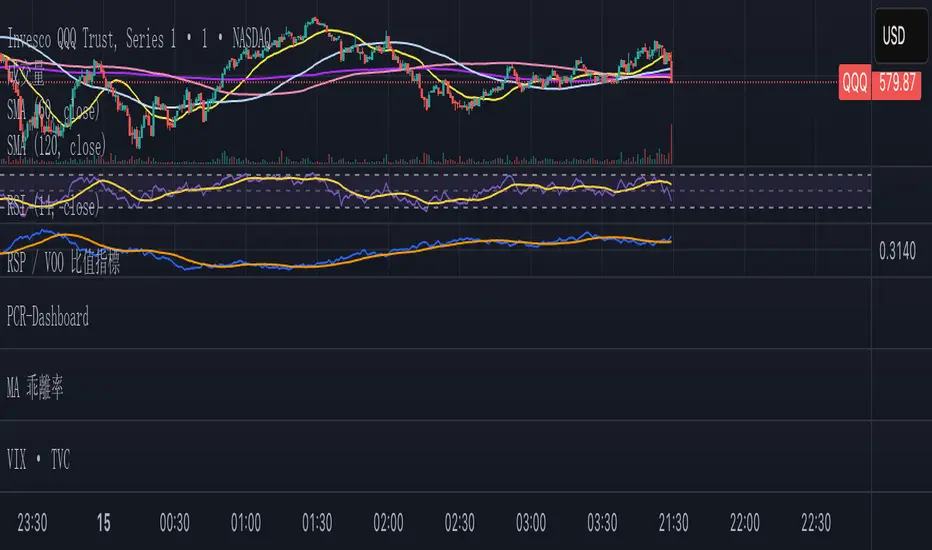
The RSP/VOO indicator refers to the ratio between the performance of two exchange-traded funds (ETFs): RSP (Invesco S&P 500 Equal Weight ETF) and VOO (Vanguard S&P 500 ETF). RSP tracks an equal-weighted version of the S&P 500 index, meaning each of the 500 stocks in the index is given the same weight regardless of company size. In contrast, VOO is a market-cap-weighted ETF, where larger companies (like Apple or Microsoft) have a greater influence on the fund's performance based on their market capitalization.
This ratio (RSP divided by VOO) is often used as a market breadth indicator in finance. When the RSP/VOO ratio rises, it suggests that smaller or mid-sized stocks in the S&P 500 are outperforming the largest ones, indicating broader market participation and potentially healthier overall market conditions. Conversely, when the ratio falls, it implies that a few mega-cap stocks are driving the market's gains, which can signal increased concentration risk or a narrower rally. For example, RSP provides more diversified exposure by reducing concentration in large-cap stocks, while VOO reflects the dominance of top-weighted holdings. Investors might monitor this ratio to gauge market sentiment, with RSP historically showing higher expense ratios (around 0.20%) compared to VOO's lower fees (about 0.03%), but offering potentially better risk-adjusted returns in certain environments.1.6秒
This ratio (RSP divided by VOO) is often used as a market breadth indicator in finance. When the RSP/VOO ratio rises, it suggests that smaller or mid-sized stocks in the S&P 500 are outperforming the largest ones, indicating broader market participation and potentially healthier overall market conditions. Conversely, when the ratio falls, it implies that a few mega-cap stocks are driving the market's gains, which can signal increased concentration risk or a narrower rally. For example, RSP provides more diversified exposure by reducing concentration in large-cap stocks, while VOO reflects the dominance of top-weighted holdings. Investors might monitor this ratio to gauge market sentiment, with RSP historically showing higher expense ratios (around 0.20%) compared to VOO's lower fees (about 0.03%), but offering potentially better risk-adjusted returns in certain environments.1.6秒
Open-source Skript
Ganz im Sinne von TradingView hat dieser Autor sein/ihr Script als Open-Source veröffentlicht. Auf diese Weise können nun auch andere Trader das Script rezensieren und die Funktionalität überprüfen. Vielen Dank an den Autor! Sie können das Script kostenlos verwenden, aber eine Wiederveröffentlichung des Codes unterliegt unseren Hausregeln.
Haftungsausschluss
Die Informationen und Veröffentlichungen sind nicht als Finanz-, Anlage-, Handels- oder andere Arten von Ratschlägen oder Empfehlungen gedacht, die von TradingView bereitgestellt oder gebilligt werden, und stellen diese nicht dar. Lesen Sie mehr in den Nutzungsbedingungen.