OPEN-SOURCE SCRIPT
Aktualisiert Horizontal Price Table
Overview:
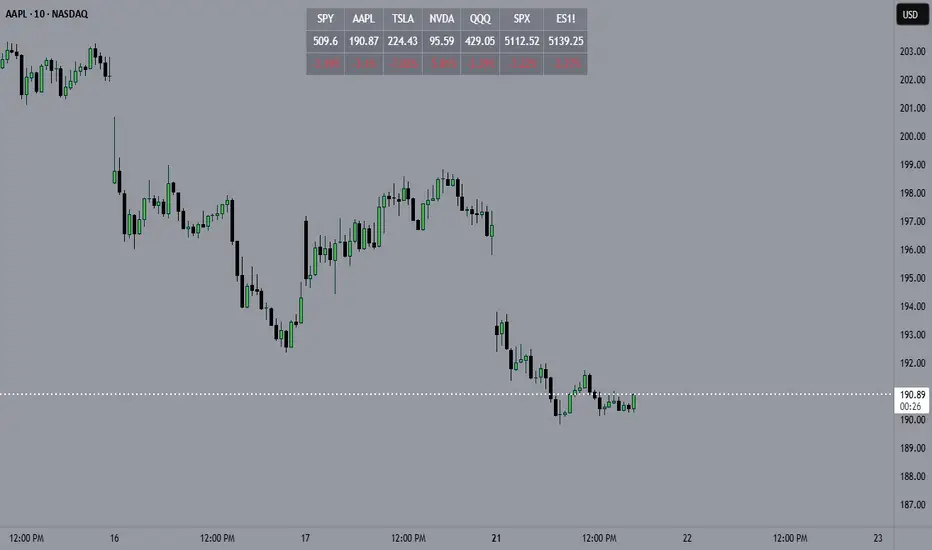
This script displays a dynamic price table on your chart, showing real-time prices and daily percentage changes for up to 7 user-defined tickers. You can customize both which tickers are shown and how many are visible, all through the settings panel.
How it works (Step-by-Step):
User-Defined Tickers:
The script provides input fields for up to 7 tickers using input.symbol(). You can track stocks, indexes, ETFs, crypto, or futures — anything supported by TradingView.
Choose How Many to Display:
An additional dropdown lets you choose how many of the 7 tickers to actually display (between 1 and 7). This gives you control over screen space and focus.
Market Data Fetching:
For each displayed ticker, the script fetches:
The current day’s closing price (close)
The previous day’s closing price (close[1])
This data is pulled using request.security() on the daily timeframe (1D).
% Change Calculation:
The script calculates the daily percentage change using:
(Current Price−Previous Close)/Previous Close×100(Current Price−Previous Close)/Previous Close×100
Cleaned Ticker Names:
Ticker symbols often include an exchange prefix like NASDAQ:AAPL. The script automatically removes anything before the colon (:), so only the clean symbol (e.g., AAPL) is shown in the table.
Table Display:
A visual table appears at the top-center of your chart, showing:
Customization:
Why Use This Script?
Tips:
This script displays a dynamic price table on your chart, showing real-time prices and daily percentage changes for up to 7 user-defined tickers. You can customize both which tickers are shown and how many are visible, all through the settings panel.
How it works (Step-by-Step):
User-Defined Tickers:
The script provides input fields for up to 7 tickers using input.symbol(). You can track stocks, indexes, ETFs, crypto, or futures — anything supported by TradingView.
Choose How Many to Display:
An additional dropdown lets you choose how many of the 7 tickers to actually display (between 1 and 7). This gives you control over screen space and focus.
Market Data Fetching:
For each displayed ticker, the script fetches:
The current day’s closing price (close)
The previous day’s closing price (close[1])
This data is pulled using request.security() on the daily timeframe (1D).
% Change Calculation:
The script calculates the daily percentage change using:
(Current Price−Previous Close)/Previous Close×100(Current Price−Previous Close)/Previous Close×100
Cleaned Ticker Names:
Ticker symbols often include an exchange prefix like NASDAQ:AAPL. The script automatically removes anything before the colon (:), so only the clean symbol (e.g., AAPL) is shown in the table.
Table Display:
A visual table appears at the top-center of your chart, showing:
- Row 1: Ticker symbol (cleaned)
- Row 2: Current price (rounded to 2 decimals)
- Row 3: Daily % change (green for gains, red for losses)
Customization:
- You can choose the background color of the table.
- Ticker names appear in white text with a gray background.
- % change is color-coded: green for positive, red for negative.
Why Use This Script?
- Track multiple tickers at once without leaving your chart.
- Clean, customizable layout.
- Useful for monitoring watchlists, portfolios, or related markets.
Tips:
- Combine this with your favorite indicators for a personalized dashboard.
- Works great on any chart or timeframe.
- Ensure the tickers entered are valid on TradingView (e.g., SPY, BTCUSD, NQ1!, etc.).
Versionshinweise
Overview:This script displays a dynamic price table on your chart, showing real-time prices and daily percentage changes for up to 7 user-defined tickers. You can customize both which tickers are shown and how many are visible, all through the settings panel.
How it works (Step-by-Step):
User-Defined Tickers:
The script provides input fields for up to 7 tickers using input.symbol(). You can track stocks, indexes, ETFs, crypto, or futures — anything supported by TradingView.
Choose How Many to Display:
An additional dropdown lets you choose how many of the 7 tickers to actually display (between 1 and 7). This gives you control over screen space and focus.
Market Data Fetching:
For each displayed ticker, the script fetches:
The current day’s closing price (close)
The previous day’s closing price (close[1])
This data is pulled using request.security() on the daily timeframe (1D).
% Change Calculation:
The script calculates the daily percentage change using:
(Current Price−Previous Close)/Previous Close×100(Current Price−Previous Close)/Previous Close×100
Cleaned Ticker Names:
Ticker symbols often include an exchange prefix like NASDAQ:AAPL. The script automatically removes anything before the colon (:), so only the clean symbol (e.g., AAPL) is shown in the table.
Table Display:
A visual table appears at the top-center of your chart, showing:
- Row 1: Ticker symbol (cleaned)
- Row 2: Current price (rounded to 2 decimals)
- Row 3: Daily % change (green for gains, red for losses)
Customization:
- You can choose the background color of the table.
- Ticker names appear in white text with a gray background.
% change is color-coded: green for positive, red for negative.
Why Use This Script?
- Track multiple tickers at once without leaving your chart.
- Clean, customizable layout.
- Useful for monitoring watchlists, portfolios, or related markets.
Tips:
- Combine this with your favorite indicators for a personalized dashboard.
- Works great on any chart or timeframe.
- Ensure the tickers entered are valid on TradingView (e.g., SPY, BTCUSD, NQ1!, etc.).
Open-source Skript
Ganz im Sinne von TradingView hat dieser Autor sein/ihr Script als Open-Source veröffentlicht. Auf diese Weise können nun auch andere Trader das Script rezensieren und die Funktionalität überprüfen. Vielen Dank an den Autor! Sie können das Script kostenlos verwenden, aber eine Wiederveröffentlichung des Codes unterliegt unseren Hausregeln.
Haftungsausschluss
Die Informationen und Veröffentlichungen sind nicht als Finanz-, Anlage-, Handels- oder andere Arten von Ratschlägen oder Empfehlungen gedacht, die von TradingView bereitgestellt oder gebilligt werden, und stellen diese nicht dar. Lesen Sie mehr in den Nutzungsbedingungen.