OPEN-SOURCE SCRIPT
Aktualisiert FV 15min MS_230906_co
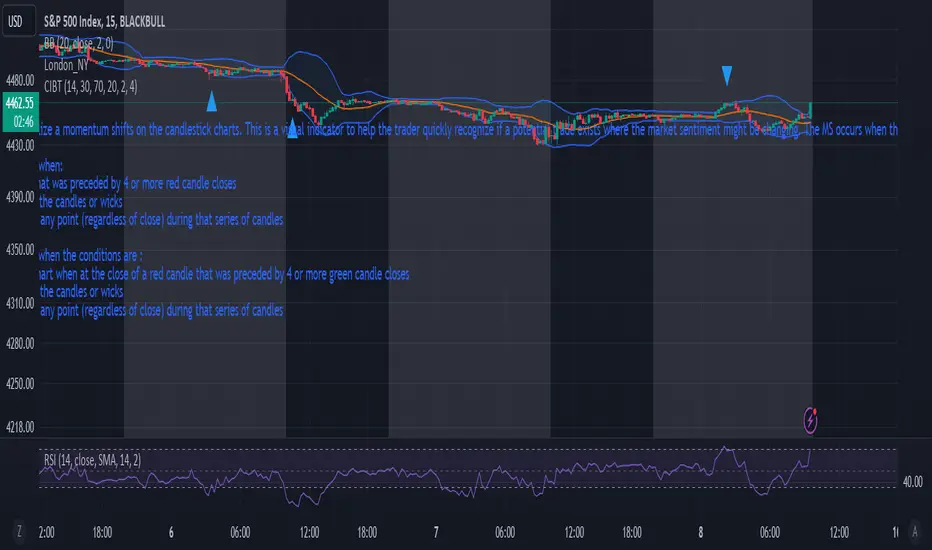
This script allows the user to visualize a momentum shifts on the candlestick charts. This is a visual indicator to help the trader quickly recognize if a potential trade exists where the market sentiment might be changing. The MS occurs when the below parameters are followed:
Creates blue triangle on the chart when:
1) at the close of a green candle that was preceded by 4 or more red candle closes
2) The RSI falls below 30 during of the candles or wicks
3) The bollinger band is pierced at any point (regardless of close) during that series of candles
Creates blue triangle on the chart when the conditions are :
1) creates a blue triangle on the chart when at the close of a red candle that was preceded by 4 or more green candle closes
2) The RSI goes above 70 during of the candles or wicks
3) The bollinger band is pierced at any point (regardless of close) during that series of candles
Versionshinweise
This script allows the user to visualize a momentum shifts on the candlestick charts. This is a visual indicator to help the trader quickly recognize if a potential trade exists where the market sentiment might be changing. The MS occurs when the below parameters are followed:Creates blue triangle on the chart when:
1) at the close of a green candle that was preceded by 4 or more red candle closes
2) The RSI falls below 30 during of the candles or wicks
3) The bollinger band is pierced at any point (regardless of close) during that series of candles
Creates blue triangle on the chart when the conditions are :
1) creates a blue triangle on the chart when at the close of a red candle that was preceded by 4 or more green candle closes
2) The RSI goes above 70 during of the candles or wicks
3) The bollinger band is pierced at any point (regardless of close) during that series of candles
Open-source Skript
Ganz im Sinne von TradingView hat dieser Autor sein/ihr Script als Open-Source veröffentlicht. Auf diese Weise können nun auch andere Trader das Script rezensieren und die Funktionalität überprüfen. Vielen Dank an den Autor! Sie können das Script kostenlos verwenden, aber eine Wiederveröffentlichung des Codes unterliegt unseren Hausregeln.
Haftungsausschluss
Die Informationen und Veröffentlichungen sind nicht als Finanz-, Anlage-, Handels- oder andere Arten von Ratschlägen oder Empfehlungen gedacht, die von TradingView bereitgestellt oder gebilligt werden, und stellen diese nicht dar. Lesen Sie mehr in den Nutzungsbedingungen.