OPEN-SOURCE SCRIPT
Aktualisiert Biquad MACD

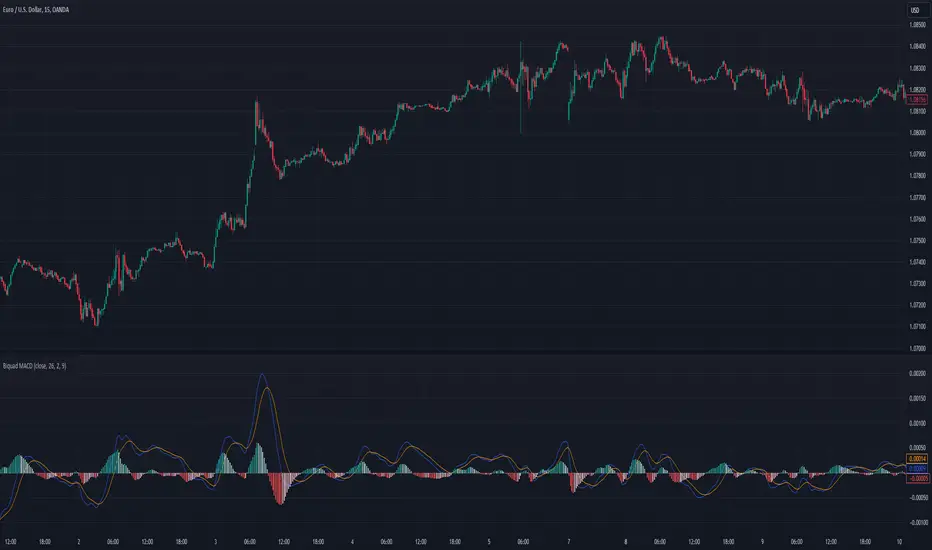
This indicator reimagines the traditional MACD by incorporating a biquad band pass filter, offering a refined approach to identifying momentum and trend changes in price data. The standard MACD is essentially a band pass filter, but often it lacks precision. The biquad band pass filter addresses this limitation by providing a more focused frequency range, enhancing the quality of signals.
The MACD Length parameter determines the length of the band pass filter, influencing the frequency range that is isolated. Adjusting this length allows you to focus on different parts of the price movement spectrum.
The Bandwidth (BW) setting controls the width of the frequency band in octaves. It affects the smoothness of the MACD line. A larger bandwidth results in less smooth output, capturing a broader range of frequencies, while a smaller bandwidth focuses on a narrower range, providing a smoother signal.
The Signal Length parameter sets the period for the exponential moving average of the MACD line, which acts as a signal line to identify potential buy and sell points.
Key Features of the Biquad MACD
The MACD is a well-known momentum indicator used to identify changes in the strength, direction, momentum, and duration of a trend in a stock's price. By applying a biquad band pass filter, this version of the MACD provides a more refined and accurate representation of price movements.
The biquad filter offers smooth response and minimal phase distortion, making it ideal for technical analysis. The customizable MACD length and bandwidth allow for flexible adaptation to different trading strategies and market conditions. The signal line smooths the MACD values, providing clear crossover points to indicate potential market entry and exit signals.
The histogram visually represents the difference between the MACD and the signal line, changing colors to indicate rising or falling momentum, which helps in quickly identifying trend changes.
By incorporating the Biquad MACD into your trading toolkit, you can enhance your chart analysis with clearer insights into momentum and trend changes, leading to more informed trading decisions.
Open-source Skript
Ganz im Sinne von TradingView hat dieser Autor sein/ihr Script als Open-Source veröffentlicht. Auf diese Weise können nun auch andere Trader das Script rezensieren und die Funktionalität überprüfen. Vielen Dank an den Autor! Sie können das Script kostenlos verwenden, aber eine Wiederveröffentlichung des Codes unterliegt unseren Hausregeln.
Haftungsausschluss
Die Informationen und Veröffentlichungen sind nicht als Finanz-, Anlage-, Handels- oder andere Arten von Ratschlägen oder Empfehlungen gedacht, die von TradingView bereitgestellt oder gebilligt werden, und stellen diese nicht dar. Lesen Sie mehr in den Nutzungsbedingungen.
