OPEN-SOURCE SCRIPT
[S] Rolling Trendline
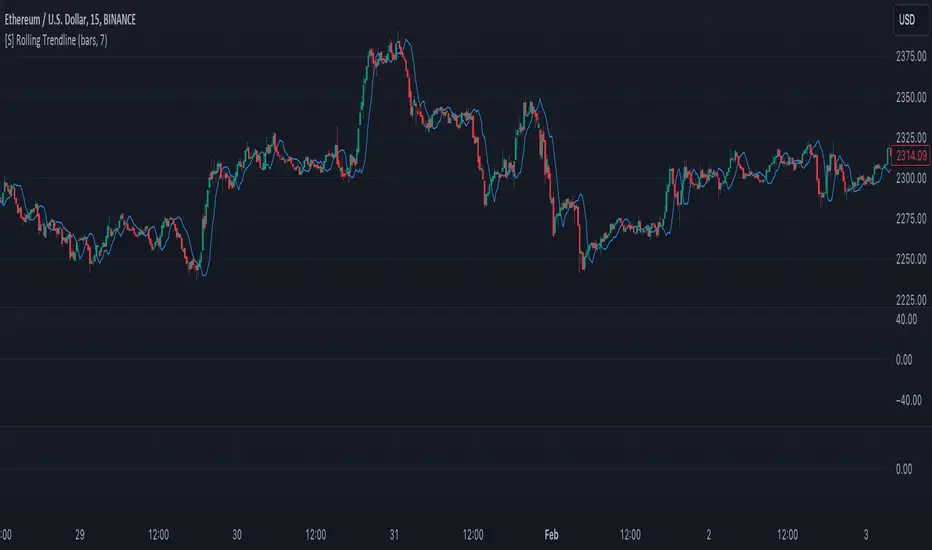
The Rolling Linear Regression Trendline is a sophisticated technical analysis tool designed to offer traders a dynamic view of market trends over a selectable period. This indicator employs linear regression to calculate and plot a trendline that best fits the closing prices within a specified window, either defined by a number of bars or a set period in days, independent of the chart's timeframe.
Key Features:
Dynamic Window Selection: Users can choose the calculation window based on a fixed number of bars or days, providing flexibility to adapt to different trading strategies and timeframes. For the 'days' option, the indicator calculates the equivalent number of bars based on the chart's timeframe, ensuring relevance across various market conditions and trading sessions.
Linear Regression Analysis: At its core, the indicator uses linear regression to identify the trend direction by calculating the slope and intercept of the trendline. This method offers a statistical approach to trend analysis, highlighting potential uptrends or downtrends based on the positioning and direction of the trendline.
Customizable Period: Traders can input their desired period (N), allowing for tailored analysis. Whether it's short-term movements or longer-term trends, the indicator can adjust to focus on specific time horizons, enhancing its utility across different trading styles and objectives.
Applications:
Trend Identification: By plotting a trendline that mathematically fits the closing prices over the chosen period, traders can quickly identify the prevailing market trend, aiding in bullish or bearish decision-making.
Support and Resistance: The trendline can also serve as a dynamic level of support or resistance, offering potential entry or exit points based on the price's interaction with the trendline.
Strategic Planning: With the ability to adjust the calculation window, traders can align the indicator with their trading strategy, whether focusing on intraday movements or broader swings.
Using this indicator with other parameters can widen you view of the market and help identifying trends
Open-source Skript
Ganz im Sinne von TradingView hat dieser Autor sein/ihr Script als Open-Source veröffentlicht. Auf diese Weise können nun auch andere Trader das Script rezensieren und die Funktionalität überprüfen. Vielen Dank an den Autor! Sie können das Script kostenlos verwenden, aber eine Wiederveröffentlichung des Codes unterliegt unseren Hausregeln.
Haftungsausschluss
Die Informationen und Veröffentlichungen sind nicht als Finanz-, Anlage-, Handels- oder andere Arten von Ratschlägen oder Empfehlungen gedacht, die von TradingView bereitgestellt oder gebilligt werden, und stellen diese nicht dar. Lesen Sie mehr in den Nutzungsbedingungen.