OPEN-SOURCE SCRIPT
Autocorrelogram (YavuzAkbay)

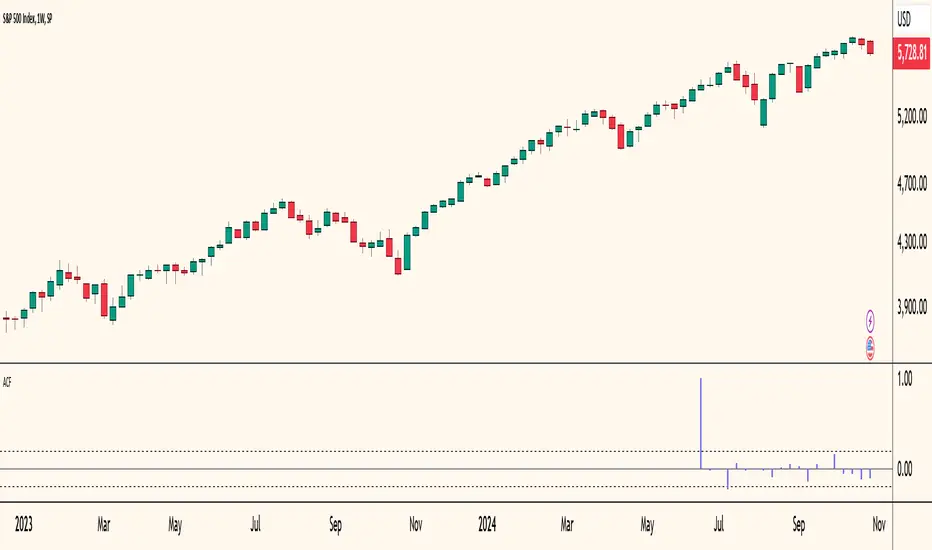
The Autocorrelogram (ACF) is a statistical tool designed for traders and analysts to evaluate the autocorrelation of price movements over time. Autocorrelation measures the correlation of a signal with a delayed version of itself, providing insights into the degree to which past price movements influence future price movements. This indicator is particularly useful for identifying trends and patterns in time series data, helping traders make informed decisions based on historical price behavior.
Key Components and Functionality
1. Input Parameters:
2. Core Calculations:
3. Autocorrelation Calculation:
4. Visualization:
How to Use the ACF Indicator
Key Components and Functionality
1. Input Parameters:
- Sample Size: This parameter defines the number of data points used in the calculation of the autocorrelation function. A minimum value of 9 ensures statistical relevance. The default value is set to 100, which provides a broad view of the price behavior.
- Data Source: Users can select the price data they wish to analyze (e.g., closing prices). This flexibility allows traders to apply the ACF to various price types, depending on their trading strategy.
- Significance Level: This parameter determines the threshold for statistical significance in the autocorrelation values. The default value is set at 1.96, corresponding to a 95% confidence level, but users can adjust it to their preferences.
- Calculate Change: This boolean option allows users to choose whether to calculate the change in the selected data source (e.g., daily price changes) rather than using the raw data. Analyzing changes can highlight momentum shifts that may be obscured in absolute price levels.
2. Core Calculations:
- Simple Moving Average (SMA): The indicator computes the SMA of the selected data source over the defined sample size. This average serves as a baseline for assessing deviations in price behavior.
- Variance Calculation: The variance of the price changes is calculated to understand the spread of the data. The variance is scaled by the sample size to ensure that the autocorrelation values are appropriately normalized.
- Lag Value: The indicator calculates a lag value based on the sample size to determine how many periods back the autocorrelation will be calculated. This helps in assessing correlations at different time intervals.
3. Autocorrelation Calculation:
- The script calculates the autocorrelation for lags ranging from 0 to 53. For each lag, it computes the autocovariance (the correlation of the signal with itself at different time intervals) and normalizes this by the variance. The result is a set of autocorrelation values that indicate the strength and direction of the relationship between current and past price movements.
4. Visualization:
- The autocorrelation values are plotted as lines on the chart, with different colors indicating positive and negative correlations. Lines are dynamically drawn for each lag, providing a visual representation of how past prices influence current prices. A maximum of 54 lines (for lags 0 to 53) is maintained, with the oldest line being removed when the limit is exceeded.
- Significance Levels: Horizontal lines are drawn at the defined significance levels, helping traders quickly identify when the autocorrelation values exceed the statistically significant threshold. These lines serve as benchmarks for interpreting the relevance of the autocorrelation values.
How to Use the ACF Indicator
- Identifying Trends: Traders can use the ACF indicator to spot trends in the data. Strong positive autocorrelation at a given lag indicates that past price movements have a lasting influence on future movements, suggesting a potential continuation of the current trend. Conversely, significant negative autocorrelation may indicate reversals or mean reversion.
- Decision Making: By comparing the autocorrelation values against the significance levels, traders can make informed decisions. For example, if the autocorrelation at lag 1 is significantly positive, it may suggest that a trend is likely to persist in the immediate future, prompting traders to consider long positions.
- Setting Parameters: Adjusting the sample size and significance level allows traders to tailor the indicator to their specific market conditions and trading style. A larger sample size may provide more stable estimates but could obscure short-term fluctuations, while a smaller size may capture quick changes but with higher variability.
- Combining with Other Indicators: The ACF can be used in conjunction with other technical indicators (like Moving Averages or RSI) to enhance trading strategies. Confirming signals from multiple indicators can provide stronger trade confirmations.
Open-source Skript
Ganz im Sinne von TradingView hat dieser Autor sein/ihr Script als Open-Source veröffentlicht. Auf diese Weise können nun auch andere Trader das Script rezensieren und die Funktionalität überprüfen. Vielen Dank an den Autor! Sie können das Script kostenlos verwenden, aber eine Wiederveröffentlichung des Codes unterliegt unseren Hausregeln.
Haftungsausschluss
Die Informationen und Veröffentlichungen sind nicht als Finanz-, Anlage-, Handels- oder andere Arten von Ratschlägen oder Empfehlungen gedacht, die von TradingView bereitgestellt oder gebilligt werden, und stellen diese nicht dar. Lesen Sie mehr in den Nutzungsbedingungen.