OPEN-SOURCE SCRIPT
Aktualisiert FalconRed 3 Candlestick Levels
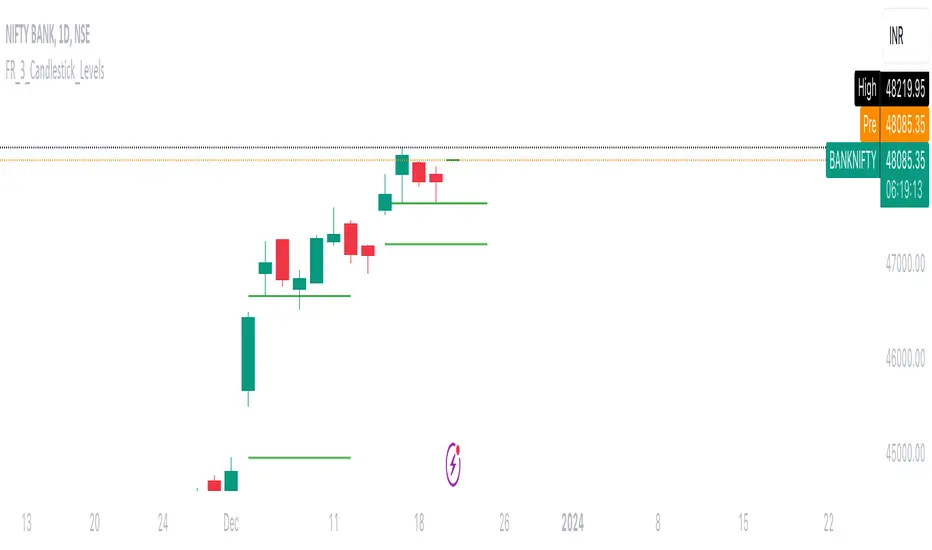
This Pine Script indicator is designed to enhance price action analysis by identifying specific candle patterns that signal potential buying and selling levels. The analysis is based on the characteristics of the current candle and its two immediate predecessors.
For identifying buying levels, the script examines the wicks of the candles, highlighting areas where buying and selling struggle is evident. The indicator recognizes significant breaks above wick levels, especially when followed by a subsequent candle with a lower wick. This combination suggests that previous selling pressure has been challenged and overcome.
Buy breakout and retest levels are highlighted with green color, providing a clear visual indication of potential buying opportunities. The indicator draws horizontal lines that extend to the right, offering insights into the frequency of retests and the recurrence of similar patterns in specific price zones, thereby confirming and reinforcing the observed price action.
Similarly, the indicator scrutinizes the selling side, pinpointing breakdown and retest levels. These areas are highlighted with red color, aiding in the identification of potential selling opportunities.
This indicator serves as a valuable tool for analyzing price action levels and visualizing buying and selling areas. It can be effectively combined with other technical indicators to enhance confidence in trading decisions. Gain deeper insights into market dynamics and improve decision-making by integrating this candle pattern analysis indicator into your trading strategy.
Versionshinweise
This Pine Script indicator is designed to enhance price action analysis by identifying specific candle patterns that signal potential buying and selling levels. The analysis is based on the characteristics of the current candle and its two immediate predecessors.For identifying buying levels, the script examines the wicks of the candles, highlighting areas where buying and selling struggle is evident. The indicator recognizes significant breaks above wick levels, especially when followed by a subsequent candle with a lower wick. This combination suggests that previous selling pressure has been challenged and overcome.
Buy breakout and retest levels are highlighted with green color, providing a clear visual indication of potential buying opportunities. The indicator draws horizontal lines that extend to the right, offering insights into the frequency of retests and the recurrence of similar patterns in specific price zones, thereby confirming and reinforcing the observed price action.
Similarly, the indicator scrutinizes the selling side, pinpointing breakdown and retest levels. These areas are highlighted with red color, aiding in the identification of potential selling opportunities.
This indicator serves as a valuable tool for analyzing price action levels and visualizing buying and selling areas. It can be effectively combined with other technical indicators to enhance confidence in trading decisions. Gain deeper insights into market dynamics and improve decision-making by integrating this candle pattern analysis indicator into your trading strategy.
Open-source Skript
Ganz im Sinne von TradingView hat dieser Autor sein/ihr Script als Open-Source veröffentlicht. Auf diese Weise können nun auch andere Trader das Script rezensieren und die Funktionalität überprüfen. Vielen Dank an den Autor! Sie können das Script kostenlos verwenden, aber eine Wiederveröffentlichung des Codes unterliegt unseren Hausregeln.
Haftungsausschluss
Die Informationen und Veröffentlichungen sind nicht als Finanz-, Anlage-, Handels- oder andere Arten von Ratschlägen oder Empfehlungen gedacht, die von TradingView bereitgestellt oder gebilligt werden, und stellen diese nicht dar. Lesen Sie mehr in den Nutzungsbedingungen.