PROTECTED SOURCE SCRIPT
Aktualisiert Cumulative volume analysis
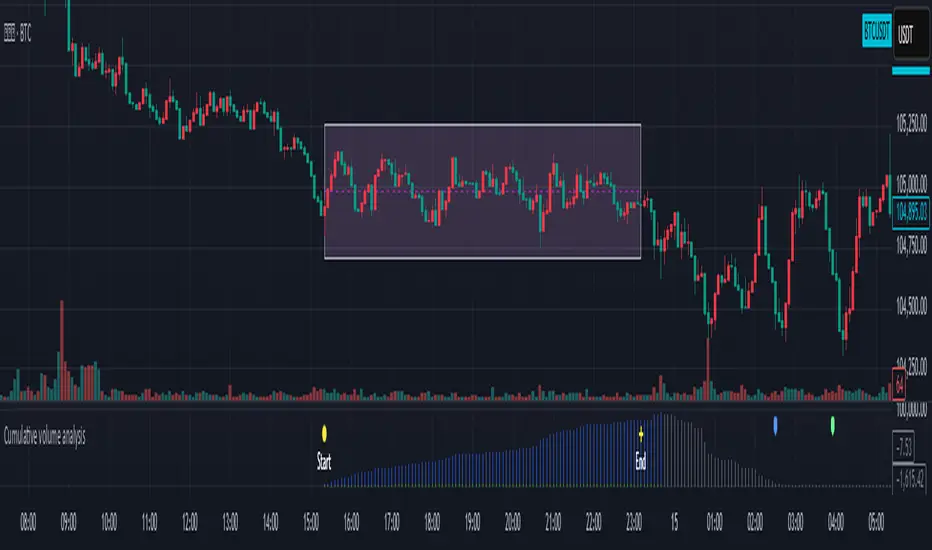
After user define the ragion area. While break out the region area, you can try this indicator to notice when the power is ended and maybe reverse the trend.
1. The user enters the start time, and end time
2. The indicator will record the highest, lowest price, and cumulative amount during this period.
The cumulative amount is calculated by adding up the amount of each K bar, regardless of whether it rises or falls.
3. When the cumulative amount is reduced to less than or equal to 0, make a plotshape arrow
4.There are two diferent method to record the volume. Try the better way to different product.
Versionshinweise
Added more explanation below:This indicator is suitable for short-term use. I prefer the range of 5 minutes K to 1 hour K.
The chart uses 5 points K as an example.
I think this concept is my own idea, and there is no plagiarism.
If you like it, like it or share it
Versionshinweise
Change some description into English version.Geschütztes Skript
Dieses Script ist als Closed-Source veröffentlicht. Sie können es kostenlos und ohne Einschränkungen verwenden – erfahren Sie hier mehr.
Haftungsausschluss
Die Informationen und Veröffentlichungen sind nicht als Finanz-, Anlage-, Handels- oder andere Arten von Ratschlägen oder Empfehlungen gedacht, die von TradingView bereitgestellt oder gebilligt werden, und stellen diese nicht dar. Lesen Sie mehr in den Nutzungsbedingungen.
Geschütztes Skript
Dieses Script ist als Closed-Source veröffentlicht. Sie können es kostenlos und ohne Einschränkungen verwenden – erfahren Sie hier mehr.
Haftungsausschluss
Die Informationen und Veröffentlichungen sind nicht als Finanz-, Anlage-, Handels- oder andere Arten von Ratschlägen oder Empfehlungen gedacht, die von TradingView bereitgestellt oder gebilligt werden, und stellen diese nicht dar. Lesen Sie mehr in den Nutzungsbedingungen.