OPEN-SOURCE SCRIPT
High Volume Vector Candles
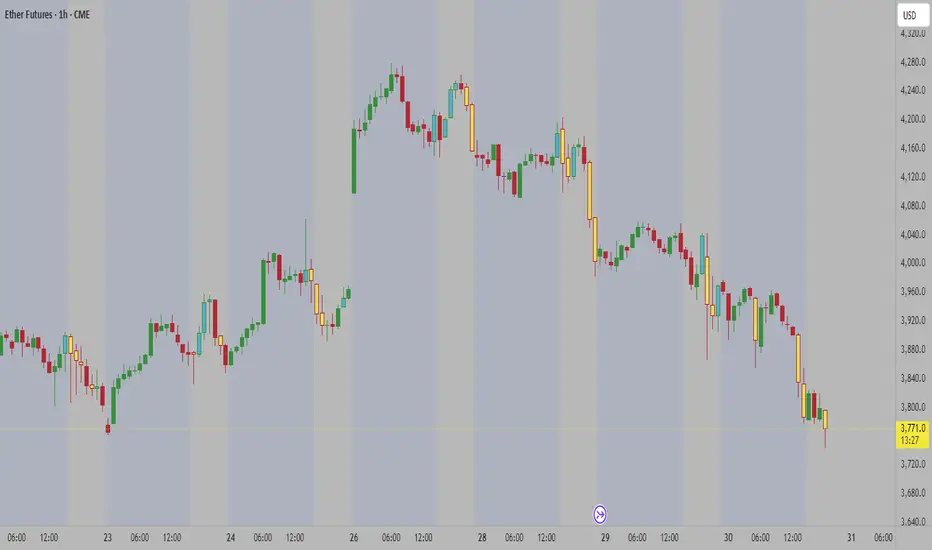
High Volume Vector Candles highlights candles where trading activity significantly exceeds the average, helping you quickly identify powerful moves driven by strong volume.
How it works:
- The script calculates a moving average of volume over a user-defined period.
- When current volume exceeds the chosen threshold (e.g. 150% of the average), the candle is marked as a high-volume event.
- Bullish high-volume candles are highlighted in blue tones, while bearish ones are shown in yellow, both with adjustable opacity.
This visualization makes it easier to spot potential breakout points, absorption zones, or institutional activity directly on your chart.
Customizable Settings:
• Moving average length
• Threshold percentage above average
• Bullish/Bearish highlight colors
• Opacity level
Ideal for traders who combine price action with volume analysis to anticipate market momentum.
Open-source Skript
Ganz im Sinne von TradingView hat dieser Autor sein/ihr Script als Open-Source veröffentlicht. Auf diese Weise können nun auch andere Trader das Script rezensieren und die Funktionalität überprüfen. Vielen Dank an den Autor! Sie können das Script kostenlos verwenden, aber eine Wiederveröffentlichung des Codes unterliegt unseren Hausregeln.
Haftungsausschluss
Die Informationen und Veröffentlichungen sind nicht als Finanz-, Anlage-, Handels- oder andere Arten von Ratschlägen oder Empfehlungen gedacht, die von TradingView bereitgestellt oder gebilligt werden, und stellen diese nicht dar. Lesen Sie mehr in den Nutzungsbedingungen.