OPEN-SOURCE SCRIPT
Aktualisiert Constance Brown RSI
*Re-uploading without House Violations*
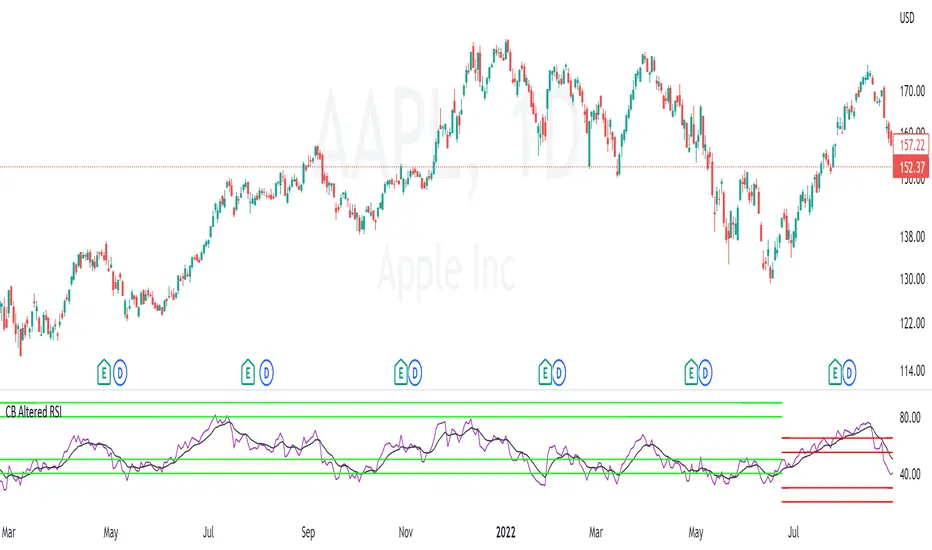
Welles Wilder created the RSI momentum oscillator in the 1970s. It is a momentum oscillator that ranges from 0 to 100. The traditional idea is to buy when the oscillator is below 30 and to sell when it is above 70. However, this strategy often only catches extreme moves and misses majority of the trend.
In comes Constance Brown RSI . She theorized that in an uptrend, the buy zone exists when RSI is between 40 and 50. The sell zone in an uptrend exists between 80 and 90. In a downtrend, the sell zone exists between 55 and 65. The buy zone in a downtrend exists between 20 and 30.
I have added a moving average feature to determine trend. When the short trend is above the long trend, it is considered an uptrend. It is in a downtrend otherwise. Using short length moving averages will often produce a lot of false signals. I recommend using the 50 and 100 as they will produce less noise.
There will be times when the oscillator breaks beyond the ranges described (for ex: seeing a reading below 40 in an uptrend). This tends to happen in periods of high volatility . Refer to the traditional RSI rules in such cases.
https://www.tradingview.com/x/of8R82ie
Versionshinweise
Added an EMA signal line. Buy the crossover from the support zone in an uptrend and sell the crossunder from the resistance zone in a downtrend. Open-source Skript
Ganz im Sinne von TradingView hat dieser Autor sein/ihr Script als Open-Source veröffentlicht. Auf diese Weise können nun auch andere Trader das Script rezensieren und die Funktionalität überprüfen. Vielen Dank an den Autor! Sie können das Script kostenlos verwenden, aber eine Wiederveröffentlichung des Codes unterliegt unseren Hausregeln.
Haftungsausschluss
Die Informationen und Veröffentlichungen sind nicht als Finanz-, Anlage-, Handels- oder andere Arten von Ratschlägen oder Empfehlungen gedacht, die von TradingView bereitgestellt oder gebilligt werden, und stellen diese nicht dar. Lesen Sie mehr in den Nutzungsbedingungen.
Open-source Skript
Ganz im Sinne von TradingView hat dieser Autor sein/ihr Script als Open-Source veröffentlicht. Auf diese Weise können nun auch andere Trader das Script rezensieren und die Funktionalität überprüfen. Vielen Dank an den Autor! Sie können das Script kostenlos verwenden, aber eine Wiederveröffentlichung des Codes unterliegt unseren Hausregeln.
Haftungsausschluss
Die Informationen und Veröffentlichungen sind nicht als Finanz-, Anlage-, Handels- oder andere Arten von Ratschlägen oder Empfehlungen gedacht, die von TradingView bereitgestellt oder gebilligt werden, und stellen diese nicht dar. Lesen Sie mehr in den Nutzungsbedingungen.