OPEN-SOURCE SCRIPT
Aktualisiert Oscillator Spectrogram
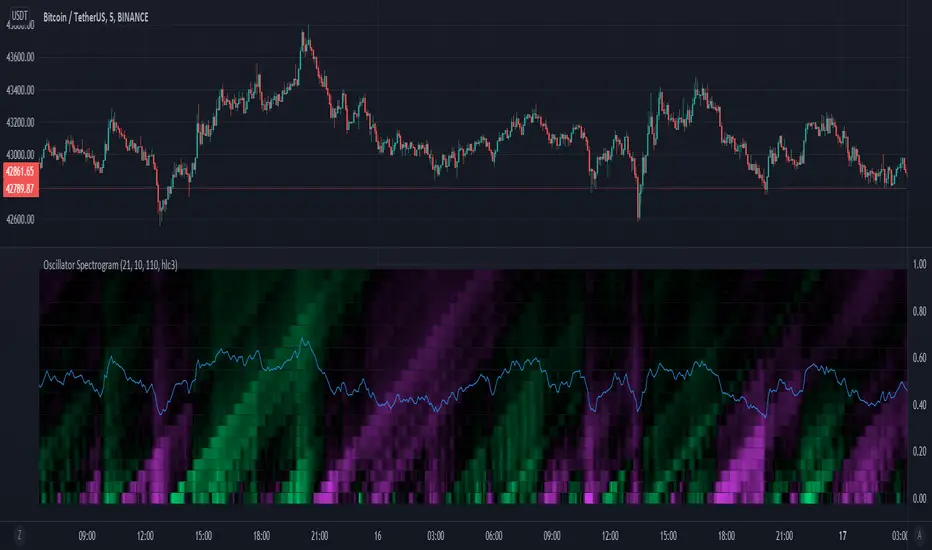
A spectrogram of simple oscillators over varying periods.
Oscillator periods increase from bottom to top.
Color indicates the value of the oscillator, with fuchsia indicating a negative value, black indicating a value around 0, and lime green indicating a value greater than 0.
The oscillators are simply the percentage of positive movement within a lookback period, with 50 percent centered at 0.
Vertical lines along the spectrogram indicate that multiple oscillators of different periods are changing values, indicating a shift in market character.
Versionshinweise
Added a line representing the average of all the oscillators.Versionshinweise
Removed accidental chart addition.Open-source Skript
Ganz im Sinne von TradingView hat dieser Autor sein/ihr Script als Open-Source veröffentlicht. Auf diese Weise können nun auch andere Trader das Script rezensieren und die Funktionalität überprüfen. Vielen Dank an den Autor! Sie können das Script kostenlos verwenden, aber eine Wiederveröffentlichung des Codes unterliegt unseren Hausregeln.
Haftungsausschluss
Die Informationen und Veröffentlichungen sind nicht als Finanz-, Anlage-, Handels- oder andere Arten von Ratschlägen oder Empfehlungen gedacht, die von TradingView bereitgestellt oder gebilligt werden, und stellen diese nicht dar. Lesen Sie mehr in den Nutzungsbedingungen.
Open-source Skript
Ganz im Sinne von TradingView hat dieser Autor sein/ihr Script als Open-Source veröffentlicht. Auf diese Weise können nun auch andere Trader das Script rezensieren und die Funktionalität überprüfen. Vielen Dank an den Autor! Sie können das Script kostenlos verwenden, aber eine Wiederveröffentlichung des Codes unterliegt unseren Hausregeln.
Haftungsausschluss
Die Informationen und Veröffentlichungen sind nicht als Finanz-, Anlage-, Handels- oder andere Arten von Ratschlägen oder Empfehlungen gedacht, die von TradingView bereitgestellt oder gebilligt werden, und stellen diese nicht dar. Lesen Sie mehr in den Nutzungsbedingungen.