OPEN-SOURCE SCRIPT
Aktualisiert SMA Ichimoku Crosses
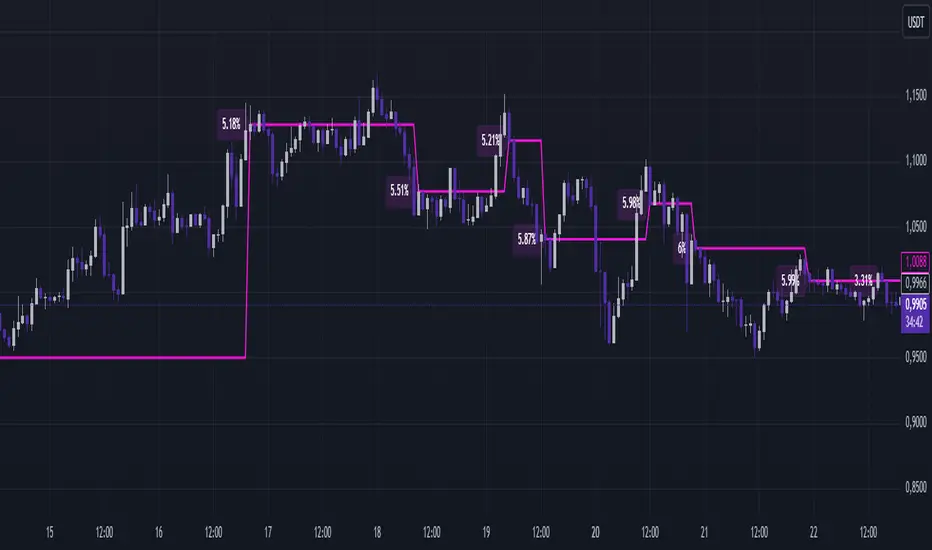
SMA Ichimoku Crosses displays the moving average between the last two crossings of the Tenkan-Sen and Kijun-Sen lines from Ichimoku Kinko Hyo. The line is calculated based on the closing prices at the time of the crossings and is added directly to the price chart, making it a convenient tool for trend analysis and identifying entry and exit points.
Features:
- Automatic calculation of Tenkan-Sen and Kijun-Sen lines.
- Fixation of closing prices at the point of line crossings.
- Calculation of the average price between the last two crossings.
- Display of a pink line on the price chart for convenient analysis.
How to use:
- Identify potential trend reversal zones by observing the line’s position relative to the price.
- Use the line as a dynamic level of support or resistance.
- Include the indicator in your Ichimoku strategies to enhance the accuracy of signals.
Suitable for:
- Traders using Ichimoku in their trading.
- Trend analysis enthusiasts.
- Those looking for additional filters for entry and exit points.
Versionshinweise
Price Maximum Deviation Analysis:Added calculation of the maximum percentage deviation of the price from the SMA (between Ichimoku crosses).
Helps assess volatility and identify potential risk levels.
Deviation History Storage:
Introduced the ability to analyze maximum deviations over recent periods (parameter Number of Breaks).
Deviation data is stored, allowing better analysis of price behavior over time.
Dynamic SMA Update:
The average price (avgPrice) is now fixed at the crossover point and used for subsequent calculations.
This helps to more accurately identify key levels on the chart.
Deviation Labels Display:
At each crossover, the indicator now displays a label showing the average maximum deviation over the selected period.
Provides a clear visual representation of market volatility.
This update makes the indicator more informative and useful for analyzing market conditions.
Open-source Skript
Ganz im Sinne von TradingView hat dieser Autor sein/ihr Script als Open-Source veröffentlicht. Auf diese Weise können nun auch andere Trader das Script rezensieren und die Funktionalität überprüfen. Vielen Dank an den Autor! Sie können das Script kostenlos verwenden, aber eine Wiederveröffentlichung des Codes unterliegt unseren Hausregeln.
Haftungsausschluss
Die Informationen und Veröffentlichungen sind nicht als Finanz-, Anlage-, Handels- oder andere Arten von Ratschlägen oder Empfehlungen gedacht, die von TradingView bereitgestellt oder gebilligt werden, und stellen diese nicht dar. Lesen Sie mehr in den Nutzungsbedingungen.