OPEN-SOURCE SCRIPT
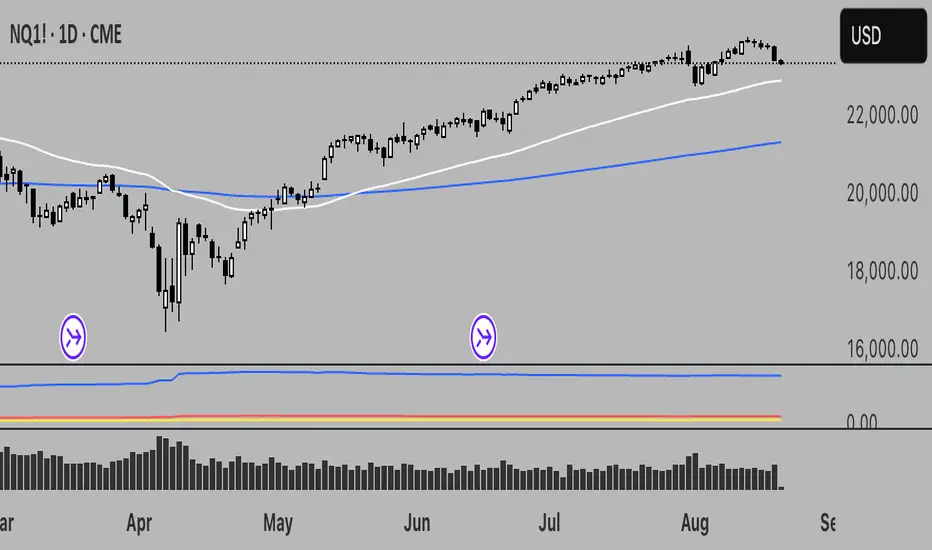
Aktualisiert Realized Volatility (StdDev of Returns, %)

📌 Realized Volatility (StdDev of Returns, %)
This indicator measures realized volatility directly from price returns, instead of the common but misleading approach of calculating standard deviation around a moving average.
🔹 How it works:
Computes close-to-close log returns (the most common way volatility is measured in finance).
Calculates the standard deviation of these returns over a chosen lookback period (default = 200 bars).
Converts results into percentages for easier interpretation.
Provides three key volatility measures:
Daily Realized Vol (%) – raw standard deviation of returns.
Annualized Vol (%) – scaled by √250 trading days (market convention).
Horizon Vol (%) – volatility over a custom horizon (default = 5 days, i.e. weekly).
🔹 Why use this indicator?
Shows true realized volatility from historical returns.
More accurate than measuring deviation around a moving average.
Useful for traders analyzing risk, position sizing, and comparing realized vs implied volatility.
⚠️ Note:
It is best used on the Daily Chart!
By default, this uses log returns (which are additive and standard in quant finance).
If you prefer, you can easily switch to simple % returns in the code.
Volatility estimates depend on your chosen lookback length and may vary across timeframes.
Versionshinweise
Realized Volatility (StdDev of Returns, %)This indicator measures realized volatility directly from price returns, instead of the common but misleading approach of calculating standard deviation around a moving average.
🔹 How it works:
Computes close-to-close log returns (the most common way volatility is measured in finance).
Calculates the standard deviation of these returns over a chosen lookback period (default = 200 bars).
Converts results into percentages for easier interpretation.
Provides three key volatility measures:
Daily Realized Vol (%) – raw standard deviation of returns.
Annualized Vol (%) – scaled by √252 trading days (market convention).
Horizon Vol (%) – volatility over a custom horizon (default = 5 days, i.e. weekly).
🔹 Why use this indicator?
Shows true realized volatility from historical returns.
More accurate than measuring deviation around a moving average.
Useful for traders analyzing risk, position sizing, and comparing realized vs implied volatility.
⚠️ Note:
By default, this uses log returns, which are additive and standard in quant finance.
If you prefer, you can easily switch to simple % returns in the code.
Volatility estimates depend on your chosen lookback length and may vary across timeframes.
Open-source Skript
Ganz im Sinne von TradingView hat dieser Autor sein/ihr Script als Open-Source veröffentlicht. Auf diese Weise können nun auch andere Trader das Script rezensieren und die Funktionalität überprüfen. Vielen Dank an den Autor! Sie können das Script kostenlos verwenden, aber eine Wiederveröffentlichung des Codes unterliegt unseren Hausregeln.
Haftungsausschluss
Die Informationen und Veröffentlichungen sind nicht als Finanz-, Anlage-, Handels- oder andere Arten von Ratschlägen oder Empfehlungen gedacht, die von TradingView bereitgestellt oder gebilligt werden, und stellen diese nicht dar. Lesen Sie mehr in den Nutzungsbedingungen.