OPEN-SOURCE SCRIPT
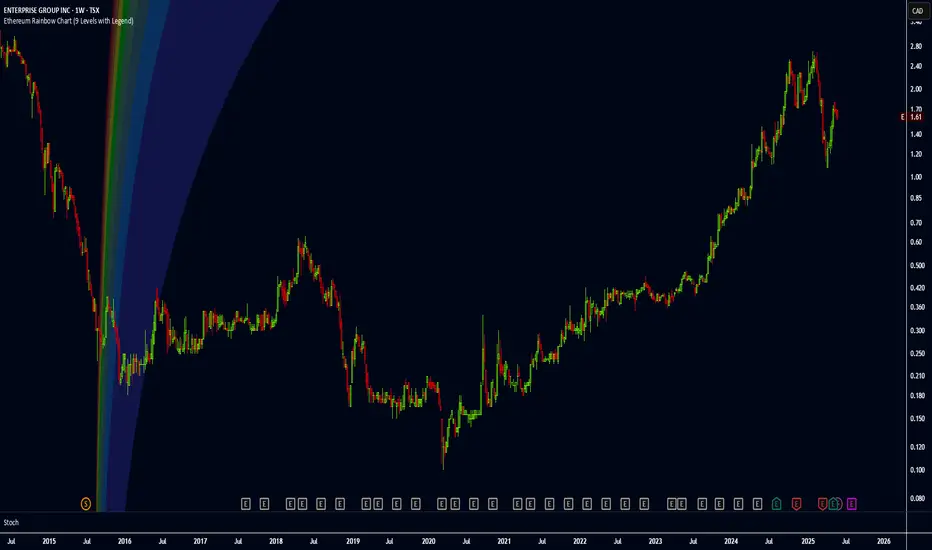
Ethereum Rainbow Chart (9 Levels with Legend)

The Ethereum Rainbow Chart is a long-term, color-coded chart that displays Ethereum’s price on a logarithmic scale to show historical trends and growth patterns. It uses colored bands to highlight different price zones, helping to visualize how ETH’s price has moved over time without focusing on short-term fluctuations.
Open-source Skript
Ganz im Sinne von TradingView hat dieser Autor sein/ihr Script als Open-Source veröffentlicht. Auf diese Weise können nun auch andere Trader das Script rezensieren und die Funktionalität überprüfen. Vielen Dank an den Autor! Sie können das Script kostenlos verwenden, aber eine Wiederveröffentlichung des Codes unterliegt unseren Hausregeln.
Haftungsausschluss
Die Informationen und Veröffentlichungen sind nicht als Finanz-, Anlage-, Handels- oder andere Arten von Ratschlägen oder Empfehlungen gedacht, die von TradingView bereitgestellt oder gebilligt werden, und stellen diese nicht dar. Lesen Sie mehr in den Nutzungsbedingungen.