OPEN-SOURCE SCRIPT
Aktualisiert Auto Trend Projection
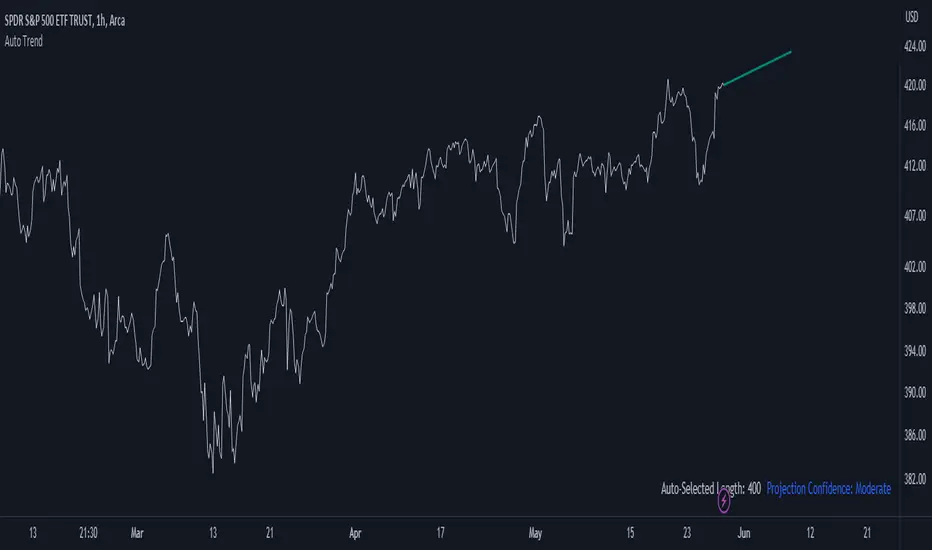
Auto Trend Projection is an indicator designed to automatically project the short-term trend based on historical price data. It utilizes a dynamic calculation method to determine the slope of the linear regression line, which represents the trend direction. The indicator takes into account multiple length inputs and calculates the deviation and Pearson's R values for each length.
Using the highest Pearson's R value, Auto Trend Projection identifies the optimal length for the trend projection. This ensures that the projected trend aligns closely with the historical price data.
The indicator visually displays the projected trend using trendlines. These trendlines extend into the future, providing a visual representation of the potential price movement in the short term. The color and style of the trendlines can be customized according to user preferences.
Auto Trend Projection simplifies the process of trend analysis by automating the projection of short-term trends. Traders and investors can use this indicator to gain insights into potential price movements and make informed trading decisions.
Please note that Auto Trend Projection is not a standalone trading strategy but a tool to assist in trend analysis. It is recommended to combine it with other technical analysis tools and indicators for comprehensive market analysis.
Overall, Auto Trend Projection offers a convenient and automated approach to projecting short-term trends, empowering traders with valuable insights into the potential price direction.
Versionshinweise
I have added a table to display the Auto-Selected Length and Projection Confidence.Open-source Skript
Ganz im Sinne von TradingView hat dieser Autor sein/ihr Script als Open-Source veröffentlicht. Auf diese Weise können nun auch andere Trader das Script rezensieren und die Funktionalität überprüfen. Vielen Dank an den Autor! Sie können das Script kostenlos verwenden, aber eine Wiederveröffentlichung des Codes unterliegt unseren Hausregeln.
Plan the trade ⚡ Trade the plan
Haftungsausschluss
Die Informationen und Veröffentlichungen sind nicht als Finanz-, Anlage-, Handels- oder andere Arten von Ratschlägen oder Empfehlungen gedacht, die von TradingView bereitgestellt oder gebilligt werden, und stellen diese nicht dar. Lesen Sie mehr in den Nutzungsbedingungen.
Open-source Skript
Ganz im Sinne von TradingView hat dieser Autor sein/ihr Script als Open-Source veröffentlicht. Auf diese Weise können nun auch andere Trader das Script rezensieren und die Funktionalität überprüfen. Vielen Dank an den Autor! Sie können das Script kostenlos verwenden, aber eine Wiederveröffentlichung des Codes unterliegt unseren Hausregeln.
Plan the trade ⚡ Trade the plan
Haftungsausschluss
Die Informationen und Veröffentlichungen sind nicht als Finanz-, Anlage-, Handels- oder andere Arten von Ratschlägen oder Empfehlungen gedacht, die von TradingView bereitgestellt oder gebilligt werden, und stellen diese nicht dar. Lesen Sie mehr in den Nutzungsbedingungen.