INVITE-ONLY SCRIPT
Wig20 Volume Stats
Aktualisiert
The WIG20 index is a price index of the largest listed companies on the GPW/WSE. The index value is calculated based on the turnover and share prices of the 20 largest listed companies. The initial index level on April 16, 1994 was 1,000 points.
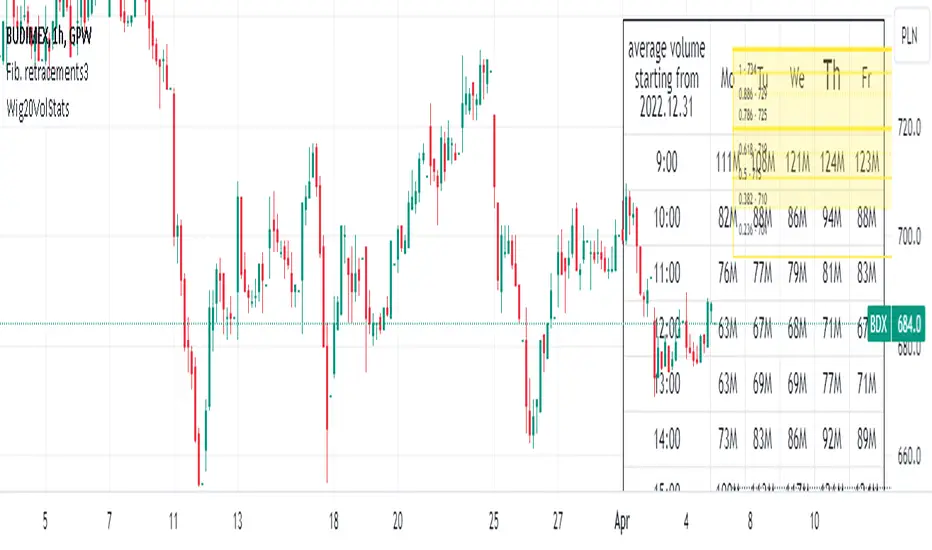
Wig20 Volume Stats script is merging data from different sources and calculates volume or cash flow on all Wig20 companies. Script includes data starting from 1.01.2010. Some companies included in the Wig20 in that period are no longer listed on the GPW/WSE. TradingView no longer provides data of these companies. In result, some historical periods are affected by missing part of the data. This does not affect the data presenting the current composition of the Wig20 index.
Script can analyze data in few ways and show statistics in the table on the right corner of the screen - Controlled by type param in script settings.
This script can be used by ANY user. You DO NOT NEED to have PRO or PREMIUM account to use it.
This script is a part of a bigger package called "Wig20". In that package we have:
Wig20 Volume - Chart showing volume/cash flow on Wig20 index.
Wig20 Volume Stats - Volume statistics compared with similar periods in history.
Wig20 Sentiment - Wig20 sentiment in +2 and +9 months time period.
Wig20 Expectation - Wig20 expectations in +2 and +9 months time period.
Wig20 Impact - Script showing expected impact of price change of particular instrument on the Wig20 index.
Script settings:
Type - Type of statistics shown in the right-top table.
- WD-V - Volume Data splitted into days
- WD-V% - Volume data splitted into days and compared to historical data
- WH-V - Volume data splitted into hours
- WH-T/L - Volume data splitted into hours and compare this and last week data
- WH-T/L% - Volume data splitted into hours and this / last week volume in %
- WH-AV - Average volume data splitted into hours
- WH-T/AV% - This week as percent of average volume data splitted into hours in %
Units - Units used in the statistics:
PLN - Cash in PLN
K PLN - Cash in k PLN (/1 000)
M PLN - Cash in m PLN (/1 000 000)
Bold current - Highligh current day and value with text bolding.
Extend hours - Showing 8:00-18:00 hours instead of 9:00-17:00
Average Volume: Start date - Start date for calculating average volume.
Highlight values bigger than current - Enable highlighs and pick color.
Troubleshooting:
In case of any problems, send error details to the author of the script.
Versionshinweise
Update index Skript nur auf Einladung
Der Zugriff auf dieses Skript ist auf vom Autor autorisierte User beschränkt und normalerweise kostenpflichtig. Sie können es zu Ihren Favoriten hinzufügen, aber Sie können es nur verwenden, nachdem Sie die Erlaubnis angefordert und vom Autor erhalten haben. Kontaktieren Sie Investor_R für weitere Informationen oder folgen Sie den Anweisungen des Autors unten.
TradingView empfiehlt nicht, ein Script zu kaufen, wenn Sie den Autor nicht zu 100 % als vertrauenswürdig halten, oder nicht verstehen, wie das Script funktioniert. In vielen Fällen können Sie auch eine gute und kostenlose Open-Source-Alternative in unseren Community-Scripts entdecken.
Hinweise des Autors
″To get access or report problem write on toolkit4trading@proton.me
Möchten Sie dieses Skript auf einem Chart verwenden?
Warnung: Bitte lesen Sie dies, bevor Sie Zugriff anfordern.
To get access or report problem write on toolkit4trading@proton.me
More details on Website and Youtube.
More details on Website and Youtube.
Haftungsausschluss
Die Informationen und Veröffentlichungen sind nicht als Finanz-, Anlage-, Handels- oder andere Arten von Ratschlägen oder Empfehlungen gedacht, die von TradingView bereitgestellt oder gebilligt werden, und stellen diese nicht dar. Lesen Sie mehr in den Nutzungsbedingungen.