OPEN-SOURCE SCRIPT
Stochastic RSI - WT Confluence Signals (TraderDemircan)
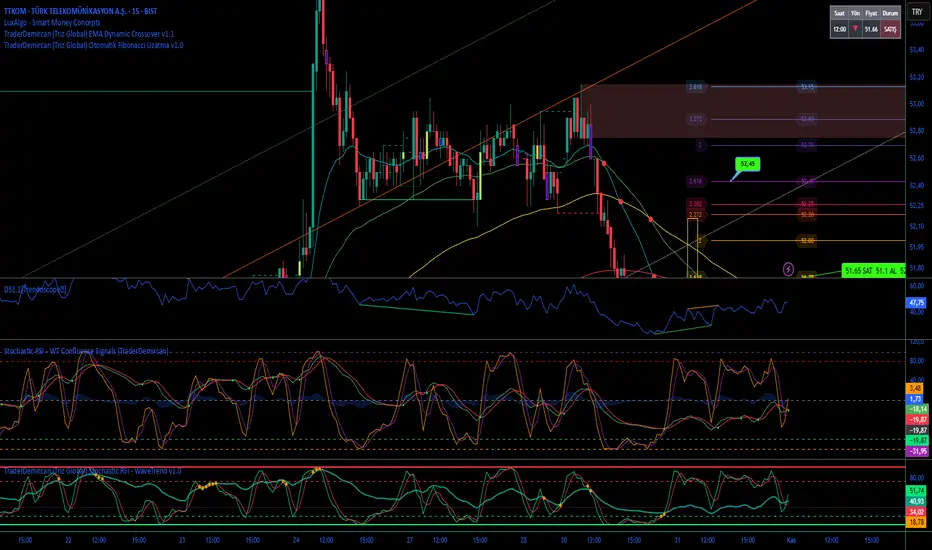
WAVETREND & STOCHASTIC RSI CONFLUENCE SIGNALS
What this indicator does?
This indicator combines WaveTrend and Stochastic RSI oscillators to identify high-probability trading opportunities through confluence signals. It generates alerts when both oscillators simultaneously indicate overbought or oversold conditions with crossovers.
Why combine these two?
- WaveTrend: Detects trend momentum and cycle turning points
- Stochastic RSI: Identifies extreme overbought/oversold levels
- CONFLUENCE: When both agree, signal reliability increases significantly
Unlike simple mashups, this script normalizes Stochastic RSI to WaveTrend's scale (-100 to +100) for easier visual comparison and implements a specific confluence logic.
How it works?
WAVETREND CALCULATION:
- Uses HLC3 average with EMA smoothing
- Channel Length (n1=10) for initial smoothing
- Average Length (n2=21) for trend line
- Overbought zones: +53 to +60 and above
- Oversold zones: -53 to -60 and below
STOCHASTIC RSI CALCULATION:
- RSI Period: 14
- Stochastic Period: 14
- K-Smooth: 3, D-Smooth: 3
- Normalized to -100/+100 range to match WT scale
- Overbought: >80, Oversold: <20
CONFLUENCE SIGNALS:
🔴 SELL: WT crosses down AND both in overbought zones
🟢 BUY: WT crosses up AND both in oversold zones
How to use?
1. Wait for BOTH oscillators to enter extreme zones
2. Look for WaveTrend crossover (green/red circles)
3. Colored bars indicate confluence signals:
• Yellow bars: Potential buy (WT cross up)
• Blue bars: Potential sell (WT cross down)
4. Use with price action and support/resistance for confirmation
Disclaimer
This is not financial advice. Always use proper risk management and combine with other analysis methods. Past performance does not guarantee future results.
═══════════════════════════════════════
Open-source Skript
Ganz im Sinne von TradingView hat dieser Autor sein/ihr Script als Open-Source veröffentlicht. Auf diese Weise können nun auch andere Trader das Script rezensieren und die Funktionalität überprüfen. Vielen Dank an den Autor! Sie können das Script kostenlos verwenden, aber eine Wiederveröffentlichung des Codes unterliegt unseren Hausregeln.
Haftungsausschluss
Die Informationen und Veröffentlichungen sind nicht als Finanz-, Anlage-, Handels- oder andere Arten von Ratschlägen oder Empfehlungen gedacht, die von TradingView bereitgestellt oder gebilligt werden, und stellen diese nicht dar. Lesen Sie mehr in den Nutzungsbedingungen.