OPEN-SOURCE SCRIPT
FXS
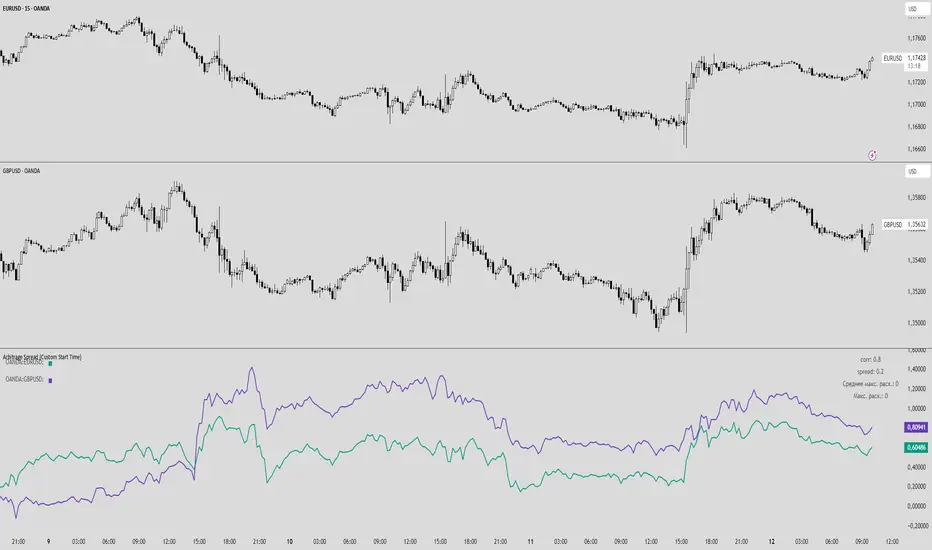
Arbitrage Spread (Custom Start Time)
This indicator analyzes the spread and correlation between two selected instruments or currency pairs.
Key Features:
Displays the percentage change of the two instruments in a separate chart (does not overlay the main chart).
Lines show the entire historical price movement of the selected instruments.
Calculates the current spread and correlation from a chosen date and time (default — last Monday 00:00).
Spread and corr values are rounded to two decimal places for convenience.
The top-right table displays:
corr — correlation coefficient between the instruments,
spread — current spread between the pairs,
Average max deviation for the period — manual input,
Maximum deviation for the entire period — manual input.
The top-left table shows the color of each pair for clarity.
Alerts can be set for specific corr and spread values.
Features:
Historical lines allow visual tracking of dynamics over the entire available period.
Current spread is calculated separately from the selected start time, allowing analysis of current conditions without affecting historical visualization.
Fully customizable: line colors, calculation period, start date/time for spread, manual statistical data.
Open-source Skript
Ganz im Sinne von TradingView hat dieser Autor sein/ihr Script als Open-Source veröffentlicht. Auf diese Weise können nun auch andere Trader das Script rezensieren und die Funktionalität überprüfen. Vielen Dank an den Autor! Sie können das Script kostenlos verwenden, aber eine Wiederveröffentlichung des Codes unterliegt unseren Hausregeln.
Haftungsausschluss
Die Informationen und Veröffentlichungen sind nicht als Finanz-, Anlage-, Handels- oder andere Arten von Ratschlägen oder Empfehlungen gedacht, die von TradingView bereitgestellt oder gebilligt werden, und stellen diese nicht dar. Lesen Sie mehr in den Nutzungsbedingungen.