OPEN-SOURCE SCRIPT
Combined Stock Session Percent Change Monitor
Introducing the "Combined Stock Session Percent Change Monitor" - a unique tool tailored for traders who wish to track the collective performance of up to five stocks in real-time during a trading session.
Key Features:
User Customization: Easily input and monitor any five stock symbols of your choice. By default, the script tracks "AAPL", "MSFT", "AMZN", "TSLA", and "NVDA".
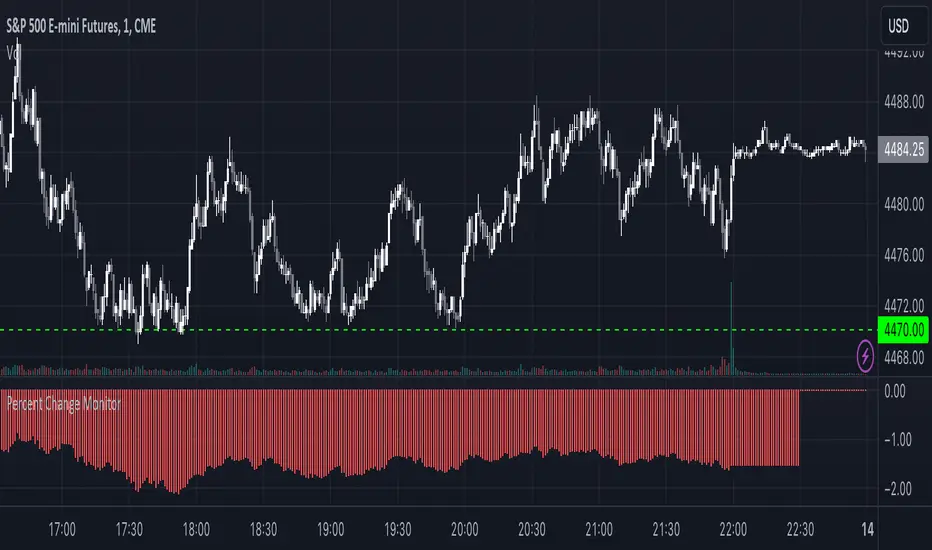
Session-Based Tracking: The script captures and calculates the percentage change from the start of a trading session, set at 15:30. This allows traders to gauge intraday performance.
Visual Clarity: The combined percentage change is plotted as columns, with green indicating a positive change and red indicating a negative change. This provides a clear, visual representation of the stocks' collective performance.
Versatility: Whether you're tracking the performance of stocks in a specific sector, or you're keeping an eye on your personal portfolio's top holdings, this tool offers a concise view of collective stock movement.
Usage:
Simply input the desired stock symbols and let the script do the rest. The plotted columns will provide a quick snapshot of how these stocks are performing collectively since the session's start.
Conclusion:
Stay ahead of the market by monitoring the combined performance of your chosen stocks. Whether you're an intraday trader or a long-term investor, this tool offers valuable insights into collective stock behavior. Happy trading!
(Note: Always conduct your own research and due diligence before making any trading decisions. This tool is meant to aid in analysis and not to serve as financial advice.)
Key Features:
User Customization: Easily input and monitor any five stock symbols of your choice. By default, the script tracks "AAPL", "MSFT", "AMZN", "TSLA", and "NVDA".
Session-Based Tracking: The script captures and calculates the percentage change from the start of a trading session, set at 15:30. This allows traders to gauge intraday performance.
Visual Clarity: The combined percentage change is plotted as columns, with green indicating a positive change and red indicating a negative change. This provides a clear, visual representation of the stocks' collective performance.
Versatility: Whether you're tracking the performance of stocks in a specific sector, or you're keeping an eye on your personal portfolio's top holdings, this tool offers a concise view of collective stock movement.
Usage:
Simply input the desired stock symbols and let the script do the rest. The plotted columns will provide a quick snapshot of how these stocks are performing collectively since the session's start.
Conclusion:
Stay ahead of the market by monitoring the combined performance of your chosen stocks. Whether you're an intraday trader or a long-term investor, this tool offers valuable insights into collective stock behavior. Happy trading!
(Note: Always conduct your own research and due diligence before making any trading decisions. This tool is meant to aid in analysis and not to serve as financial advice.)
Open-source Skript
Ganz im Sinne von TradingView hat dieser Autor sein/ihr Script als Open-Source veröffentlicht. Auf diese Weise können nun auch andere Trader das Script rezensieren und die Funktionalität überprüfen. Vielen Dank an den Autor! Sie können das Script kostenlos verwenden, aber eine Wiederveröffentlichung des Codes unterliegt unseren Hausregeln.
Haftungsausschluss
Die Informationen und Veröffentlichungen sind nicht als Finanz-, Anlage-, Handels- oder andere Arten von Ratschlägen oder Empfehlungen gedacht, die von TradingView bereitgestellt oder gebilligt werden, und stellen diese nicht dar. Lesen Sie mehr in den Nutzungsbedingungen.