OPEN-SOURCE SCRIPT
Aktualisiert Dynamic 21 SMA Zone S/R (Weekly and 2-Day)

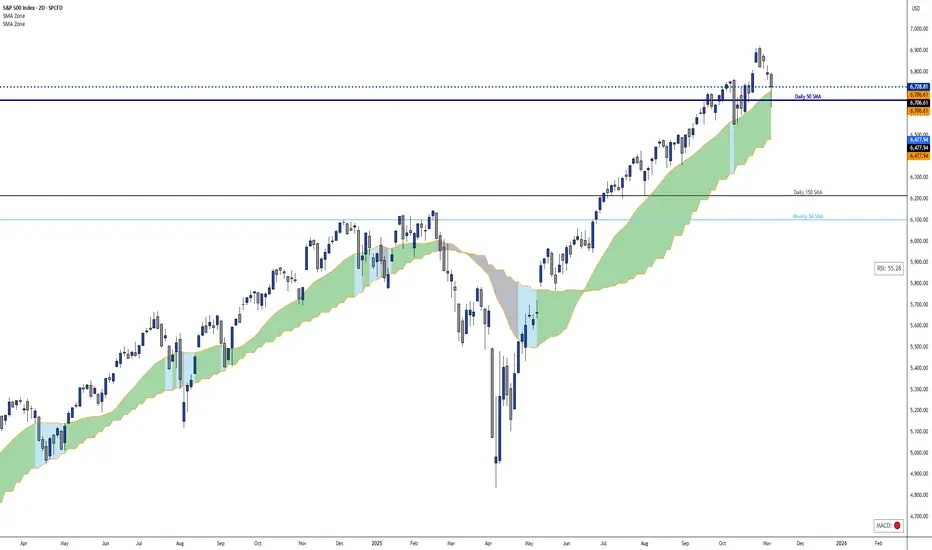
This custom indicator creates a dynamic support and resistance zone based on the 21-period Simple Moving Average (SMA) from the weekly timeframe and the 21-period SMA from the 2-day timeframe. The zone is visible and functional across all chart timeframes, adapting seamlessly to provide multi-timeframe insights.
Color Logic:
Green: When the current price is fully above the upper boundary of the zone, indicating potential bullish strength or a support level.
Gray: When the price is fully below the lower boundary, signaling potential bearish pressure or a resistance level.
Light Blue: When the price is within the zone (between the two SMAs), representing a neutral "no man's land" where the market is indecisive.
As the two SMAs converge or diverge, the zone naturally thins or widens, visually reflecting changes in market momentum—such as a thinning green zone during a potential reversal. Ideal for higher-timeframe swing trading to identify key levels, this indicator is also useful on lower timeframes for gauging the relative position of these SMAs, helping traders align short-term moves with broader trends.
Versionshinweise
This custom indicator creates a dynamic support and resistance zone based on the 21-period Simple Moving Average (SMA) from the weekly timeframe and the 21-period SMA from the 2-day timeframe. The zone is visible and functional across all chart timeframes, adapting seamlessly to provide multi-timeframe insights.Color Logic:
Green: When the current price is fully above the upper boundary of the zone, indicating potential bullish strength or a support level.
Gray: When the price is fully below the lower boundary, signaling potential bearish pressure or a resistance level.
Light Blue: When the price is within the zone (between the two SMAs), representing a neutral "no man's land" where the market is indecisive.
As the two SMAs converge or diverge, the zone naturally thins or widens, visually reflecting changes in market momentum—such as a thinning green zone during a potential reversal. Ideal for higher-timeframe swing trading to identify key levels, this indicator is also useful on lower timeframes for gauging the relative position of these SMAs, helping traders align short-term moves with broader trends.
Versionshinweise
Added a daily and weekly 50 SMA as two horizontal lines, visible on all time frames.Versionshinweise
Added a Daily 150 SMA line.The current RSI value box is positioned in the middle right.
The MACD bullish or bearish crossover signal box is located in the bottom right.
All of these features can be turned on or off in the indicator settings.
Open-source Skript
Ganz im Sinne von TradingView hat dieser Autor sein/ihr Script als Open-Source veröffentlicht. Auf diese Weise können nun auch andere Trader das Script rezensieren und die Funktionalität überprüfen. Vielen Dank an den Autor! Sie können das Script kostenlos verwenden, aber eine Wiederveröffentlichung des Codes unterliegt unseren Hausregeln.
Haftungsausschluss
Die Informationen und Veröffentlichungen sind nicht als Finanz-, Anlage-, Handels- oder andere Arten von Ratschlägen oder Empfehlungen gedacht, die von TradingView bereitgestellt oder gebilligt werden, und stellen diese nicht dar. Lesen Sie mehr in den Nutzungsbedingungen.